Narsito
COLLABORATIVE TRIAL AND QUALITY CONTROL IN CHEMICAL ANALYSIS
Narsito
Chemistry Department, Faculty of Mathematics and Natural Sciences Gadjah Mada University, Yogyakarta
ABSTRACT
This paper deals with some practical problems related to the quality of analytical chemical data usually met in practice. Special attention is given to the topic of quality control in analytical chemistry, since analytical data is one of the primary information from which some important scientifically based decision are to be made. The present paper starts with brief description on some fundamental aspects associated with quality of analytical data, such as sources of variation of analytical data, criteria for quality of analytical method, quality assurance in chemical analysis. The assessment of quality parameter for analytical method like the use of standard materials as well as standard methods is given. Concerning with the quality control of analytical data, the use of several techniques, such as control samples and control charts, in monitoring analytical data in quality control program are described qualitatively. In the final part of this paper, some important remarks for the preparation of collaborative trials, including the evaluation of accuracy and reproducibility of analytical method are also given
Keywords: collaborative trials, quality control, analytical data
INTRODUCTION
Quality control in chemical analysis is an old concept. As long as there has been chemical analysis, there has been the need to control the quality of its performance. The management of a laboratory has a need to estimate the quality of its efforts and if quality does not meet the standards, to improve it. The gradual change in attitude toward the concept of quality control in chemical analysis has only had a short history.
The first impact on quality control in analytical chemistry was caused by the introduction of a control chart familiarized by Shewhart. Such a chart allows continuous supervision of the quality parameters, accuracy and precision, in an analytical laboratory. Since the application of statistics in the validation of analytical results, it is generally accepted that apart from accuracy and precision, the speed of analysis, the frequency of sampling, and their merit for the application of the analytical results could also be quantified and optimized.
In the early 1970’s, some incidents occurred involving certain research laboratory in the United States, where the validity of a number of their reports of studies was questionable. For this reason, in 1976, the FDA (US Food and Drug Administration) issued “Good Laboratory Practice (GLP) Regulation”, concerning the organization and circumstances under which laboratory research is planned, conducted, monitored, registered, and reported; since then a number of other governmental authorities in the United States
and other countries have issued similar regulations. The OECD (Organization for Economic Cooperation and Development) Principles of Good Laboratory Practice was developed from similar activities in Europe.
The development resulted in the growing interest in the development and application of quality control and quality assurance programs, including in those laboratories that do not fall under the GLP regulations, with the objective to organize the laboratory in such a way that the number of errors and mistakes is minimized. At present, a number of quality management and quality assurance standards have been issued all over the world. A great effort has been given into the harmonization to the different standards based on the ISO-9000 series of standards.
SOURCES OF VARIATION IN CHEMICAL ANALYSIS
A chemical analysis of a material as an object gives information on the characteristics of that material, or a sample of that material, in term of chemical composition, which is usually classified as qualitative and quantitative chemical analysis. A qualitative chemical analysis describes the sample in terms of the identity of the composing parts; whereas a quantitative chemical analysis also gives the quantity of each of the composing parts in the samples.
Narsito
measurement of analytical signals, (4) calibration and data processing, (5) testing, controlling, and eventually correcting of the data processing stages, and (6) establishing a quality merit.
For a variety of reasons, analytical data obtained in chemical analysis are subject to experimental errors, resulting in differences between the true value and the analytical data obtained. In general, three types of experimental errors are recognized, i.e. gross errors, random errors, and systematic errors [1].
Gross Errors. This type of errors may be
classified as errors, which are so serious that there is no real alternative to abandoning the chemical analysis and making a completely fresh start. Since this type of errors is normally very easily recognized, further discussion is not required.
Random Errors. This type of errors occurs as
a cumulative result of a series of simple, indeterminate variations. Such random error gives rise to results which (unless the mean value approaches zero) will show a normal Gossip distribution, about the mean. Although random errors can not be avoided, they can be reduced by careful statistical technique.
Systematic Errors. This type of errors is due
to controlled or fixed-effect factors causing all analytical data are in error in the same sense. Systematic errors are usually constant in character, and although they can be controlled to some extent, they can not be treated statistically. They do, however, significantly influence the statistical assessment of random errors, and as a result such chemical analysis reflect the total errors, both random and systematic errors.
The major effect of the introduction of systematic errors into chemical analysis may be to shift the position of the mean of a set of analytical readings relative to the original mean. It may not obviously affect the distribution of readings about the new mean and so the analytical data would show similar values for the standard deviation. Such analytical data are said to show ”bias" towards either the positive (an increase in the mean) or the negative (a decrease in the mean) depending on the direction of displacement.
Analytical instruments used for performing chemical analysis may be one of potential source of error. For example, because there are many components in an analytical instrument, each one showing some degree of instability, measurements made with that instrument will show a particular random error. Another example, faults in design can result in additional variations which may, for instance, be attributed to the fatigue of components when the instrument is used for a long period of time, resulting in a drift in the readings.
Many analytical methods suffers to some extent from interference, which if it is only slight or occasional, may be overlooked or ignored, resulting in the introduction of systematic errors. It is also possible for a perfectly valid analytical method to become less valid when it is used under inappropriate conditions. For example, the potentiometric measurement of pH is temperature dependent and the use of reference of test solutions at deferent temperatures without any compensation will result in error.
Since the misuse of analytical instruments or equipment will cause an increase in the variation between replicate results, the number of manipulation should be kept to a minimum in designing and using a particular analytical method, and such manipulation should be undertaken carefully with an appreciation of the potential sources of errors.
CRITERIA FOR QUALITY OF ANALYTICAL METHODS
In 1979, Kateman and Djikstra [2] proposed that the tasks of analytical chemistry, as a fading discipline may be formulated within three levels of categories or definitions, namely :
1. Produces information by application of available analytical procedures in order to characterize matter by its composition;
2. Studies the processes of gathering information by using principles of several disciplines in order to characterize matter or systems; and
3. Produces strategies for obtaining information by the optimal use of available analytical procedures in order to characterize matter or systems.
The first level refers to the actual production of analytical results, where instruments, procedures, and skilled personnel are required; and the second level covers the research and development of analytical procedures. The third level might be considered as an organizational level, which comprises the interaction between humans and machines, including communication as well as the optimal use of the analytical tools available for producing information. In practice, of course, these levels are interwoven, but the division seems to be indispensable for a new approach in quality control.
Narsito
be defined as the value of a set of desired properties, it is important to describe the quality parameter that denotes the quality of a certain property of chemical analysis. Furthermore, how quality parameter can be influenced and what features determine the ultimate or optimal quality are also necessary to be discussed.
Precision. The precision is a quality
parameter of an analytical method giving a figure to the closeness of a number of replicate chemical analyses and is affected by the random error associated with the method. Analytical Chemistry [3] proposes the following : “Precision refers to the reproducibility of measurement within a number of independent replicate measurements of the same property, that is, to the scatter or dispersion of a set about its central value”.
The international organization for standardization, ISO, applies two description of precision : (1) The reproducibility, the closeness of agreement between individual analytical results obtained with the same analytical method but under different conditions, and (2) The
repeatability, the closeness of agreement between
successive analytical results obtained with the same analytical method and under the same conditions.
Quantitatively, the variance, or its square root, standard deviation of a large number of independent replicate measurements is usually used as an estimate for the precision of the analytical method (the analytical data dispersion). A measure of dispersion that has no theoretical value but is sometimes use as a quality criterion is the coefficient of variation, or the relative standard deviation (RSD), the standard deviation expressed as a percentage of the arithmetic mean.
Accuracy. Accuracy is another quality
parameter of an analytical method giving a figure to the closeness between the true value and the analytical data obtained by the analytical method. In a paper published in Analytical Chemistry it is stated : “Accuracy normally refers to the difference (error or bias) between the mean obtained within a number of independent replicate measurements and the value which is accepted as the true or correct value for the quantity measured”.
The commission on analytical nomenclature of IUPAC uses the word of “bias" to denote accuracy. The mean of the differences, having regard to sign, of the results from the true value. This equals the difference between the mean of a series of results and the true value”.
The commission on spectrochemical and other optical procedures for analysts of IUPAC stated : “Accuracy relates to the agreement between the measured concentration and the
value. The principal limitation on accuracy are : (a) random errors, (b) systematic errors due to bias in given analytical procedure; bias represents the positive or negative deviation of the mean analytical result from known or assumed true value, and (c) in multi-component system of elements, the treatment of inter-element effects may involve some degree of approximation that leads to reproducible but incorrect estimates of concentrations”.
Since most analytical methods claim to give the true value, accuracy as such is seldom used as a quality criterion. Often, the difference between the mean value obtained a number of independent replicate measurements and the mean value of a much larger number of independent replicate measurements is taken for accuracy.
Although accuracy can not be quantified without elaborate calculations, it is possible to measure some properties that are related to the concept of accuracy. In analytical chemistry, often the only requirement for an analytical result is that it be comparable with other results. Therefore, as a rule : results of analysis are compared with results obtained from the analysis of “standards” or “reference materials”, i.e. materials with known or assumed properties. The property of the standard to be known can be obtained in various ways.
Primary (Pure) Standards. The theoretical
composition of material of high purity can be used. The purity of these materials must be ascertained by independent methods. These types of standards are used in spectroscopy and titrimetry.
Secondary (Reference) Standards. The
composition of these materials is measured by agreed-on methods by internationally qualified institutions. A well known institution in the United States that submits certified material is the National Institute of Standards and Technology (NIST), formerly the National Bureau of Standards (NBS). In Europe, the Bureau Communataire de
Reference (BCR) in Brussels fulfills this task.
Where possible, the NIST certifies the numerical value of the property (ies) under investigation as “accurate”: that is, within stated uncertainty they are “true values”.
Standard Analytical Methods. The
Narsito
be a “true value”. This method of ensuring accuracy is often used in trade.
Mean is True. The mean of analytical results
obtained from a number of independent, selected laboratories can be assumed to be “the true value”. In this case, it must be ascertained that all participating laboratories use comparable methods of data presentation and data handling.
Sensitivity and Limit of Detection
The limit of detection is a quality parameter pertaining to chemical analysis [4]. It gives the minimum concentration of a component that can be detected with a certainty. A commonly used definition in the literature of analytical chemistry for the limit of detection is the analyte concentration giving a signal equal to the blank signal plus three standard deviation of the blank. It is influenced by the absolute value of blank, standard deviation of the analytical method, and safety factor. The lowest possible limit of detection is determined by the characteristics of the analytical method.
Sensitivity is a quality parameter of an analytical method. It measures the change of an analytical signal upon a change of analyte concentration. The sensitivity of an analytical method is a practical quality measure, since it pertains to the ease of detection. However, both the detection of a difference in concentration between two samples and the limit of detection are ultimately governed by the precision of the analytical method and not by the sensitivity.
Selectivity and Specificity
The selectivity and the specificity are quality parameter of an analytical method, which can be expressed as the ratio of sensitivities of the method for various components to be measured in the sample.
QUALITY ASSURANCE IN CHEMICAL ANALYSIS
In order to produce reliable analytical data, all analytical methods should be carefully selected or designed and their precision and accuracy must be determined. The stability of the samples should be investigated and their subsequent handling controlled in an appropriate manner. The attitude of the staffs involved in the chemical analysis is vital importance : they must be motivated to produce valid analytical data and to take a pride in the quality of the final product.
Quality Control
As addition to the organizational approach, it is desirable to devise a system, which will give a warning when unforeseen factors cause a loss in either the accuracy and/or the precision of the analytical method. This is usually done by the analysis of a control sample with each batch of tests and it is essentially a predictive monitoring of quality.
1. Control Samples
A control sample is a sample for which the concentration of the test analyte is known and treated in an identical manner to the test samples. It should ideally be of a similar overall composition to the test samples in order to show similar physical and analytical features. A control sample will be one of many a larger sample, stored under suitable conditions and for which the between batch mean and standard deviation of many replicates have been previously determined.
Control samples should be analyzed along with the test samples and unidentified as such by the analyst. Knowing the mean value for the control sample and the precision expected from the analytical method used, it is possible to define limits within which single control analytical data should normally fall. The basis of a quality assurance program is the assumption that : (1) if single control analytical data falls within the pre-defined limits, the analytical method is under control and the test analytical data obtained at the same time are valid, and (2) if single control analytical data falls outside the pre-defined limits, it is likely that the test analytical data are in error and therefore they must be rejected.
2. Control Charts
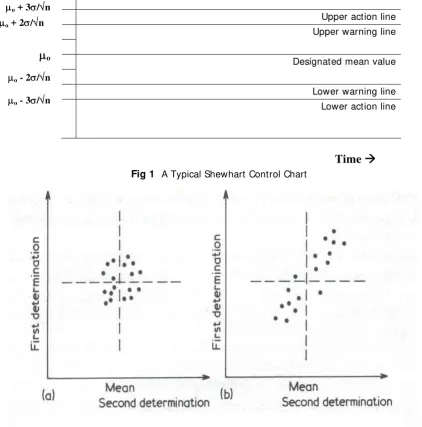
It is often helpful to record the analytical results of control samples in the form of control chart. A number of quality control charts have been suggested but the most commonly used are those known as Shewhart charts, which visually indicate the scatter of the individual analytical results of control samples about the designated mean value.
Narsito
Upper action line Upper warning line
Designated mean value
Lower warning line Lower action line
Fig 1 A Typical Shewhart Control Chart
Figure 2. A Youden Two Sample Plot
Fig 2 A Youden Two Sample Plot
b. Cusum Control Chart. A different control chart known as cusum chart, utilizes all of the previous sample mean rather than just the last one or two as a Shewhart does. The term “Cusum” is an abbreviation for the “cumulative sum”, i.e. the sum of the deviations of the sample means from the target value, carried forward cumulatively.
Obviously, when the chemical analysis is under control, positive and negative deviations are equally likely, so the cusum should oscillate about zero. One of the advantage of the cusum chart is that it clearly indicates at what point the chemical analysis went out of control. In order to test
whether a trend in a cusum chart does indicate that the mean sample obtained in the chemical analysis has change and can not be accounted for simply by random variation, a “V-mask” made from clear plastic sheet can be used.
3. Two Sample Youden Chart
The wide scatter of analytical results obtained in different laboratories during collaborative trials might in principle be explained by the random errors of the chemical analysis, and/or by the presence of different systematic errors in different laboratories involved. In practice, the evidence is
μo + 3σ/√n μo + 2σ/√n
μ
oμo - 2σ/√n
μo - 3σ/√n
Narsito
overwhelming that the variations are caused by systematic errors. This result is best demonstrated by the use of a two-sample (X-Y) chart, devised by W. J. Youden.
The principle involved is that each participating laboratory should be sent “two similar samples” (X and Y), and be asked to perform one determination on each sample. The analytical results are then plotted on an X-Y chart as shown in figure 2, where each point representing a pair of results from a single laboratory. After the mean value for the two sample, XO and YO, are
calculated; vertical and horizontal lines are drawn through the point (XO,YO), thereby dividing the
chart into four quadrants. It is apparent that in the hypothetical absence of random errors all the points would lie on a 45° diagonal of the X-Y chart.
Since random errors are equally likely, in every quadrant formed by subdividing the field around the mean of the points in the representation space. Therefore, the probability density function would consist of concentric circles with the mean as center. If the points are normally distributed, the (X,Y) points would have probability density function in the form of
If the results from different laboratories vary entirely because of random errors, the X and Y determinations in each case may give results which are both too high, both too low, X too high Y too low, or X too low Y too high, which would be equally likely; giving equal number of points in the four quadrants of the X-Y chart.
If, however, systematic errors are the main cause of the variation, one would expect that a laboratory obtaining a high value for X would also tend to obtain a high value for Y. This would lead to a predominance of points in the top right and lower left quadrants of the X-Y chart; and this is indeed the result obtained virtually all collaborative trials.
In practice, since random errors are always present to some extent, the points fall within an ellipse, which has the 45° diagonal of the chart as its major axis. The length of the perpendicular from an individual point to the diagonal gives a measure of the random error, and the perpendicular intersects the diagonal at a point at a distance from central point (XO,YO) which is related to the
systematic error of the laboratory. It is evident that this two sample approach (which is in fact a graphical representation of an analysis of variance) to collaborative trials was found to be efficient and can give much useful information.
Quality Assessment
As well as implementing internal quality control programs, laboratories undertaking similar chemical analysis may cooperate in a group of program. In such cooperative program, each laboratory analyzes the same control samples and the analytical results obtained are then compared within the group.
This type of quality assessment is usually a retrospective process enabling overall quality to be maintained or improved. The group schemes do not necessarily demand that the control samples are of known concentration; because even using unknown samples, comparisons of single or replicate analysis and of mean values and standard deviations for the group can be made.
Although quality control programs only address one aspect of process of the analytical work in analytical laboratory, they can constitute part of a framework within which the overall performance of the institution can be monitored and controlled. This set of procedures is refereed to as good laboratory practice (GLP) and may be required for accreditation of a laboratory by an external-regulating agency.
Good laboratory practice involves all aspects of the organization, which are involved in generating an analytical result, from the senior management staff to the bench workers; with the essential features summarized as follows :
(1) All laboratory staff must be adequately trained with designated responsibilities and appropriate qualifications;
(2) All equipment must be of an adequate standard and full records of all maintenance and faults must be kept at least for ten years;
(3) All analytical methods and procedures must be standardized, fully documented, and appropriate for the chemical analysis. Standard Operating Procedure (SOP), the full details for every analytical method, must be available. The SOP should contain such details as specimen handling, precise analytical procedures, quality control measures, and specified equipment to be used; and
(4) After the chemical analysis has been completed, all the details of the analytical method, equipment, SOP, and the raw results must be kept at least for ten years.
SOME REMARKS ON COLLABORATIVE TRIALS
Narsito
method when it is performed in a number of different laboratories. The results might be used : (1) to decide whether the method is suitable for general use, and perhaps (2) to identify those participating laboratories which might be entrusted with important analytical works, e.g. with public health or other statutory implications. It is apparently easy to set up such collaborative trial.
A single “referee” laboratory (usually a government or other official laboratory) should send one or more samples to a number of participating laboratories, along with detailed instructions on the analytical methods to be used. The participating laboratories will analyze the sample(s) according to the instructions, and return their analytical results to the referee center, where they will be evaluated by standard statistical methods. In practice, many important (sometimes-crucial) decisions have to be made before such collaborative trial is undertaken, i.e. :
1. Special attentions have to be given to ruggedness of the analytical methods used. Several individual steps and the use of a number of reagents are usually involved in any chemical analysis; and many experimental factors, such as temperature, solvent composition, pH, humidity, reagent purity and concentration, will affect the analytical results. It is essential that such experimental factors are identified and studied before an actual collaborative trial is done. In some cases, an analytical method is found to be very sensitive to small changes in one factor that is in practice so difficult to control. The use of this type of analytical method in collaborative trials should be avoided. If this type of analytical method has to be involved in the trial, the participating laboratories should be warned for the factors to be most carefully controlled. 2. The number of laboratories involved in the
collaborative trial has to be established before the actual trial begins. The number of participating laboratories should not be too small; otherwise the results will have little general application. In practice, many collaborative trials are satisfactorily conducted with 10-20 participating laboratories. It is not advisable to involve only top class qualified laboratory in such trial. A deliberately ranges of laboratories varying in quality from excellent to weak should be (randomly) selected.
3. Since systematic differences between laboratories will cause most of the variation of the results, it is clearly better to send a few samples to numerous laboratories than to send many samples to a few laboratories. Involving a large number of laboratories, however, will
make the collaborative trial become costly and time consuming.
4. The preparation, packaging, and dispatch of the samples are another important element of collaborative trial. It is normal to have a reservoir of sample, and divide it up between the participating laboratories. Some of the sample should retained by the referee to permit any additional necessary experiments. In a case that the sample is not naturally homogeneous, the sampling problems may arise.
CONCLUSIONS
1. Concerning quality control in chemical analysis, analytical chemists should ask themselves to the following three basic questions : (a) What is the quality of analytical results we produced?; (b) Do we provide the right answers to the question of their customers?; and (c) Do our customer comprehend, trust, and use our analytical data? 2. In analytical chemistry, quality can be
associated with “accuracy” and/or “reproducibility”. Chemical analysis always related to an object being analyzed, having a purpose : to control, to describe, or to monitor the object.
3. In order to produce good analytical data, an analytical laboratory should implement an internal quality control program. In some cases, collaborative programs between laboratories undertaking similar range of chemical analysis in a group quality program was found to effective in maintaining or improving the analytical data. 4. In the preparation of collaborative trial, many
factors important and crucial decisions have to be considered carefully, especially : the ruggedness of the analytical methods used, sample packaging and delivery, the number as well as the quality of participating laboratories involved.
REFERENCES
1. Caulcutt, R. and R. Boddy, 1983, Statistics for
Analytical Chemist, Chapman and Hall, London
2. Holme, D.J. and H. Peck, 1993, Analytical
Biochemistry, 2nd Edition, Longman Scientific
and Technical, New York.
3. Kateman, G. and L. Buydens, 1993, Chemical Analysis, A Series of Monograph on Analytical
Chemistry and Its Applications : Quality Control
in Analytical Chemistry, 2nd Edition, John Wiley
& Sons, Inc, New York
4. Miller, J.C. and J.N. Miller, 1988, Statistics for
Analytical Chemistry, 2nd Edition, John Wiley &