The Impact of New Information Regime on Dual and Non Dual Listed Companies in the Jakarta
and Surabaya Stock Exchanges
by using Variance Ratio Test
aNelmidab
Abstract
This paper employs the Variance Ratio Test to examine the random walk of the weak-form efficient market hypothesis (EMH). The existence of weak-form efficiency on the dual and non dual listed companies on the Jakarta and Surabaya Stock Exchange for the period before and after regulation changes (from 1991 to 1995 and from 1996 to 2004) using daily, weekly and monthly closing prices.
This study provides evidence on the impact of new information regime on the Jakarta stock exchanges by using the weak-form efficiency test. This study uses data from the returns series of the selected dual and non dual listed companies before regulation changes from 1991 to 1995 and after regulation changes from 1996 to 2004.
The findings indicate that in general the null hypothesis of Random walk and insignificant at the 5% level on the dual and non dual listed companies before and after regulation changes. The results suggest that it is difficult to reject the random walk hypotheses for most of the return series. This result confirms that the market is weak-form efficient, except for daily and weekly returns before regulation changes and for daily return after regulation changes. The results also implied that the new information regime have impacted on the Jakarta and Surabaya stock exchange by making it becoming more efficient.
Keywords: Weak-form EMH, the Jakarta Stock Exchanges, the Surabaya stock exchange, the Variance Ratio Test and Information regime.
JEL: Classification c: G10, G14, and G18.
1. Introduction
Before on 1st December 2007 Indonesia have two stock markets; there are the Jakarta Stock Exchange and the Surabaya Stock exchange. A lot of companies listed on both the Jakarta Stock exchange and the Surabaya Stock exchanges (dual listed companies) and several of companies listed on the Jakarta Stock Exchange only (non dual listed companies). There is enough evidence concerning the validity of the weak-form efficient market hypothesis (EMH) with respect to stock markets. The weak-form of the EMH postulates that successive one-period stock returns are the random walk. This paper attempts to investigate the impact of new information regime on the dual listed and non dual listed companies in the Jakarta Stock Exchange and the Surabaya Stock Exchange by using the weak-form efficiency test.
This paper used the variance Ratio Test. This rest of the paper is organized as follows. Section 2 overviews the efficiency evidence on the Indonesia market while section 3 describes the data collection procedure and methodology. Section 4 discusses the findings and section 5 concludes the paper.
2. Review of Literature
aThe Impact of New Information Regime on Dual and Non Dual Listed Companies in the Jakarta and Surabaya Stock Exchanges by using Variance Ratio Test presented in Weekend Seminar University Bung Hatta Seminar on May 03, 2008.
b
Relatively few evidences were available evaluating the efficiency of the Jakarta Stock Exchange, Suad (1987) and Rusity (1990) found that the market is fairly efficienct in the weak sense. However, Suad (1990), Balsius (1993) and Agus (1995) found that the suuffient conditions for weak form of efficincy were not satisfied.
Further, Suad (1990) also investigates the semi strong form efficiency using earning, additional issue, and new issues announcements. The general findings indicate that the market is not efficient in semi-strong form. Further studies by Rusiti (1990), Muhammad (1993), Agus (1995), Mutamimah (1995), Untung, and Sidharta (1998) substantiated the findings of Fuad (1990). Endang (2000) found that the share price response to bond announcements procedure an average excess return significantly different from zero while Eka (2000) found that the average abnormal return is significantly positive at pre-announcement date of merger and acquisitions.
In summary all evidence leads to the conclusion that the Indonesian stock market is generally inefficient.
3. Methodology and Data
The data collected from the Jakarta Stock Exchange (JSX) and the Surabaya Stock Exchange (SSX). This study employed the Variance Ratio Test and tested the random walk hypothesis is proposed by Lo and MacKinlay (1988).
3.1 The Data set
All data originate from the Jakarta Stock Exchange (JSX) and the Surabaya Stock Exchange (SSX); the data sets used in this paper consistent daily, weekly, and monthly closing prices of dual and non dual listed companies before regulation changes from 1991 to 1995 and after regulation changes from 1996 to 2044. The closing prices of selected company’s stocks traded anytime during August 1991 to December 2004. Which were extracted from the computer service and JSX daily Dairy and financial information are obtained from the Companies’ Annual Reports and the Stock market Directory on the JSX and the SSX. The information were cross - checked against in the companies prospectuses filed with the Jakarta Stock Exchange. Data are divided into four they are; (a) the dual listed before regulation changes from 1991 to 1995, (b) the dual listed companies after regulation changes from 1996 to 2004, (c) the non dual listed companies before regulation changes from 1991 to 1995 and (c) the dual listed companies after regulation changes from 1996 to 2004. At the outset, the sample size consists of all quoted companies listed. The shares are continuously listed on the JSX and SSX during the sample period. Companies are selected by based on the following criteria; (1) companies must have 70% of traded prices record at the time, (2) companies are Indonesian domiciled, (3) annual reports are publicly available, (4) the companies have been listed for 5 years, (5) desisted, suspended and recently listed companies are excluded. For this study the number of samples based on criteria for dual and non dual listed are listed 25 companies.
3.2. Methodology 3.2.1 Test of Stationary
Any time series data can be thought of as being generated by either a stochastic or random process. A stochastic process is said to be stationary if its mean and variance are constant over time. However, according to Engle and Granger (1987), most of financial market time series are non-stationary in nature. The regression of these financial series may give spurious results with very high R2although there is no meaningful relationship between the two. The unit root test examines whether each financial series is stationary or non-stationary. The existence of unit root in a series indicates that the series is non-stationary. A time series is integrated, denoted I(d), if the series can achieve stationary results only after differencingdtime. Engle and Granger (1987) noted that anI(0)series is thus, by definition, stationary; anI(1)series contain unit root and is non-stationary.
(i) Unit roots Analysis
t
The first model is the random walk with zero drift, while the second model incorporates a non-zero drift. The last model includes a time trend factor. This study will base the analysis on the model that describes the dual, non dual listing, and LQ45 stock prices series best. A test of significance would use the Dickey- Fuller critical value to evaluate whether the price changes as rates of return fluctuate randomly around the value of one.
3.2.2 The Variance Ratio Test
The variance ratio test is a neat, natural, and simple way to test weak form of market efficiency. The variance ratio test is a parametric test to determine difference between the current stock prices and yesterday share price. Variance ratio test is proposed by Lo and MacKinlay (1988). It is based on the fact that variance of random walk increments should be a linear function of time. Variance ratio test has been used in the predictability of stock market returns in developed markets (Lo and MacKinlay, 1988).
In emerging markets, Claessens et al. (1995) and Urrutia (1995) used single variance ratio technique. It is one of the statistical tools, which have been found to have an important flaw by Chow and Denning (1993), Eckbo and Liu, (1993).
In testing the market efficiency, the main tool of analyses is the Lo and MacKinlay (1988) heteroscedasticity consistent variance ratio, which is the test of the weak form of random walk hypothesis. An estimated variance ratio less than one implies negative serial correlation, while a variance ratio greater than one implies positive serial correlation. This is also employing other related statistics: the asymptotic normal Z test statistics (assuming homoscedasticity) and heteroscedasticity. Consistent Z test statistic follows Lo and MacKinlay (1988) and Camphell et al., (1997).
To calculate variance ratios, consider that the random walk null hypothesis suggests that variance is linear in the sampling interval used. Hence, to calculate variance
2of a series of returns sampled every t periods, the null hypothesis suggests that sampling every (q x t) periods will lead to a variance ofqx
2. Therefore, under the null:
The random walk hypothesis requires that VR = 1, can be tested asymptotically using normal distribution. By refining to allow for overlapping observations (to make sample size sufficiently large for largeq) and to correct for bias in variance estimators, Lo and MacKinlay (1988) developed variance test ratio test statistics for null hypothesis. The alternative hypothesis in their test is any deviation from a random walk that causes the variance ratio to deviate from this.
The technique used to estimate variance ratios here follows Chambell, Lo and Mackinlay (1997). Calculate the estimates of unbiased singles period
ˆ
12 andqperiod
ˆ
q2variances using:Then let the variance ratio be
under the assumption of homoscedasticity of returns, test statistic standard normal, Z (q) that:
)
Expanding equation (4.11), can show that
)
where
(k) is the term kth term in the autocorrelation function for return series. Equation (4.14) holds asymptotically for estimates of
(k).Therefore, the variance ratio can be written in terms of the autocorrelation function (ACF) for the return - it is simply a weighted sum of components of the ACF. If let
k be the asymptoticvariance of the estimate of
(k), and
ˆ
e(
q
)
be asymptotic variance ofV
R
(
q
)
, then use equation (5) to determineStatistic test under heteroscedasticity-connsistent estimator is
)
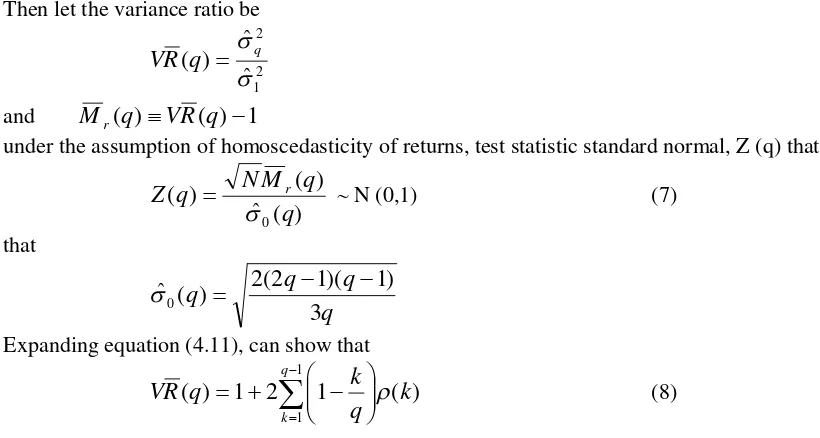
Table 1 (Panel A) present the descriptive statistics for dual listed companies before regulation changes. The dual listed companies which have mean values ranging from (0.25) % to 0% per share for daily, from (1.18) % to 0.01% per share for weekly, and from (5.13) % to 0.09% per share for monthly. The standard deviations range from 0.0270 to 0.0762 for daily, from 0.0626 to 0.1670 for weekly and from 0.1198 to 0.3582 for monthly returns.
Table 1 (Panel C) presents the mean of non dual listed individual before regulation changes which range from (0.35) % to 0 % per share for daily, from (1.66) % to 0.15% -per share for weekly, and from (7.28) % to 0.12% per share for monthly. The standard deviations range from 0.0199 to 0.0986 for daily, 0.0481 to 0.2150 for weekly, and from 0.1053 to 0.4492 for monthly.
Finally, Panel D of Table 1 shows the mean of non dual listed individual after regulation changes which range from (0.13) % to 0.09% per share for daily, from (0.61) % to 0.41% -per share for weekly, and from (2.89) % to 1.77% per share for monthly. The standard deviations range from 0.0141 to 0.0838 for daily, 0.0318 to 0.1681 for weekly, and from 0.0708 to 0.3701 for monthly.
Table 1: The Results of Descriptive Statistics
Panel A: the Dual Listings Companies before Regulation Changes
Daily Weekly Monthly
Mean -0.0025 to 0 -0.0118 to 0.0001 -0.0513 to 0.0006
Median 0 0 -0.03661 to 0.0209
Maximum 0.1671 to 1.2528 0.2022 to 0.9904 0.2196 to 0.9904
Minimum -1.3863 to -0.3483 -1.3863 to -0.2336 -1.3863 to -0.3392
Std. Dev. 0.0270 to 0.0762 0.0626 to 0.1670 0.1198 to 0.3582
Panel B: the Dual Listings Companies after Regulation Changes
Mean -0.0015 to 0.0003 -0.0070 to 0.0015 -0.0306 to 0.0064
Median 0 0 -0.0247 to 0
Maximum 0.2151 to 2.9957 0.3327 to 2.8622 0.4212 to 2.8258
Minimum -1.6301 to -0.2412 -1.7284 to -0.3857 -1.9694 to -0.4855
Std. Dev. 0.0384 to 0.0979 0.0792 to 0.1896 0.1632 to 0.3573
Panel C: the Non Dual Listings Companies before Regulation Changes
Mean -0.0035 to 0 -0.0166 to 0.0015 -0.0728 to0.0012
Median 0 0 -0.0279 to 0
Maximum 0 to 1.6094 0 to 1.6094 0 to 1.6094
Minimum -1.8192 to -0.2549 -1.8192 to -0.3155 -1.8192 to -0.3151
Std. Dev. 0.0199 to 0.0986 0.0481 to 0.2150 0.1053 to 0.4492
Panel D: the Non Dual Listings Companies after Regulation Changes
Mean -0.0013 to 0.0009 -0.0061 to 0.0041 -0.0289 to 0.0177
Median 0 0 -0.0247 to 0
Maximum 0.2364 to 1.8326 0.2513 to 2.0369 0.3054 to 2.0949
Minimum -2.4365 to -0.3015 -2.4617 to -0.2007 -2.4849 to -0.2877
Std. Dev. 0.0141 to0.0838 0.0318 to 0.1681 0.0708 to 0.3701
It implies that monthly return is much higher the weekly and daily return, however risk of monthly return also much higher that daily and weekly consistent with higher risk and higher return concept.
4.2. The results of the Unit Root Test
Stationary test is one of the important prerequisites for evaluating time series data. In this study, the Augmented Dickey Fuller (ADF) and Philip-Peron (PP) tests are employed. Table 2 (Panel A, B, C, D and E) presents the results which indicate that, the null hypothesis of unit root theory can be rejected for the Composite Index and individual companies before and after regulation changes.
Table 2: The Results of Unit Root Test
Panel A: the Dual Listings Companies before Regulation Changes
ADF Test P P Test
First Difference First Difference
t-Statistic Adj. t-Stat
Daily -40.3327 to -10.8283 *** -42.2596 to -29.6462 ***
Weekly -18.6024 to -5.2396 *** -20.4270 to -12.3282 ***
Monthly -9.2691 to -3.6574 *** -10.7477 to -5.2984 ***
Panel B: the Dual Listings Companies after Regulation Changes
t-Statistic Adj. t-Stat
Daily -60.7486 to -29.8746*** -61.0292 to -45.5690***
Weekly -25.5835 to -11.4480*** -25.2437 to -19.2903 ***
Monthly -11.8844 to -7.9273*** -31.7881 to -7.8844***
Panel C: the Non Dual Listings Companies before Regulation Changes
t-Statistic Adj. t-Stat
Daily -40.7259 to -19.7006 *** -40.7757 to -29.4082***
Weekly -17.8728 to -8.9350*** -25.6747 to -13.0163***
Monthly -9.6540 to -4.3295*** -10.6853 to -3.9995***
Panel D: the Non Dual Listings Companies after Regulation Changes
t-Statistic Adj. t-Stat
Daily -55.0659 to -38.3586 *** -55.2959 to -42.7570***
Weekly -24.5264 to -12.8603*** -24.3288 to -19.4340***
Monthly -14.5155 to -7.6777*** -14.5147 to -7.7981***
Thet-statistics based on Augmented Dickey-Fuller (ADF) and Philips-Peron (PP) regression with allowance for level and intercept respectively. *** implies the significance at 1%
4.3 The Weak Form Efficiency Test Results using The Variance Ratio Test
The variance ratio test results are divided into two sections; the first section examines the weak-form efficient on dual listed companies before and after regulation changes. The second section evaluates the weak-form efficient on non dual listed companies before and after regulation changes for all series respectively.
4.3.1 The Variance Ratio Test Results
The results relating to the variance ratio test on dual and non dual listed companies before and after regulation under the assumption of both homoscedasticity and heteroscedasticity.
(i) The Results on Dual Listed Companies before and after Regulation Changes
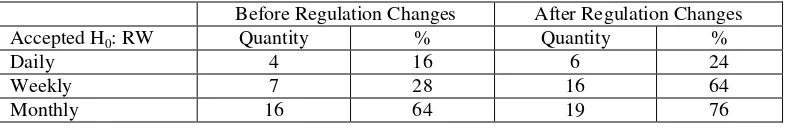
Table 3 shows the number of dual listed companies before and after regulation changes do not reject the null hypothesis VR (q) close to one (unity) and results insignificant at the 5% level. From the list of dual listed companies before regulation changes 4 companies (16%) are in the daily returns, 7 companies (28%) are in the weekly returns and 16 companies (64%) are in the monthly returns respectively. Then, from the list of dual listed companies after regulation changes 6 companies (24%) are in the daily returns, 16 companies (64%) are in the weekly returns and 19 companies (76%) are in the monthly returns respectively. Thus, under the assumption of both homoscedasticity and heteroscedasticity the results indicate that can be described as the random walk hypothesis. Therefore, the market is weak-form efficient on the dual listed companies before and after regulation for all the series, except for daily and weekly returns on dual listed companies before regulation changes and for daily returns after regulation changes. This result implies that the Jakarta stock exchange is weak-form efficient on dual listed companies before regulation changes for monthly returns. However, Jakarta stock exchange is marginally weak-form after regulation changes for weekly and monthly returns.
Before Regulation Changes After Regulation Changes
Accepted H0: RW Quantity % Quantity %
Daily 4 16 6 24
Weekly 7 28 16 64
Monthly 16 64 19 76
(ii) The Results on Non Dual Listed Companies before and after Regulation Changes
Table 4: A number of Companies which are accepted the Null Hypothesis using Variance Ratio Test on Non Dual Listed Companies N= 25
Before Regulation Changes After Regulation Changes
Accepted H0: RW Quantity % Quantity %
Daily 4 16 5 20
Weekly 7 28 15 60
Monthly 15 60 18 72
Table 4 presents the number of non dual companies before and after regulation changes that accepted the null hypothesisVR(q) close to one (unity) and results are insignificant at the 5% level. From the list of non dual listed companies before regulation changes 4 companies (16%) are in the daily returns, 7 companies (28%) are in the weekly returns and 15 companies (60%) are in the monthly returns respectively. From the list of non dual listed companies after regulation changes 5 companies (20%) are in the daily returns, 15 companies (60%) are in the weekly returns and 18 companies (72%) are in the monthly returns.
These results under the assumption of both homoscedasticity and heteroscedasticity indicate that can follow the random walk hypothesis. Therefore, the market is weak form efficient on non dual listed companies before and after regulation for all the series, except for daily and weekly returns before regulation changes and for daily returns after regulation changes. This concludes that the Jakarta stock exchange is weak-form efficient on non dual listed companies before regulation changes for monthly returns. However, Jakarta stock exchange is also marginally weak-form after regulation changes for weekly and monthly returns.
5. Conclusions
This section presents the conclusions and implications of the study. The main objective of this study it’s to investigate the behaviour of stock prices in the Jakarta and Surabaya stock exchange before and after the imposition new regulation. These issues are analysed from the respective of weak-form efficiency. This study covers four years period from 1991 to 1995 for dual and non dual listed companies before regulation changes and nine years period from 1996 to 2004 for dual and non dual listed companies after regulation changes for all returns series.
This paper employed the variance ratio test to test the weak-from efficient stock market for daily, weekly and monthly closing stock prices.
The findings on the weak-form efficiency suggest that the variance ratio test on the dual and non dual listed companies before regulation changes from 1991 to 1995 rejected the random walk hypothesis for all of the returns series, except for monthly returns and the market shows weak-from efficiency for monthly returns. However, the results of the variance ratio test on dual and non dual listed companies after regulation changes from1996 to 2004 do not reject for all the returns series, except for daily returns and the market shows weak-form efficiency for weekly and monthly returns.
components and exhibit a non-linear long-term dependence, which however does not diminish the theoretical significance and predictive ability of random walk hypothesis.
Based on an above of the conclusions for this study is that the Indonesian stock market has the following characteristics:
(a) Weak-form efficiency on dual and non dual listed companies before regulation changes (from1991 to 1996) monthly returns.
(b) Weak-form efficiency on dual and non dual listed companies after regulation changes (from1996 to 2004) for weekly and monthly returns.
The findings of the study have a number of implications. For, the researchers, the study has shown that over an extended and comprehensive period, in general, the behaviour of the Indonesian stock market as a developing security market reflects the general behaviour of the developed securities markets using all return series. Given the serious thinness of trading in the market, the market inefficiencies do exist at the margin and probably is exploitable. This is not inconsistent with studies on market efficiency.
More the deregulation and more disclosures might make the market prices reflect real asset of companies listed on the Indonesian stock market. For the researcher, this study can be extended over a longer period and the coverage made more comprehensive. In general, the average behaviour of the Indonesian stock market as a developing stock market reflects in some respect the general behaviour of developed stock markets used in our analysis. Further research in the future should extend the research period to cover longer research periods.
References
Agus, Harjito. (1995). Pengujian efisiensi pasar modal periode 1992-199. Unpublished master’s thesis, UGM, Yogyakarta.
Annuar, M. N. (1991). The efficient market hypothesis and thinly traded Kuala Lumpur Stock Exchange, Tests with Appropriate refinements, Unpublished PhD Thesis, University Pertanian Malaysia, Serdang, Malaysia.
Annuar, M. N., Arief, M. & Shamsher M. (1994). Is Kuala Lumpur’s Emerging Share Market Efiicient?. Journal of International Financial Markets, Instituition and Money, 4(1), 89-100.
Balsius, M. (1993).Analisis efisiensi pasar modal Indonesia sebelum dan sesudah swastanisasi. Unpublished Master Thesis, UGM, Yogyakarta, Indonesia.
Brock, W., Dechert, W., & Scheinkman, J. (1987). A test for independence based on the correlation dimension, mimeo. Social Sciences Research Unit, University of Wisconsin.Validity of the Random Walk Hypothesis1085.
Darrat, A. F., & Maosen, Z. (1997). On testing the random –walk hypothesis: A model-comparison approach.
http://www.ssrn.com. Accessed on 18thMarch 2003.
Dickey, D. A. (1976).Estimation and hypothesis testing in nonstationary time series, PhD Thesis, Iowa State University.
Endang, S. (2000).Analisis reaksi harga saham terhadap pengumuman obligasi di Bursa Efek Jakarta.Unpublished master’s thesis, Universitas Gajah Mada Yogyakarta, Indonesia.
Fama, E. F. (1965). The behavior of stock prices.Journal of Business, 38, 34-105.
Fama, E. F. (1970). Efficient capital markets: A review of theory and empirical work.the Journal of Finance, 25(2): 383-417.
Fama, E. F. (1991). Efficient capital markets II.Journal of Finance, 46, 1575-1617.
Hanafi, M. & Suad, H. (1991). Perilaku harga saham di pasar perdana: Pengamatan di Bursa Efek Jakarta selama tahun 1990. Management dan Usahawan Magazine, November, 12-13.
Laurence, M. M. (1986). Weak-form efficiency in the Kuala Lumpur and Singapore stock markets.Journal of Banking and Finance, 10, 431-445.
Lo, A. W., & Mackinlay, A.C. (1988). Stock market prices do not follow random walks. Evidence from a simple specification test.Review of Financial Studies, 1, 41-66.
Mobarek, A., & Keasey, K. (2000). Weak-form market efficiency of a merging market: Evidence from Dhaka stock market of Bangladesh.http:// www.Google.com.
Mutamimah, (1998).Pengujian efisiensi pasar modal Indonesia.Unpublished master’s thesis, UGM, Yogyakarta, Indonesia.
Nelmida, Annuar Md Nassir and Taufiq Hassan (2009). The impact of new information regime on the efficiency of the Indonesian stock market,International Research Journal of Finance and Economics33.
Nelmida, Annuar Md. Nassir and Taufiq Hassan. (2008) The Impact of New Information Regime on Pricing Efficiency of Dual and Non Dual Listed Companies on the Jakarta and Surabaya Stock Exchanges, European Journal of Social
Sciences Volume 6 Number 2page 153-161.
Phillips, P. C. B., & Perron, P. (1988). Testing for unit root in time series regressions,Biometria, 75, 335-346.
Rusiti (1990).Analisis perilaku harga saham pasar modal Indonesia, periode 1986-1989 dengan pendekatan hipotesis pasar modal efficien, unpublished master’s thesis, UGM, Yogyakarta, Indonesia.
Suad, H. (1987).The Indonesian stock market efficiency: A case of thin market. Unpublished master’s thesis, Department of Accounting and Finance, University of Birmingham, England.