60
THE INFLUENCE OF SUPPLIER TRUST AND SUPPLIER
COMMITMENT TO SUPPLIER PERFORMANCE THROUGH
INFORMATION SHARING AND COLLABORATION
Warniancy Ariesty
Faculty of Management and Business, Ciputra University UC Town, Citra Land Surabaya 60219, Indonesia
E-mail: [email protected]
Abstract
This research will discuss obstacles in producing the optimal number of nickel, this is related to the performance of the supplier. The object of this research is PT. Vale Indonesia Tbk. supplier companies incorporated the law of PT and CV, as well as the minimum of two years has become an active supplier. The purpose of this research is to test and analyze all variables that affect the supplier performance, such as supplier trust, supplier commitment, information sharing and collaboration. The research method used is SEM (Structural Equation Modeling) based on GeSCA (General Structured Component Analysis). The result from the research obtained that supplier commitment variable affect supplier performance through information sharing and collaboration, while the variable of supplier trust has no effect to measure supplier performance.
Keywords: Supplier performance; supplier trust; supplier commitment; sharing information; collaboration.
Introduction
Along with the economic growth that is also supported by the progress of technology and the growing needs of the people around the world toward commodities which containing minerals element such as nickel, make the mining industry flourished. One of the mining industry in Indonesia that produce and process the largest nickel in the world is located in Sorowako on the island of Sulawesi is PT. Vale Indonesia Tbk. The nickel market is the essence of the business prospects of PT. Vale Indonesia Tbk.
In the production of nickel, companies have a problem to determine the optimal amount of nickel production. Problems that arose related to the issues of operation, start from the availability of resources owned, such as raw materials, machinery and other equipment that supports the process of nickel pro-duction, the impact of the problem can cause delays in shipping products to customers. Delays and mis-take in supplying materials from the supplier such as engine and other equipment that support the pro-duction activities related to supply chain management.
Supply chain management is a system whereby the chains process should not be disconnected or barriers, if it happens it will be damaging to the system. Delays in the procurement process will lead to the halt of a production process when the pro-duction process is stopped it will be incurred los-ses to related companies. In a matter of fact, often faulty materials are delivery by the supplier does not
accordance with the company requested, this caused by suppliers of PT. Vale Indonesia Tbk performs an error when collecting data. It does not only have an impact on the quantity but also on the quality of the commodity requested. Others than that this pheno-menon occurs also due to the existence of customer request which is higher compared with the amount of production that is produced and as of the resulting demand could not be fulfilled perfectly.
Each of the companies will be working to its fullest to improve productivity so as to keep it running effectively and efficiently, to meet these required the presence of management both internally and exter-nally. As mentioned by Pujawan and Mahendrawati (2010), the importance of the role of all parties ranging from the supplier, manufacturer, distributor, retailer and customer in creating a new product that is supply chain management. Verdiar and Siagian (2014) also explained that relationship between supplier and the company itself should be well managed. The Supplier also responsible for main-taining a good and long-term relationship with the company.
supporting the company operations. In terms of building a good relationship between the company and the supplier, it requires a special management which is called supplier relationship management.
Supplier relationship management (SRM) is a systematic approach to developing and managing partnerships. PT. Vale Indonesia Tbk has established a partnership with suppliers in order to support and ensure the sustainability of production in the com-pany. The Interaction between Supplier Trust, Sup-plier Commitment, Information Sharing and Colla-boration are part of the factors which will affect the performance of supply chain management in the com-pany and give effect to the supplier performance.
According to Heizer and Render (2010), trust is an essential part of the supply chain that effective and efficient. A relationship built on mutual trust will be successful, without trust, the relationship will not survive in the long term. According to Cambra and Polo (2011), a long-term relationship, requires a commitment from each of the parties involved. The commitment expressed confidence in its partner will act with integrity and can only be built with actions, not just promises.
Information sharing refers to the extent of the information to be communicated to the company’s business partners (Monczka, Petersen, Handfield, & Ragatz, 2008). This is supported by the statement from Miguel and Brito (2011) explain that infor-mation sharing is a flow of communication that takes place continuously between partners, both formal and informal, and also contributed to series of planning and better monitoring.
Collaboration is a partnership between two or more organization that aim to achieve maximum results, which will not be achieved if it was done by the organization itself. Supply chain Collaboration is needed to that companies is able to integrate infor-mation from a variety of supply chain partners (Daugherty, Richey, Genchev, & Chen, 2005). This statement is supported by research which conducted by Vereecke and Muylle (2006), where the high level of collaboration between suppliers and companies, will lead to improved overall performance.
Referring to this, the company needs to make improvements in planning more structured in order to fulfill the market demand optimally. Planning in this research is a plan that can provide optimum decisions based on the resources owned by the company in order to meet the demands for products produced by building and maintaining good relationships with suppliers of the company.
Based on these problems and the formulation of the problem in this research are: Is Supplier Trust has an influence on the Collaboration? Is the Supplier Trust has an influence on the Information Sharing? Is the Supplier Commitment has an influence on the Collaboration? Is the Supplier Commitment has an influence on the information sharing? Is the Informa-tion Sharing has an influence on the CollaboraInforma-tion? Is the Information Sharing has an influence on the Supplier Performance? Is the Collaboration has an influence on the Supplier Performance?
The purpose of this research was to examine and analyze the effects of Supplier Trust towards Colla-boration, Supplier Trust towards information sharing, Supplier Commitment towards Collaboration, Sup-plier Commitment towards Information Sharing, Information Sharing towards Collaboration, Informa-tion Sharing towards Supplier Performance, and Collaboration towards Supplier Performance.
Supplier Trust
According to Heizer and Render (2010), trust is an essential part of the supply chain that effective and efficient. It is supported by the statements expressed by Chen, Yen, Rajkumar, and Tomochko (2011) that trust allows the supply chain team members to rely on each other. Relationships which built based on mutual trust are mostly to bring success. Trust is an important aspect in the sustainability of a relationship.
Mugarura (2010) show that trust provides reaso-nable assurance that the objectives and the desired results will be achieved and it will lead to a greater tendency to work together. Tsai (2006) showed that trust which developed through effective communica-tion will create a resource with an excellence compe-titive.
Supplier Trust is a form of mutual trust in terms of doing well-integrated partners in the nickel’s com -pany. In this research, instruments used to measure supplier trust are trustworthy, reliable, high integrity, consistent in keeping promises and honest.
Supplier Commitment
invest the resources and short term expense for long-term success (Chen et al., 2011).
Kwon and Suh (2005) showed that every business transaction that persists between supply chain partners need the commitment between the two parties in the term to achieving the common goal of their supply chain. The Commitment that has deve-loped between the partners is a key to achieving the desired results for both companies and has a direct impact as well as positive performance (Prahinski & Benton, 2004). According to Cambra and Polo (2011), long-term relationship requires a full commit-ment from parties involved.
Supplier commitment is a willingness from both sides the company and the supplier to strive to maintain long-term relationships. In this research, instruments used to measure the supplier commitment of maintaining business relationships are faithful with a company partner, willing to invest, loyal to the company partner, adjusting the goals and objectives of the partners, also regularly discusses the problem occurred.
Information Sharing
Information sharing refers to the extent to which
the company’s business partner sharing important in-formation (Monczka, et al., 2008). Miguel and Brito (2011) explained that information sharing is the flow of continuous communication between the formal and informal partners also contributed to series of planning and better monitoring.
Information sharing is an important component of collaboration in supply chain management (Cheng & Wu, 2005). Information sharing has a key role in matching supply with demand, also to reduce the cost of excess inventory and losses (Martin & Patterson, 2006). The existence of the match between supply and demand supply chains is often caused by the uncertainty, caused by a lack of information sharing regarding forecasting (Kwon & Suh, 2005). Asym-metric information can be reduced by sharing infor-mation inventory, production and sales data, informa-tion for planning and forecasting (Patnayakuni, Rai, & Seth, 2006).
Information sharing is about the dissemination of relevant information at the right time for planning and controlling supply chain operations (Simatupang & Sridharan, 2005). Information sharing is critical to the efficiency, effectiveness and competitive advan-tage of the supply chain (Stock & Lambert, 2001).
Information sharing is an intensity and capacity of the company to interact, share information
conti-nuously between formal and informal partners to which the information relates to a business strategy that is useful for efficiency, effectiveness and compe-titive advantage of the supply chain. In this research instruments used to measure information sharing is the information give continuously, clear and accurate, such as providing information about price change, inventory, and quality of materials and shipping schedules.
Collaboration
Collaboration is defined as a long-term relation-ship in which the subject generally share information and cooperate in planning or modifying business practices in order to improve the performance toge-ther (Nyaga, Whipple, & Lynch, 2010). Collaboration is a partnership between two or more organization that aim to achieve maximum results, which will not be achieved if it was done by the organization itself. Supply chain Collaboration is necessary to be able company to integrate information from a variety of supply chain partners (Daugherty et al., 2005).
According to Daugherty, Ellinger, and Rogers (2004) the development of collaboration is possibly done through internal and external coordination, data integration and entering supply chain information into company information system and developing a long-term partnership with supply chain partners. Coordi-nation is part of collaboration, both with the
com-pany’s internal parties (between the various functions
whose handle logistics) as well as with the external parties (partners in the distribution channel and custo-mer) is necessary to equalize perception, eliminate miscommunications and misperception, also rise mutual trust (Smaros, 2007).
Min, Roath, Daugherty, and Riechy (2005) said that collaboration can positively impact on operational effectiveness and efficiency as well as profitability. Collaboration built between the company and the supplier can help the development of suppliers and provide improved on the lini suppliers who have an impact on the improvement of the performance of the company. This is supported by the research done by Vereecke & Muylle (2006), higher levels of good collaboration between the supplier and the company will lead to the improvement of the overall perfor-mance. Collaboration could lead to performance improvement through risk sharing, reducing tran-saction costs and efficiency process or improvement (Nyaga et al., 2010). Collaboration is defined as a
company’s ability to choose the proper collaboration
arise between companies and collaborate (Ralston, 2014).
Collaboration is a long term relationship in which each of the participants involved work together to create a competitive advantage that can not be achieved if done alone. Instruments used to measure collaboration in this research are long-term contract, actively participating in maintaining the quality of the production process, creating better coordination in order to avoid any misperception, flexible in respond-ing demands of material changes, settrespond-ing a simple order guideline, quantity as well as the material shipping time table.
Supplier Performance
Strategic supplier relationship in terms of goal sharing can be achieved through the commonality of objectives and implementation (Jack & Powers, 2015). The nature of the common purpose is not only related to the company strategy involved, but also based on the culture of the organization, which strategically connects organizations concern with the cultural characteristics such as a willingness to share the risks and benefits, as well as a desire to share resources (Jack & Powers, 2015).
In a strategic supplier relationship, partners of the company worked individually but toward a common goal with no interest for themselves (Jack & Powers, 2015). A well manage strategic supplier relationship is able to connect customers, manufac-turers, and suppliers, also plays an important role in long-term prosperity in the whole supply chain (Ting & Cho, 2008). In order to make supplier relationship succeed, required harmony between strategic orienta-tion and socializaorienta-tion of the supply chain partners (Baier, Hartmann, & Moser, 2008; Sandberg, 2007). This success can be measured from a variety of different dimensions, such as collaboration with busi-ness to busibusi-ness partners, the organization is able to develop economic scale, improve supplier compe-tency and improve inventory management (Williams & Tokar, 2008).
Rodriguez, Hemsworth, and Martinez-Lorente (2005) says that the supplier development practices can improve supplier performance. Direct involve-ment in the supplier activities, such as trips to the supplier plant and training or education of the supplier, all are important due to supplier performance improvements. Awards and recognition for supplier performance improvement are not possible without supplier performance evaluation continuously. Eva-luation of the performance of suppliers, sourced from a number of suppliers and supplier qualification can improve supplier performance and company
perfor-mance. Rodriguez et al. (2005) said that the evalua-tion of suppliers through field visits and the use of rewards and recognation system suppliers can improve their performance.
Supplier performance is a supplier development practices by using evaluation of supplier performance and qualification, it can improve supplier perfor-mance. In this research, the instruments used to measure supplier performance are the maximum service, fulfilled request, on schedule shipping time, improvement of material quality, able to provide guarantees and able to resolve complaints from joint companies.
Research Framework
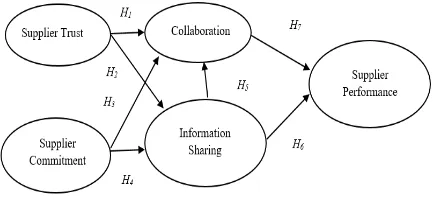
This research observed on supplier trust and supplier commitment to supplier performance through information sharing and collaboration.
Figure 1. Research framework
Based on the above research framework, the result of the existence of some relationship or influence among variables with each other, that are, H1: Supplier Trust affects the Collaboration, H2: Supplier Trust affect the Information Sharing, H3: Supplier Commitment had affected the Collaboration, H4: Supplier Commitment affect the Information Sharing, H5: Information Sharing affect the Colla-boration, H6: Information Sharing affect the Supplier Performance, and H7: Collaboration affect the Sup-plier Performance.
Research Method
The research method used is the quantitative method, the type of research used is causal research that is design to measure the cause and effect relation-ship between the independent variables (cause) against dependent variables (effect), identify and show the direction of the relationship between the variables. The population amount in this research is 164 supplier company PT. Vale Indonesia Tbk.
entity PT (Limited Company) and CV and a mini-mum of two years has become active suppliers in PT. Vale Indonesia Tbk., while unit of analysis in this research are using staff, supervisor, manager, director or company owner itself from the supplier company PT. Vale Indonesia Tbk that supply equipment that supportsthe production process PT. Vale Indonesia Tbk.
Data sampling techniques performed using judgement sampling (purposive sampling) which is included in nonprobability sampling. Nonprobability sampling is a sampling technique which does not give any equal opportunity for each element or member of a population to be selected into the sample, in this case, time become a priority concern (Sugiyono 2009, p. 120). While the judgement sampling is one of purposive sampling in addition to quota sampling, the researchers select the sample based on the assessment of some characteristics of sample members that are adapted according to the purpose of the research. The researcher used this sampling method since it has been understood that the desired information can be obtained from a specific target group. The reason is they have information required and also meet the conditions and criteria specified by the researchers (Kuncoro 2009, p.139). In this research researches
used Slovin’s formula in order to scale sample
quantity (Sarwono & Martadiredja 2008, p.142) and that are 62 supplier companies of PT. Vale Indonesia Tbk
Data measurement on the overall statement contained in the questionnaire either associated with Supplier Trust, Supplier Commitment, Information Sharing, Collaboration, and Supplier Performance which submitted to the respondent is using Likert scale, at intervals of 1 to 5 where 1 indicates the lowest value and 5 are shows the highest value.
The respondents answer data are the result of the dissemination of a questionnaire to the PT. Vale Indonesia Tbk company supplier will be processed and analyzed using SEM (Structural Equation Modeling) a data analysis method based on GeSCA (General Structured Component Analysis). GeSCA is a new SEM method which based on component, it is very important and can be used to score calculating (not scale) also can be applied to the smallest sample (Tenenhaus, 2008). GeSCA also can be used to a structural model includes the variable with reflexive and/or formative indicator (Solimun, 2015). In GeSCA analysis, the measure of fit is done on the measurement model, the structural modes as well as overall model.
Research Result and Discussion
Measures of Fit
The result obtained from analysis using GeSCA is measures of fit in the measurement model, structural model, and overall model.
Measures of Fit Measurement Model
Measure of fit in the measurement model has the objective to examine (test) whether the instrument is valid and reliable, it was evaluated by convergent validity, discriminant validity, and internal concis-tency reliability.
Convergent Validity
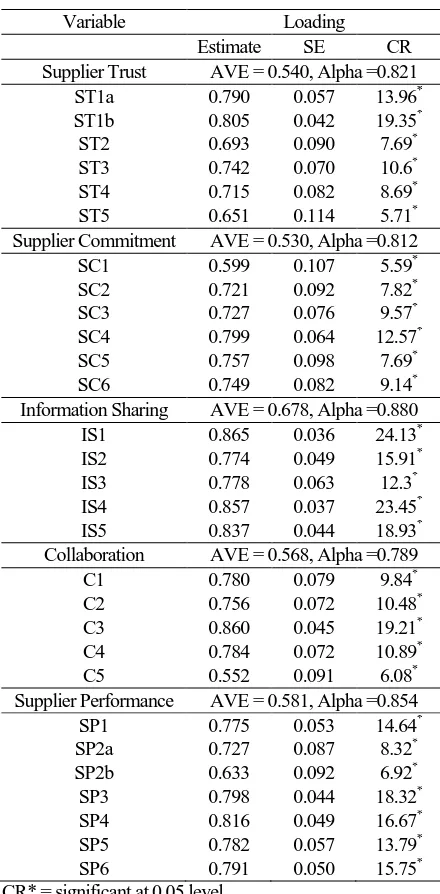
Table 1
Convergent Validity Test Result
Variable Loading
Estimate SE CR
Supplier Trust AVE = 0.540, Alpha =0.821 ST1a 0.790 0.057 13.96* ST1b 0.805 0.042 19.35* ST2 0.693 0.090 7.69* ST3 0.742 0.070 10.6* ST4 0.715 0.082 8.69* ST5 0.651 0.114 5.71* Supplier Commitment AVE = 0.530, Alpha =0.812 SC1 0.599 0.107 5.59* SC2 0.721 0.092 7.82* SC3 0.727 0.076 9.57* SC4 0.799 0.064 12.57* SC5 0.757 0.098 7.69* SC6 0.749 0.082 9.14* Information Sharing AVE = 0.678, Alpha =0.880
IS1 0.865 0.036 24.13* IS2 0.774 0.049 15.91* IS3 0.778 0.063 12.3* IS4 0.857 0.037 23.45* IS5 0.837 0.044 18.93* Collaboration AVE = 0.568, Alpha =0.789
C1 0.780 0.079 9.84* C2 0.756 0.072 10.48* C3 0.860 0.045 19.21* C4 0.784 0.072 10.89* C5 0.552 0.091 6.08* Supplier Performance AVE = 0.581, Alpha =0.854 SP1 0.775 0.053 14.64* SP2a 0.727 0.087 8.32* SP2b 0.633 0.092 6.92* SP3 0.798 0.044 18.32* SP4 0.816 0.049 16.67* SP5 0.782 0.057 13.79* SP6 0.791 0.050 15.75* CR* = significant at 0.05 level
Table 1 shows estimated figure the loading factor for a variable of supplier trust, supplier commitment, information sharing, collaboration, dan supplier performance on each indicator. The value of the actual convergent validity is 0.7, but since the criteria range between 0.5–0.6 is still allowed or considered sufficient. It can be concluded that overall five variables in the study had a good convergent validity or in other words convergent validity quali-fied due to all loading factor is above 0.5
Discriminant Validity
In this research, discriminant validity can be seen from Average Variance Extracted (AVE), which the value of AVE > 0.50 as shown in the Table 2.
Table 2
The Result of Average Variance Extracted (AVE)
Variable AVE VALUE
Supplier Trust AVE = 0.540 Supplier Commitment AVE = 0.530 Information Sharing AVE = 0.678 Collaboration AVE = 0.568 Supplier Performance AVE = 0.581 Source: Output Data GeSCA
Based on Table 2, it can be seen that the value of AVE from a variable of supplier trust, supplier commitment, information sharing, collaboration, and supplier performance is greater than 0.50, it can be concluded that all variable in this research have been meeting the requirement of a respectable discriminant validity.
Internal Consistency Reliability
Groups of indicators used to measure a variable has a respectable internal consistency reliability if it has alpha > 0.6. In this research, the result of internal consistency reliability output can be seen from the Table 3.
Table 3
The Result of Alpha Value
Variable Alpha Value
Supplier Trust Alpha = 0.821 Supplier Commitment Alpha = 0.812 Information Sharing Alpha = 0.880 Collaboration Alpha = 0.789 Supplier Performance Alpha = 0.854 Source: Output Data GeSCA
From the Table 3, it can be seen that the supplier trust variable has an alpha of 0.821, variable supplier commitment has an alpha of 0.812, variable informa-tion sharing has an alpha of 0.880, variable collabora-tion has an alpha of 0.789 and variable supplier performance has an alpha of 0,854. It can conclude that indicator group that measures all five variables in this research had a good internal consistency relia-bility internal consistency reliarelia-bility due to the result of alpha 0.6.
Measures of Fit Structural Model
Measured of fit on the structural model aims to discover how much information can be provided by the structural model (latent variable relationship) result from GeSCA analysis. The Goodness of fit structural model in this research measured using the value of FIT and AFIT, the result of processing by using the GeSCA can be seen in Table 4. The Structural model is “good” when the value is > 0.5.
Table 4
The Test Result of FIT Model
Model Fit
FIT 0.553
AFIT 0.536
Source: Output Data GeSCA
FIT shows a variant of the total of all the variables that can be explained by the structural model. The value of FIT range from 0 to 1, which means the greater FIT value, then the greater the proportion of the variant variables that can be explained by the model. When the FIT value = 1 it means the model can explain perfectly the inves-tigated phenomenon.
From Table 4 show that the form model is able to explain all existing variables of 0.553. The variety of supplier trust, supplier commitment, information sharing, collaboration, and supplier performance which can be explained by the model is 55.3% and the rest of 44.7% can be explained by the other variable. It can be concluded from the value of the FIT obtained, the developed model in this research is feasible to explain the investigated phenomenon.
When viewing from AFIT value of 0.536, the variety of supplier trust, supplier commitment, and in-formation sharing, collaboration, and supplier perfor-mance which can be explained by the model is 53.6% and the rest of 46.4% can be explained by the other variable. It possibly mentioned that the model in this research is feasible to explain the investigated phenomenon.
Measures of Fit Overall Model
Overrall Model is a model in GeSCA involving structural models and measurement models in an integrated way, this is an overall model. The examina-tion of goodness of fit overall models measure from the cut-off value along with SRMR criteria. This can be done in the overall model of all variables that have a reflexive indicator.
Table 5
The Goodness of Fit overall size in GeSCA
Goodness of
Fit Cut-off
Keterangan
GFI ≥ 0.90 Mirip dengan R2 dalam regresi SRMR ≤ 0.08 Setara dengan RMSEA pada
SEM Source: Output Data GeSCA
The examination of the goodness of fit overall model in this research is shown in Table 5 with the value of GFI (Unweight least-square) and SRMR (standardized root mean square residual). GFI and
SRMR are the difference proportion of the covariance sample and covariance which produced by GeSCA estimated parameter. GFI number is close to 1 and SRMR number is close to 0, those indicate that research model is fit.
Table 6
The Test Result of Goodness of Fit Overall Model
Model Fit
GFI 0.980
SRMR 0.175
Source: Output Data GeSCA
In Table 6 above it can be viewed that the value of GFI is 0.980, it can be said that the model is fit in or feasible. Base on the SRMR criteria it can be concluded that the examination model is acceptable in the marginal fit category or the model is quite appropriate. It is because the value of the data that may not correspond to the actual value or the effect of indicators direction between each variable are still unnoticeable.
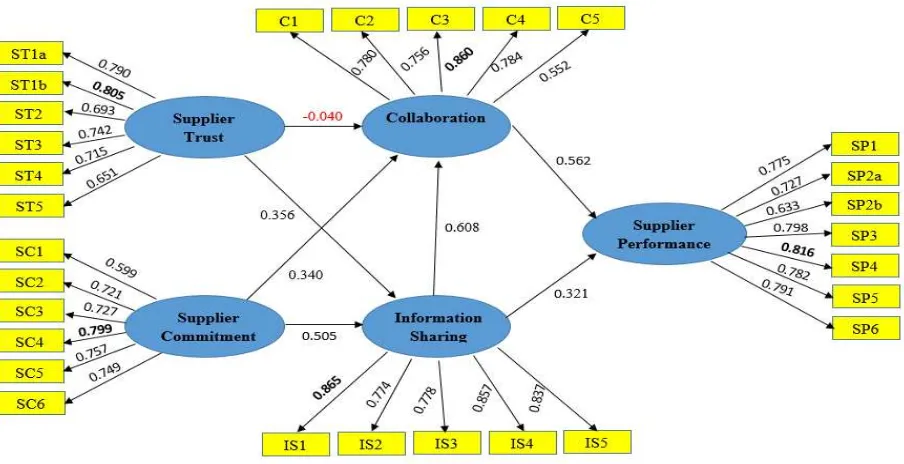
Based on the analysis result of the connectivity by using GeSCA software with completed indicators that formed variable, can be viewed in Figure 2.
Variable of supplier trust measured by five items of indicators, that is ST1 is divided into two formula, ST1a with loading factor of 0.709 and ST1b with loading factor of 0.805, ST2 with loading factor of 0.693, ST3 with loading factor of 0.742, ST4 with loading factor of 0.715 and ST5 with loading factor of 0.651. Therefore, the indicators ST1 represented by
ST1b formula can rely on to control the quantity of the materials supplied to the PT. Vale Indonesia Tbk is the best indicator variables can describe supplier trust. The estimated value of the indicator is greater compared to others indicator.
Variable of supplier commitment in this research used six indicator items, which is SC1 with a loading factor of 0.599, SC2 with a loading factor of 0.721, SC3 with a loading factor of 0.727, SC4 with a loading factor of 0.799, SC5 with a loading factor of 0.757, and SC6 with a loading factor of 0.749. It can be concluded that the indicators SC4 is loyal to fulfilled materials requested by PT. Vale Indonesia Tbk this the most indicator that can described supplier commitment variable. The value in that indicator is greater compared to others indicator.
Variable of information sharing in this research is measured from five items of indicator, which is IS1 with loading factor of 0.865, IS2 with loading factor of 0.774, IS3 with loading factor of 0.778, IS4 with loading factor of 0.837. It can be concluded that indicator of IS1 which explains that the company’s suppliers to exchange information with PT. Vale Indonesia Tbk continuously, clear, and accurate in term to help smooth the process in accordance with the business plan. The mentioned indicator is an indicator that most describes the variable information sharing. The estimated value of the indicator is greater than others indicator.
Collaboration variables using five indicator items that are C1 with loading factor of 0.780, C2 with loading factor of 0.756, C3 with loading factor of 0.860, C4 with loading factor of 0.784 and C5 with loading factor of 0.552. The C3 indicator is about well coordinating between each party in order to avoid any misperception, this is the most indicator that can represent the collaboration variable. The estimated value of the indicator is greater than others indicator.
The fifth variable is supplier performance, in this research supplier performance was measured from 6 items of indicator, which are SP1 with loading factor of 0.775, SP2 divided into two formulas that are SP2a with loading factor of 0.727 and SP2b with loading factor of 0.633, SP3 with loading factor of 0.798, SP4 with loading factor of 0.816, SP5 with loading factor of 0.782 and SP6 with loading factor of 0.791. Indicator of SP4 is increasing in the quality of material provided during relationship cooperation, this is the most indicator that can represent the supplier performance variable. The estimated value of the indicator is greater than others indicator.
Discussion
Figure 2 is a model of research result by using GeSCA software indicating that out of seven
thesis submitted in this research, only six hythesis are acceptable, that are supplier trust has a po-sitive impact and significant on information sharing (H2), Supplier Commitment has a positive impact and significant on Collaboration (H3), Supplier Commit-ment has a positive impact and significant on infor-mation sharing (H4), Information Sharing has a positive impact and significant on Collaboration (H5), Information Sharing has a positive impact and signi-ficant on Supplier Performance (H6), and Collabora-tion has a positive impact and significant on Supplier Performance (H7). There was one rejected hypothesis that is Supplier Trust since it does not impact on Collaboration (H1).
The following is the explanation of the relation-ship between variable in this research:
1. Supplier Trust Collaboration
Supplier Trust has no effect against Collaboration, this due to the trust of the supplier alone is not enough to build Collaboration, and to achieve Collaboration must have high commitment and continuous information exchange, clear and accu-rate between supplier and PT. Vale Indonesia Tbk. In terms of quality and quantity of materials delivered by the supplier as an order from PT. Vale Indonesia Tbk not able to give effect to the collaboration, it is because there is a lack of coor-dination which leads to frequent mispercception and no flexibility toward the materials demand at any time.
2. Supplier Trust Information Sharing
Supplier Trust has an impact on Information Sharing. The quality and quantity of materials supplied by the supplier are an evidence of confidence from PT. Vale Indonesia, it would give impact to the improvement of information sharing since the supplier will always coordinate with PT. Vale Indonesia Tbk about the quality of materials that will be sent, this can help to smooth the process in accordance with the company business plan.
3. Supplier Commitment Collaboration
Supplier Commitment has an impact on Collabo-ration. Suppliers that faithfully in providing mate-rial needs required by PT. Vale Indonesia Tbk also is over in achieving goals and targets to be achieved in dealing with periodic cooperation would affect the collaboration because the existence of good coordination will minimize the occurrence of misperception and will develop flexibility in responding to changes in the demands for materials. 4. Supplier Commitment Information Sharing
required requested by PT. Vale Indonesia Tbk faithfully will help to achieve the goals and objective in conducting cooperation relationship periodically, this can happen due to the existence of a continuous exchange of information, clear and accurate about the quality of the materials this can help to smooth a process in accordance with business planning.
5. Information Sharing Collaboration
Information Sharing has an effect on Information Sharing. The existence of a continuous exchange of information, clear and accurate about the qua-lity of materials will help to smooth the process in accordance with business planning. This can occur if between both side supplier and PT. Vale Indo-nesia Tbk manages to improve a good coordina-tion to avoid any mispercepcoordina-tion and supplier also flexible in response to changes in the demands for materials.
6. Information Sharing Supplier Performance Information Sharing has an effect on Supplier Performance, the existence of a continuous exchange of information, clear and accurate regarding the quality of materials, can give impact on supplier performance, such as supplier can help on smooth the process in accordance with business planning by delivered materials to PT. Vale Indonesia Tbk on time or according to the date that has been agreed upon together as well as improve the quality of materials provided.
7. Collaboration Supplier Performance
Collaboration has an impact to Supplier Perfor-mance. A good coordination is a form of coor-dination which aims to prevent the occurrence of mis-perception it gives impact to the performance of the supplier, the supplier can be flexible in responding to the existence of the necessary changes to materials and punctuality in material delivery to PT. Vale Indonesia Tbk in accordance with agreed upon together and there is an increase in the quality of materials given to PT. Vale Indonesia Tbk.
Conclusion and Implications
Based on the result of processing, data analysis and discussion as described in the previous chapter, then the conclusion is as follows:
1. Supplier Trust has no effect on Collaboration, therefore Supplier Trust can not become suitable variables to measure the Collaboration since Sup-plier Trust has no effect on Collaboration. 2. Supplier Trust has an effect on Information
Sharing, therefore, Supplier Trust has an affect on Information Sharing.
3. Supplier Commitment has an effect on Colla-boration, therefore, Supplier Commitment has an effect on Collaboration.
4. Supplier Commitment has an affect on the Infor-mation sharing, therefore, Supplier Commitment has an effect on the Information Sharing.
5. Information Sharing has an affect on Collabora-tion, therefore, Information sharing has an effect on Collaboration.
6. Information Sharing has an effect on the Supplier Performance, therefore, Information Sharing has an effect on the Supplier Performance.
7. Collaboration effect the Supplier Performance, therefore, Collaboration effect Supplier Perfor-mance.
Based on the result of this research, researchers will provide some inputs are considered necessary for enhance both the practice and theory, the input is as follow: Supplier Trust actually is very high, but still need to be considered more deeply related to the trust of PT. Vale Indonesia Tbk to all supplier, simply based on trust alone can not make the company wants to participate in the Collaboration, but when accom-panied with a high level of commitment as well as information exchange is more intensive and periodi-cally with the aim of creating a good Collaboration then it will have an impact on improving Supplier Performance. The company is expected to be more transparent in establishing a cooperative relationship with suppliers. Vice versa with supplier companies to be more focusing on the professionalism, especially in terms of receiving and giving information.
When there will be a continuation of this research, it is recommended to the next researchers to be more specific in doing research in the mines company by making the mining company as a res-pondent so that the results obtained can be seen from two directions, both the company and the suppliers. It is to know in more detail about what things can give effect to the Supplier Performance. The next researchers can enrich the study of supplier performance by including other variables that may explain the relationship and influence on supplier performance.
References
Baier, C., Hartmann, E., & Moser, R. (2008). Stra-tegic alignment and purchasing efficacy: An exploratory analysis of their impact on financial performance. Journal of Supply Chain Manage-ment, 44(4), 36–52.
supply relationships. Journal of Business & Industrial Marketing, 26(6), 395–405.
Cheng, T. & Wu, Y. (2005). The impact of informa-tion sharing in a two-level supply chain with multiple retailers. Journal of the Operational Research Society, 56, 1159–1165.
Chen, J. V., Yen, D. C., Rajkumar, T. M., & Tomo-chko, N. A. (2011). The antecedent factors on trust and commitment in supply chain relation-ships. Computer Standards & Interfaces, 33, 262–270.
Daugherty, P. J., Ellinger, A. E., & Rogers, D. S. (2004). Information accessibility customer responsiveness and enhanced performance. International Journal of Physical Distribution and Logistics Management, 25(1), 4–17. Daugherty, P. J., Richey, R. G., Genchev, S. E., &
Chen, H. (2005). Reverse logistics: Superior performance through focused resource commit-ments to information technology. Transporta-tion Research, Part E 41, 77–92.
Heizer, J. & Render, B. (2010). Manajemen operasi. Edisi 9. Jakarta: Salemba Empat.
Jack, E. P. & Powers, T. L. (2015). Managing strate-gic supplier relationship: Antecedents and out-comes. Journal of Business & Industrial Marketing, 30(2), 129–138.
Kuncoro, M. (2009). Metode riset untuk bisnis & ekonomi bagaimana meneliti & menulis tesis. Jakarta: Penerbit Erlangga.
Kwon, I. W. G. & Suh, T. (2005). Trust, commitment and relationships in supply chain management: A path analysis. Supply Chain Management: An International Journal, 10(1), 26–33.
Marpaung, J. R. & Sunaryo, B. N. (2002). Penentuan sistem penilaian kinerja pemasok sebagai bagi-an dari implementasi supply chain mbagi-anagement dengan metode analytical hierarchy process. Depok: Universitas Indonesia.
Martin, R. & Patterson, W. (2006). Data sharing in a multi-tiered supply chain network. Supply Chain Forum, 7 (1), 82–92.
Min, S. H., Roath, A. S., Daugherty, P. J., & Riechy, R. G. (2005). Supply Chain Collaboration: What's Happening? The International Journal of Logistics Management, 16(2), 237–256.
Miguel, P. L. S. & Brito, L. A. L. (2011). Supply chain management measurement and its influence on operational performance. Journal of Operations and Supply Chain Management, 4(2), 56–70.
Monczka, R. M., Petersen, K. J., Handfield, R. B., & Ragatz, G. L. (2008). Success factors in strategic supplier alliances: The buying company per-spective. Decision Science, 29(3), 5553–5577.
Morgan, R. M. & S. D. Hunt. (1994). The commit-ment-trust theory of relationship marketing. Journal of Marketing, 58, 20–38.
Mugarura, J. T. (2010). Buyer-supplier collaboration, adaptation, trust, commitment and relationship continuity of selected private manufacturing firms in Kampala. Dissertation. Makerere University Business School.
Nyaga, G., Whipple, J., & Lynch, D. (2010). Exa-mining supply chain relationships: Do buyer and supplier perspectives on collaborative relation-ships differ? Journal of Operations Manage-ment, 28(2) 101–114.
Patnayakuni, R., Rai, A., & Seth, N. (2006). Relatio-nal antecedents of information flow integration for supply chain coordination. Journal of Mana-gement Information Systems, 23(1), 13–49. Prahinski, C. & Benton, W. (2004). Supplier
evalua-tions: Communication strategies to improve sup-plier performance. Journal of Operations Mana-gement, 22(1), 39–62.
Pujawan, I. N. & Mahendrawathi, E. R. (2010). Supply Chain Management. Surabaya: Penerbit Guna Widya.
Ralston, P. M. (2014). Supply chain collaboration: A literature review and empirical analysis to investigate uncertainty and collaborative benefits in regards to their practical impact on collabo-ration and performance. Dissertation, Digital Repository. Ames, Iowa: Iowa State University. Rodriguez, C. S., Hemsworth, D., &
Martinez-Lorente, A, R. (2005). The effect of supplier development initiatives on purchasing perfor-mance: A structural model. Supply Chain Mana-gement: An International Journal, 10(4), 289– 301.
Sandberg, E. (2007). Logistics collaboration in supply chains: Practice vs theory. International Journal of Logistics Management, 18(2), 274–293. Sarwono, J. & Martadiredja, T. (2008). Riset bisnis
untuk pengambilan keputusan. Yogyakarta: Penerbit Andi.
Simatupang, T. M., & Sridharan, R. (2005). The collaboration index: A measure for supply chain collaboration. International Journal of Physical Distribution & Logistics Management, 35(1), 44–62,
Smaros, J. (2007). Forecasting collaboration in the European grocery sector: observations from a case study. Journal of Operation Management, 25, 702–716.
Studi Magister Manajemen Fakultas Ekonomi Universitas Kristen Petra, Surabaya.
Stock, J. R. & Lambert, D. M. (2001). Strategic Logistics Management, 4th ed., New York: McGraw-Hill.
Sugiyono. (2009). Metode penelitian bisnis. Bandung: Penerbit Alfabeta.
Tenenhaus, M. (2008). Component-based structural equation modelling. Total Quality Management and Business Excellence, 19, 871–886.
Ting, S. & Cho, D. (2008). An integrated approach for supplier selection and purchasing decisions. Supply Chain Management, 13(2), 116–127 Tsai, Y. L. (2006). Supply chain collaborative
prac-tices: A supplier perspective. 12th IFPSM Sum-mer School.
Verdiar, R. P. & Siagian, Y. M. (2014). Pengaruh ketergantungan dan kepercayaan pada pemasok terhadap kinerja keuangan melalui integrasi dengan pemasok pada perusahaan manufaktur di PIK, Pulogadung. E-Journal Manajemen Fakul-tas Ekonomi UniversiFakul-tas Trisakti, 1(1), 76–92. Vereecke, A. & Muylle, S. (2006). Performance
improvement through supply chain collaboration in Europe. International Journal of Operations & Production Management, 26(11), 1176–1198. Williams, B. & Tokar, T. (2008). A review of