DIVERSIFICATION STRATEGIC CHOICES
AND ITS IMPLICATION ON FIRM PERFORMANCE
Hj. Dr. Sulastri*
H. Isnurhadi, PhD*
Abstract
A large number of studies about diversification conducted by many previous researches reveal different results. The phenomenon of company diversification in Indonesia occurred at the end of the eighties to the middle of nineties. However, this phenomenon was dominated by a small groups of large with the significant growth of unrelated businesses. Furthermore, some large companies that diversified at the end of the eighties, most of them has divested their businesses at the medio of nineties that caused most of the largest companies conducted restructuring.
Based on the literature review matched with the phenomeno above encourages the authors to conduct a study in order to clarify how the strategic choice implicates the related business or unrelated business toward market share, compensation, leverage, financial performance and shareholders.
A sample of 155 companies in manufacturing, trade and property are used in this study with crossectional data of 2002. Multivariate analysis of variance with its assumption is used and data transformation is used for total assets. The test of model concordance analysis shows a level of significance > 0.05 to fulfill Manova assumption and equality of variance assumption test is performed for each variables to make sure that Manova analysys could be applied.
This study reveals that all hypotheses about the implication of diversification on leverage are proven. It proves that leverage at unrelated business is greater than related business. The implication of diversification on market share shows that the more unrelated the business, the larger the market share. The implication of diversification on performance proves that the performance of related business is better than unrelate business. Shareholder value of related business creates larger market value than unrelated business.
Business phenomenon in Indonesia clarifies that diversification strategic choice of related business creates more value than unrelated business and it supports some previous studies.
________________________________
Key words : related, unrelated business, diversification, leverage, market share, compensation, firm performance, share-holder value.
*Senior Lecturers at Faculty of Economics, Sriwijaya University, Palembang Indonesia
Correspoding author: H. Isnurhadi, PhD, email:[email protected], Phone: +6281367703535
I. BACKGROUND
Ansoff (1965), Rumelt (1974), Hitt & Hokisson (1990) opine that diversification has a potential to create value. This opinion is consistent with economies of scope theory introduced by Clarkson (1983). Nayyar (1993) indicates that a company with many business units is able to gain economic advantages for example, assets use, reputation, internal fund allocation with cheaper cost. On the other hand, some studies by Shleifer and Vishny (1991), Matsusaka (1993), Lang and Stulz (1994), Berger and Offek (1996), Servaes (1996) find that diversification create no value. On the other side, Barney (2002) states that with resource based approach, diversification could be used as a source of sustainable competitive advantage.
This opinion is supported by the prelimanary of this study which shows that the unrelated business companies have higher level of debts compared to other form of diversification (Data BaseBEJ 2002 Interim Report, processed). This matter as an indication that companies in Indonesia in general tend to focus on high growth in short period of time. Pengestu et al (1996) also state that multinational companies focus more on core business and in general are more successful in global competition.
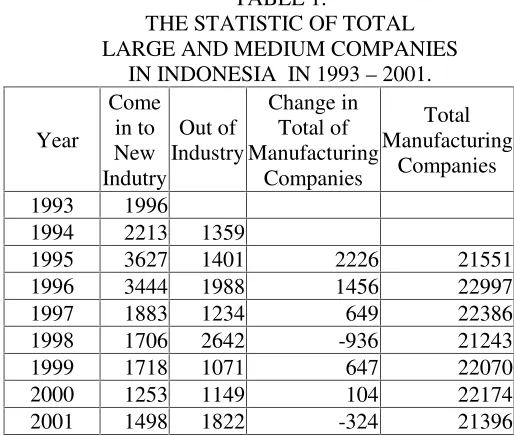
The dynamicsm of manufactruting companies in Indonesia during 1993-2001 grew fluctuatetively. The growth of that industry is displayed in Table 1. Table 1 shows that the total of large dan medium during 1993-2001 change slightly. The potential of in and out of the company into the industry is the reflection of the dynamism of competition in that industry (Porter 1997). The dynamism could affect diversification strategic choices (Dess and Beard 1990, Keats and Hitt 1988).
The findings that the failures of diversification in creating value needs further study because this findings is inconsistent with the theory of economies of scope. This theory describes that multibusiness companies could gain economic advantages such as the uses of common assets, allocating fund for the purpose of reducing or eliminating business risk, or internal transaction which is possibly reducing costs amongst business units (Clarkson 1983, Nayyar 1993).
TABLE 1.
THE STATISTIC OF TOTAL LARGE AND MEDIUM COMPANIES
IN INDONESIA IN 1993–2001.
Year
Come in to New Indutry
Out of Industry
Change in Total of Manufacturing
Companies
Total Manufacturing
Companies
1993 1996
1994 2213 1359
1995 3627 1401 2226 21551
1996 3444 1988 1456 22997
1997 1883 1234 649 22386
1998 1706 2642 -936 21243
1999 1718 1071 647 22070
2000 1253 1149 104 22174
2001 1498 1822 -324 21396
Source: Central Bureau of Statistic, 2002.
II. LITERATURE REVIEW 2.1. Classification of Diversification
Ansoff followed by Hitt & Hoskisson (2001, p. 235) uses the term of diversification as level and type of diversification. Rumelt followed Wrigley (1970) classified diversification based on relation of relatedness amongst business units by measuring the level of related ratio and vertical ratio using the term degree of diversification (Rumelt 1974, p. 29-31). Rumelt, R. (1974) found in his study that there were some differences amongst various diversification. Rumelt (1974) tried to define and modify the measurement of diversification concept used by Wrigley (1970). The combination of Wrigley (1970) and Rumelt (1974) is classified as major category as follows:
1) Single business, means that a firm basically has a commitment toward one business. Amongst unintegrated business vertically has vertical ratio less than 0,7 (VR < 0,7). Single business firm is included the one with Specialization Ratio 0.95, or amongst vertical integration with VR > 0.7, which owns end product from this business contributing 95% or more of total revenues.
(3) Related Business is a firm that is not vertically integrated having specialization ratio less than 0.7 and if diversification is related between new activity with old activity gives related ratio equals 0.7 or more.
(4) Unrelated Business is a firm that is not vertically integrated, having diversification without connection between new business and old business in other words a firm that is defined as having ralated ratio less than 0.7.
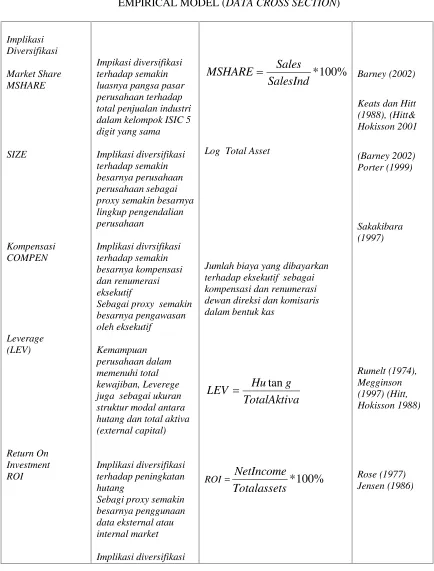
2.2. Diversification Implication on Leverage
Barney ( 2002) shows the source of competitive advantage on finansial asset adalah capital structure, retairned earning and free cash flow. Modigliani dan Miller (1958) theory of Capital structure says that capital structure could increase value and does not afmenyatakan, bahwa struktur modal daect firm performance in relatively perfect market. This theory is consistent with the theory by Jensen dan Meckling (1976) and Myers (1997) that say that a firm with relatively higher leverage tends to reduce the level of investment and maximize firm value. This argument is supported by empirical study (Safieddine and Titman 1999). The study indicates that investment expenditure negatively affect leverage. However, this argument is inconsistent with Rose (1977) which stated that optimisticm toward future productivity will increase leverage. Furthermore, Jensen also said that debt will increase the motivation of management. The study byO’Brien (2003) reveals the higher capital structure the higher the profitability but the interaction between capital structure and innovation affect performance negatively.
Based on the argument above, two hypotheses are generated as follows: Hypothesis 1: The higher the level of diversification the higher the leverage.
Hypothesis 2 : There was difference relationship of diversification and leverage based on firm size. 2.3. Diversificastion Implication On Executive Compensation
Hokisson and Hitt (1990) describes theoritically that excutive compensation is a moderating variable that influence the relationship between managerial motivation dan diversification strategy. Broussard, Buchenroth and Pilotte (2004) on the other hand, shows that there is a relationship amongst CEO incentive, free cash flow and investment. This findings shows that there is a sensitivity toward executive incentive (pay-performance) could eliminate the complicatedness of agency toward free cash flow. Furthermore, the relationship between free cash flow and investment will be stronger for a firm with low pay-performance sensitivity and the relationship will be weaker for high pay-performance sensitivity. Incentive sensitivity of CEO and incentive sensitivity (pay-performance) contributes on reducing underinvestment toward free cash flow from managerial responsibility.
Based on the description above, the following hypotheses are generated:
Hypothesis 3 : The higher the level of diversification the higher executive compensation.
Hypothesis 4 : There is difference relationship of diversification and compensation based on firm size.
2.4. Diversification Implication on Market Share
Catry and Chevalier (1994) state that market share is a strategy. An approach to market share is by looking at the relationship between product life cycle and the position of the firm in the market. Market share diagnosis is one way of adaptation in conducting change in the market. An alternative to market share strategy could be in the form of increasing investment, maintaining market position and divestment.
industrial economic theory that says market share will affect company position in the industrial structure through market power. Companies diversify with motivation to boost market power by doing aquisition, merger, conglomerisation which change industrial concentration toward oligopoly and monopoly and in the end change the indutry behavior and performance (Hasibuan, 1993). To investigate how the level of diversification influence market shares, two hypotheses are generated: Hypothesis 5 : The higher the degree of diversification, the larger the company’s market share.
Hypothesis 6 : There is difference in the relationship between diversificationand market share based on companysize.
2.5. Diversification Implication on Firm Performance
Markides (1993) states that there is an optimal limit (but companies could do unlimited ing disseconomie diversification before reaching disseconomies, particularly managerial diseconomies of scale. The same opinion is also introduced by Montgemery and Wernerfelt (1988) where companies have different level of optimalization toward degree of diversification because different human resource which produce different performance (Mukherjee, 1998). And Palich et al (2000). On the other hand, Datta, Rajagopalan (1991) reports that the relationship between diversification and performance is inconclusivemenunjukkan. It is different from Hokisson (1990) who indicates that the relationship between diversification and performance is nonlinear. Based on this discussion, two hypotheses are generated as follows:
Hypothesis 7 : The higher the degree of diversification, the lower the firm performances. Hypothesis 8 : There is difference in the relationship between diversification
2.6. Diversification Implication on Shareholder Value
Jensen (1986) opines that diversification gives benefit to managers but not creating value for shareholders. Shareholder value can be inferred from the higher market value (market capitalization). Shleifer and Vishny (1991), Berger and Ofek (1996), Sarvaes (1996) find sompanies that focus on increasing market value and stock return. Myers and Majluf (1984) and Hadlock (2001) show that firm diversification give negative signal in the market. This matter is indicated when firm offer its stock for diversification purpose, it is found that market views it negatively compared to focus firms. This finding is consistent with the argument that diversification reduce shareholder value. Based on this discussion, the following hypotheses are generated:
Hypothesis 9 : The higher the degree of diversification, the lower the shareholder value.
Hypothesis 10 : The is difference in the relationship between diversification and shareholder value base on fir size.
III. METHODOLOGY
The sample of this study is manufacturing, trading and property companies that sell their stocks in Jakarta Stock Exchange (JSX) in the year 2002. The total sample is 150 companies. Purposive sampling method is employed with some considerations:
1) Conducting diversificationn from 1990 to 2002
2) Have been public companies when doing diversification 3) The data is complete
4) Choosing different ISIC code for every firm that doing diversification at the same year for the purpose of different environment that exist.
The nature of the data is quantitative and it is secondary data. The sources of the data are Central Bureau of Statistis, JSX and some corporate news and companies’ publication.
To test the empirical study, the technique of analysis of multivariate analysis of variance is used. In this test the independent variable of DIVERSIFICATION is categorical variable that influence more than one numerical dependent variable. The Manova equation model used is as follows:
Y1 + Y2 + Y3 …….Yn = X1
The test equation could be writen as follows:
The above equation could be solved with multivariate analysis of variance (Hair 1995).
Market dengan VR > 0,7. yang memiliki produk akhir dari bisnis tersebut terintegrasi secara vertikal ( V R < 0, 7) tersebut dengan spcialization ratio lebih besar atau sama dengan 0,7 tetapi kurang dari 0,95 termasuk dalam dominant
business.
(3) Related Business : diversifikasi perusahaan yang tidak terintegrasi related ratio sama dengan 0,7 atau lebih.
(4) Unrelated Business :
IV. ANALYSIS AND DISCUSSION 4.1. Descriptive Analysis
The results of descriptive statitic on the cross-sectional data of 155 samples are presented in the following.
Leverage; the mean of leverage (Debt to Equity Ratio) is 0.49 for single business, 0,53 for dominant business, 0.58 for related business and 0.67 for unrelated business. It reveals that the higher the degree of diversification the larger the leverage.
Executive compensation and renumeration: the mean of kompensation is Rp4.692 billion per year for single single business; Rp5.969 billion per year for dominant business;Rp7.043 billion per year for related business and Rp9.526 billion per year for unrelated business. If we look at the average ratio of compensation per executive for single business is Rp438.73 million per year for dominant businessis Rp528.81 million per year for related business is Rp698.08 million per year for unrelated business is Rp910.21 million per year. Descriptive statistics reveals that the higher the degree of diversification, the average of executive cost inreases.
Market Share; average market share for single business is 8%, for dominant business sebesar 6%, for related business 5% and for 0.23 %. This figures indicate that the market share for unrelate business is the largest. However, the market share for the single business is larger than dominant and related business. This finding shows that market power strategy tends to occur at unrelated business.
Firm Performance; average firm ROI for single business is 7.04%, dominant business 3.53%, related business 4.99% and unrelated business 3.8%. This finding proves the performance of single business firm generate better performance compared to another three categories. However, the performance of unrelated business is the lowest amongst them. Hence, it can be concluded that diversification performance takes the form of nonlinier curve. The degree of diversification for certain limit increase its vlue but overdiversification decrease its value. The smallest ROI is – 13.23 % for unrelated business, followed by single business –9.95% while the largest ROI is 25.65% for relate business and single business 24.10%.
Firm Value; shareholder value proxied by market capitalization. Average value of market capitalization for single business Rp244,726 billion per year, dominant business Rp1,787.798 billion per year, related business Rp445,213 billion per year, and unrelated business Rp857,41per year. It indicates that the largest market capitalization is dominant business whereas the smallest is single business. Market capitalization for related business is lower than unrelated business. This is the reflection of the relationship between diversification and shareholder value also is in the form of nonlinier curve.
4.2. Parameter Estimation
4.2.1. Test of Between Subject Effects
Test of between subject effects is to test the influence of univariat ANOVA for every diversification classification toward all dependent variables. The result shows that the influence of diversification on market share is significant at 5% level while the others are significant. It means that market share is differenct for diversification group. For Size variable indicates Leverage (Debt To Equity) is significant at 1% level, CAPM (market value) at 1% level and market share also significant at 1% level. This indicates that all variables above are different for every Size group or firm size (low , moderate and high size).
between single business and dominant business. For variable MSHARE there is significant difference between single business and unrelated business and betwen dominant business and unrelated business at –50,69% dan–37,10%.
Group based on firm size (SIZE), multiple comparisons test shows there is significant on LEVERAGE variable between small firm (LOW SIZE) and large firm (HIGH SIZE) on average at– 25,12%. It means large companies tend to have larger debt compared to small companies as much as 25,12%. Between MODERATE SIZE and HIGH SIZE there is dinference in LEVERAGE as much as -6,67% but between LOW SIZE and MODERATE SIZE is not significant.
For ROI (Return On Investment) and COMPEN (Compensation) there is no significant difference between large companies and small companies. For MSHARE there is significant difference for every SIZE group. Market share difference antara LOW SIZE and MODERATE SIZE is as much as –43.29%. It means that MODERATE SIZE has larger market share as much as 43,29%. The difference between LOW SIZE and HIGH SIZE as much as –82.35%. It means that HIGH SIZE has market share that is much larger than LOW SIZE as much as 82.35%. The difference between MODERATE SIZE and HIGH SIZE as much as–39.07%. It means that HIGH SIZE has market share 39.07% larger than MODERATE SIZE. From the discussion above, it can be concluded that the larger the companies the alrger the market share.
For (Market Capitalization) there is a significant difference in SIZE group. The difference between LOW SIZE and MODERATE SIZE is–41,74%, between LOW SIZE and HIGH SIZE is – 90,71%, and between MODERATE SIZE and HIGH SIZE is–48,97%. This discussion concludes that the larger the firm tends to create less velue.
V. CONCLUSION AND IMPLICATION 5.1. Conclusions
Based on the Manova test, some conclusions caan be addressed as follows:
1. There are significant differences for each diversification groups toward Market share but Leverage, Compensation, ROI and market value is insignificant. However, if it is grouped into Size (low, moderate dan high size), there are significant difference toward Leverage (Debt To Equity) ; CAPM (market value) and MARKET SHARE for each Size group.
2. The marginal estimation mean at the plot profile indicates:
a. The higher the degree of diversification, the higher the leverage or the more unrelated business, the higher the leverage and large companies (high size) have higher leverage compared to moderatel and low size.
b. The relationship between diversification and total cost of compensation take form of nonlinier curve meaning the effect of diversificatio with total cost of compensation has optimal limit dan the higher the degree of diversification, total cost of compensation declines. In contrast, if we look at cost of compensation per executive (per person) indicates the higher the degree of diversification, the higher the cost of individual executive. If we group them based on size of the firm, it indicates that cost of compensation at high size companies is larger than moderate and low size companies. c. The relationship between diversification and market share shows that the higher the degree
of diversification, the larger the market share. It if is controlled by size, of the firm, reveals that high-size companies have larger market share than moderate and low-size companies. d. The relationship between diversification and performance is in the form of nonlinier curve.
Diversification performance has optimal limit and the higher the degree of diversification, the lower the performance. If we control the equation with size, high-size companies the higher the diversification the higher the performance.
5.2 Implications
The finding of this study supports agency theory.The empirical test result is also consitent with the findings of Chatterjee and Wernerfelt (1988) and Barton and Gordon (1988). The finding related with diversification and renumeration is in line with the findings of previous reseearches done by Byrd , Parrino and Pritsch, 1998; Broussard, Buchenroth and Pilotte, 2004: Rose, N.L., and Shepard, A., 1977. Furthermore, in relation with the effect of diversification on market size, this study is in support of studies by Barney (2002) which argued that the rationality of the firm in conducting diversification with the anticompetitive motive by exploiting market share. This finding is consistent with Slater and Narver (1994, 1990), Bourantas, Dimitris and Mandes (1987), Szymanski, David M, Bharadwaj and Varadarajan (1993) but is in contrary with Amstrong and Gree (2005). In term of impact of diversification on performance, this study supports Dobrev and Carrol (2003), Barney (2002), Hannan and Freeman (1997) and Porter (1995). Finally, the finding of this study about the effect of diversification on shareholder value is consistent with the findings from previous studies such as Sheleifer and Vishny (1991), Berger and Ofek (1996), and Sarvaes (1996) supports Palich, Cardinal and Miller (2000) which report that the relationship between diversification and peformance is in the form of nonlinier curve.
REFERENCE
Ansoff H.Igor, 1965Corporate Strategy, New York, McGraw Hill.
Armstrong, J.S., Gree, K.C., 2005, Competitor – Oriented Objectives : The Myth Of Market Share, International Journal Of Business.
Barney , Jay, 2002 ;Gaining and Sustaining Competitive Advantage, Second Edition, Prentice Hall. Berger & Ofek, 1996 ; Bustup Takeovers of Value- Destroying Diversified Firms, The Journal Of
FinanceVol L1 No 4.
Broussard, J.P., Buchenroth, S.A., Pilotte, E.A., 2004, CEO Incentives, Cash Flow and Investment, Financial Management, Pages 51–70.
Cabral, Louis MB, 2003, R&D Competition When Firms Choose Variance,Journal of Economics & Management Strategy, Volume 12, Number 1, Spring 2003, 139–150
Catry and Chevalier (1994)
Clarkson , Kenneth & Miller, Roger LeRoy, 1983Industrial Organization, Mc Graw Hill.
Datta, Deepak K.; Rajagopalan, Nandini, 1998, Industry structure and CEO characteristics: An empirical study of succession events, Strategic Management Journal, Vol. 19 Issue 9, p833-853.
Dess, Gregory G.; Origer, Nancy K, 1987, Environment, Structure, And Consensus In Strategy Formulation: A Conceptual Integration, The Academy Of Management Review; Vol 12, 2; ABI/INFORM Global, Pp. 313-330
Hadlock, Charles J. (Michigan State University) Ryngaert, Michael ( University of Florida) Thomas, Shawn ( University of Pittsburgh), 2001 ; Corporate Structure and Equity Offerings : Are There Benefits to Diversification,Journal of Buiness, vol 74., No. 4.
Hoskisson and Hitt, 1990 ; Antecedents and Performance Outcomes Of Diversification : A Review and Critique Of Theoritical Perpectives,Journal Of Management, Vol 16 No 2 , 461-509.
Jensen, Michael C. Harvard Business School [email protected] Meckling, William H., 1976 ; Theory Of The Firm: Managerial Behavior, Agency Costs And Ownership Structure,Journal Of Financial Economics, V. 3, No. 4, pp. 305-360,
Jensen, Michael C., 1986, Agency costs of free cash flow, corporate finance, and takeovers,American Economic Review76, 323-329.
Lang, H.P. and R Stulz,1994 ; Tobin’s q corporate diversification and firm performance, Journal of Political Economy.
Lindstrom, Tom, 2004, Resources Based View of Diversification :Main Concepts and Comparison with Other Views, Helsinki University of Technology Department of Industrial Engineering and Management Institute of Strategy and International Business, Seminar in Business Strategy and International Business.
Matsusaka, John G. 1993a. Takeover motives during the conglomerate merger wave. Rand Journal of Economics Autumn,Vol. 24 no. 3, pp. 357-379.
Megginson , William L, 1997,Corporate Finance Theory, Wesley Educational Publisher Inc.
Mukherjee, A., 1998, The Relationship Prior Performance And Diversification : A Study Of Three Industries,Management Decision, Vol. 36 No 3 Pp 180–188.
Nayyar, P.R.,1993., Performamance Effects of Information Asymmetry and Economies of Scope in Diversified Services Firms, Academy Of Management Journal; Vol. 36 No. 1; pp. 28-57. Pangestu, Atje, Mulyadi, 1996 ; Transformasi Industri Indonesia Dalam Era Perdagangan Bebas,
Centre For Strategic and International Studies Jakarta.
Porter, Michael E., 1997 ; From Competitive Advantage To Corporate Strategy,Harvard Business Review, pp 45-59
Rose, N.L., Shepard, A. 1977, Firm Diversification and CEO Compensation : Managerial Ability Or Excecutive entrenchement ?, Rand Journal Of Economics Vol 28 N0 3 Autumn Pp. 489-514. Rumelt, Richard P, 1974 ; Strategy, Structure, and Economic Performance,Harvard Business Scholl
Classic.
Safieddine, A., Titman, S., 1999, Leverage And Corporate Performance : Evidence From Unsuccessful Takeovers ,The Journal of Finance,Vol LIV No 22.
Sakakibara, Mariko., 1997 ; Heterogeneity Of Firm Capabilities and Cooperative Research and Development : an Empirical Examination Of Motives,Strategic Management Journal,Vol 18. Sarvaes , Henri., 1996 ; The Value of Diversification During the Conglomerate Merger Wave, The
Journal Of financeVol L1 No 4,
Shleifer A, Vishny, R.W. 1991, Takeovers in the ‘60s and the 80’s and implication, Strategic Management Journal 12(Winter) 51-59.
Szymanski, David M, Bharadwaj and Varadarajan 1993
Wrigley, Leonard, 1970 ; Divisional Autonomy and Diversification, Unpublished doctoral dissertation, Harvard Business School, 1970.