Lampiran 1
DAFTAR RIWAYAT HIDUP
Nama
: Yunika Khairina
Tempat / Tanggal Lahir
: Medan / 24 November 1994
Jenis Kelamin
: Perempuan
Agama
: Islam
Kewarganegaraan
: Indonesia
Alamat
: Jl. Karya Wisata Komp. Citra Wisata
Blok V No. 22 Medan
Riwayat Pendidikan
: 1. TK Harapan 1 Medan ( 1998 – 2000 )
2. SD Harapan 1 Medan ( 2000 – 2006 )
3. SMP Harapan 2 Medan ( 2006 – 2008 )
4. SMA Harapan 1 Medan ( 2008 – 2011 )
5. Fakultas Kedokteran USU ( 2011 – sekarang )
Riwayat Pelatihan
: Seminar dan Simposium ‘Temu Ilmiah Nasional’
2013.
No.
Usia
Jenis
Kelamin
Status
Gizi
Jenis
Komorbid
Status
Kesadara
n
Urea
Frekn
afas
Tek.
darah
Outco
me
1
61
Pr
Sedang
Hipertensi
Apatis
30
32
130/80
Mngl
2
70
Pr
Sedang
Peny Ginjal
Apatis
351
32
120/60
Mngl
3
46
Lk
Sedang
Hipertensi
Apatis
262
32
127/80
Mngl
4
86
Lk
Buruk
Peny Ginjal
Apatis
226
28
129/47
Mngl
5
56
Pr
Sedang
DM
CM
27.8
28
140/70
Plg
6
62
Pr
Sedang
DM
Somnolen
38.7
28
60/40
Mngl
7
54
Lk
Sedang
Peny Ginjal
Sopor
163
24
70/50
Mngl
8
50
Pr
Buruk
Tdk ada
Apatis
22.5
36
70/40
Mngl
9
49
Lk
Buruk
Tdk ada
CM
100
30
110/70
Mngl
10
44
Lk
Sedang
DM
Apatis
80
32
100/70
Mngl
11
17
Pr
Sedang
Tdk ada
Somnolen
32
41
79/39
Mngl
12
30
Lk
Sedang
Tdk ada
CM
39.5
28
110/60
Mngl
13
40
Pr
Sedang
DM
CM
18
27
140/70
Plg
14
48
Lk
Sedang
Tdk ada
Sopor
121
40
130/90
Mngl
15
79
Pr
Buruk
DM
Somnolen
116.9
20
100/60
Mngl
16
66
Lk
Sedang
Hipertensi
Sopor
141
36
90/60
Mngl
17
75
Pr
Baik
PJK
CM
33.3
22
130/80
Plg
18
76
Lk
Baik
Tdk ada
CM
19
20
121/49
Plg
19
19
Lk
Baik
Tdk ada
CM
23
25
108/65
Plg
20
42
Pr
Sedang
Hipertensi
CM
52
22
150/90
Plg
21
66
Pr
Sedang
Tdk ada
CM
30
40
150/100
Plg
22
62
Pr
Buruk
PJK
CM
19.2
30
120/90
Plg
23
79
Pr
Baik
Tdk ada
Somnolen
30
32
100/60
Mngl
24
68
Pr
Sedang
DM
CM
12
32
100/70
Plg
25
45
Pr
Sedang
Tdk ada
CM
19
28
130/70
Plg
26
41
Lk
Baik
Tdk ada
CM
30
24
110/70
Plg
27
71
Pr
Sedang
DM
CM
24.7
24
200/90
Plg
28
50
Lk
Sedang
Tdk ada
CM
39.3
24
110/70
Plg
29
59
Pr
Buruk
Hipertensi
Somnolen
75
26
140/80
Plg
30
67
Pr
Buruk
Tdk ada
CM
52
20
120/80
Plg
31
58
Pr
Sedang
Peny Ginjal
CM
105
29
120/80
Plg
32
73
Pr
Baik
Tdk ada
Somnolen
19
24
160/90
Plg
33
67
Pr
Sedang
Peny Ginjal
CM
16.8
20
120/60
Plg
34
60
Pr
Baik
Tdk ada
CM
18
20
130/80
Plg
35
57
Lk
Sedang
DM + PJK
Somnolen
87
24
110/60
Mngl
36
70
Pr
Buruk
Liver +
Peny Ginjal
Apatis
37.6
24
110/70
Mngl
37
74
Pr
Sedang
DM
Somnolen
85
30
110/90
Mngl
38
57
Pr
Buruk
Liver
Apatis
113
26
110/60
Mngl
39
52
Pr
Sedang
Tdk ada
CM
19
24
110/80
Plg
40
64
Lk
Sedang
Hipertensi
CM
80
20
90/70
Plg
41
66
Pr
Sedang
DM +
Hipertensi
42
86
Pr
Sedang
Hipertensi
CM
42
20
110/70
Plg
43
25
Lk
Buruk
Tdk ada
Somnolen
76
36
130/80
Mngl
44
66
Lk
Sedang
Liver
CM
35
30
120/70
Plg
45
71
Pr
Sedang
PJK +
Hipertensi
CM
37
32
150/100
Mngl
46
27
Lk
Buruk
Tdk ada
CM
49
30
100/60
Mngl
47
71
Lk
Buruk
Peny Ginjal
CM
175
20
170/110
Plg
48
79
Pr
Sedang
Hipertensi
Somnolen
74
22
140/70
Plg
49
64
Pr
Sedang
Hipertensi
CM
47.9
20
120/80
Plg
50
61
Pr
Sedang
DM
Somnolen
156
37
100/70
Mngl
51
53
Pr
Sedang
Hipertensi
CM
53
25
145/90
Mngl
52
31
Pr
Sedang
Tdk ada
CM
17
30
120/80
Plg
53
45
Pr
Sedang
Tdk ada
CM
33
20
149/94
Plg
54
43
Pr
Sedang
PJK
CM
43
28
120/90
Plg
55
58
Pr
Sedang
PJK
Somnolen
11
20
140/90
Plg
56
27
Pr
Baik
Liver
CM
66
28
110/70
Plg
57
57
Pr
Sedang
DM +
Hipertensi
Sopor
85
30
200/100
Plg
58
49
Lk
Sedang
Tdk ada
CM
23
24
160/90
Plg
59
45
Lk
Buruk
Tdk ada
CM
49
30
110/70
Mngl
60
74
Pr
Buruk
DM
CM
27.5
24
130/90
Plg
61
44
Lk
Sedang
DM +
Hipertensi
Somnolen
11.7
22
140/100
Plg
62
26
Pr
Sedang
Tdk ada
CM
18
37
120/80
Plg
63
20
Lk
Buruk
DM + Peny
Ginjal
CM
188
28
130/110
Plg
64
38
Lk
Sedang
Hipertensi
+ Peny
Ginjal
CM
336
36
160/100
Mngl
65
55
Lk
Baik
DM + PJK
CM
59
39
110/50
Plg
66
74
Lk
Sedang
Tdk ada
CM
32.8
24
130/80
Plg
67
74
Lk
Sedang
Liver
CM
21
20
130/70
Plg
68
85
Pr
Sedang
PJK
Sopor
21
28
70/30
Mngl
69
82
Lk
Sedang
Tdk ada
CM
28.9
40
140/70
Plg
70
52
Pr
Baik
Tdk ada
CM
50
20
150/50
Plg
71
59
Pr
Sedang
Tdk ada
CM
21.6
20
110/80
Plg
72
40
Pr
Sedang
PJK
Apatis
25.6
32
115/70
Plg
Lampiran 6. Output SPSS
Tabel 1. Karakteristik Sampel Berdasarkan Usia
Case Processing Summary
Cases
Valid Missing Total
N Percent N Percent N Percent
Usia1 * Outcome1 73 100,0% 0 ,0% 73 100,0%
Usia1 * Outcome1 Crosstabulation
Outcome1 Total
meninggal
tidak
meninggal meninggal
Usia1 < 65 tahun Count 18 28 46
% within Usia1 39,1% 60,9% 100,0%
% within Outcome1 64,3% 62,2% 63,0%
% of Total 24,7% 38,4% 63,0%
> 65 tahun Count 10 17 27
% within Usia1 37,0% 63,0% 100,0%
% within Outcome1 35,7% 37,8% 37,0%
% of Total 13,7% 23,3% 37,0%
Total Count 28 45 73
% within Usia1 38,4% 61,6% 100,0%
% within Outcome1 100,0% 100,0% 100,0%
% of Total 38,4% 61,6% 100,0%
Tabel 2. Karakteristik Sampel Berdasarkan Jenis Kelamin
Case Processing Summary
Cases
Valid Missing Total
N Percent N Percent N Percent
Jeniskelamin1 *
Outcome1 73 100,0% 0 ,0% 73 100,0%
Jeniskelamin1 * Outcome1 Crosstabulation
meninggal
tidak
meninggal meninggal
Jeniskelamin1 laki-laki Count 13 15 28
% within Jeniskelamin1 46,4% 53,6% 100,0%
% within Outcome1 46,4% 33,3% 38,4%
% of Total 17,8% 20,5% 38,4%
Perempuan Count 15 30 45
% within Jeniskelamin1 33,3% 66,7% 100,0%
% within Outcome1 53,6% 66,7% 61,6%
% of Total 20,5% 41,1% 61,6%
Total Count 28 45 73
% within Jeniskelamin1 38,4% 61,6% 100,0%
% within Outcome1 100,0% 100,0% 100,0%
% of Total 38,4% 61,6% 100,0%
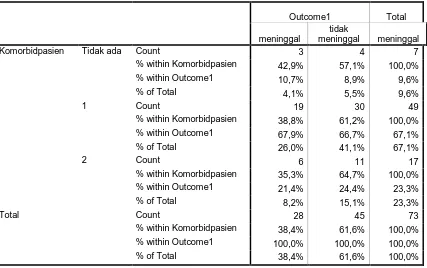
Tabel 3. Karakteristik Sampel Berdasarkan Jumlah Komorbid
Case Processing Summary
Cases
Valid Missing Total
N Percent N Percent N Percent
Komorbidpasien *
Outcome1 73 100,0% 0 ,0% 73 100,0%
Komorbidpasien * Outcome1 Crosstabulation
Outcome1 Total
meninggal
tidak
meninggal meninggal
Komorbidpasien Tidak ada Count 3 4 7
% within Komorbidpasien 42,9% 57,1% 100,0%
% within Outcome1 10,7% 8,9% 9,6%
% of Total 4,1% 5,5% 9,6%
1 Count 19 30 49
% within Komorbidpasien 38,8% 61,2% 100,0%
% within Outcome1 67,9% 66,7% 67,1%
% of Total 26,0% 41,1% 67,1%
2 Count 6 11 17
% within Komorbidpasien 35,3% 64,7% 100,0%
% within Outcome1 21,4% 24,4% 23,3%
% of Total 8,2% 15,1% 23,3%
Total Count 28 45 73
% within Komorbidpasien 38,4% 61,6% 100,0%
% within Outcome1 100,0% 100,0% 100,0%
Tabel 4. Karakteristik Sampel Berdasarkan Jenis Komorbid
Case Processing Summary
Cases
Valid Missing Total
N Percent N Percent N Percent
penyakitliver * Outcome1 73 100,0% 0 ,0% 73 100,0%
penyakitginjal * Outcome1
73 100,0% 0 ,0% 73 100,0%
penyakitDM * Outcome1 73 100,0% 0 ,0% 73 100,0%
penyakitjantung *
Outcome1 73 100,0% 0 ,0% 73 100,0%
hipertensi * Outcome1 73 100,0% 0 ,0% 73 100,0%
Tidakadakomorbid *
Outcome1 73 100,0% 0 ,0% 73 100,0%
penyakitliver * Outcome1 Crosstabulation
Outcome1 Total
meninggal
tidak
meninggal meninggal
penyakitliver ya Count 2 3 5
% within penyakitliver 40,0% 60,0% 100,0%
% within Outcome1 7,1% 6,7% 6,8%
tidak Count 26 42 68
% within penyakitliver 38,2% 61,8% 100,0%
% within Outcome1 92,9% 93,3% 93,2%
Total Count 28 45 73
% within penyakitliver 38,4% 61,6% 100,0%
% within Outcome1 100,0% 100,0% 100,0%
penyakitginjal * Outcome1 Crosstabulation
Outcome1 Total
meninggal
tidak
meninggal meninggal
penyakitginjal ya Count 5 4 9
% within penyakitginjal 55,6% 44,4% 100,0%
% within Outcome1 17,9% 8,9% 12,3%
tidak Count 23 41 64
% within penyakitginjal 35,9% 64,1% 100,0%
% within Outcome1 82,1% 91,1% 87,7%
Total Count 28 45 73
% within Outcome1 100,0% 100,0% 100,0%
penyakitDM * Outcome1 Crosstabulation
Outcome1 Total
meninggal
tidak
meninggal meninggal
penyakitDM ya Count 7 9 16
% within penyakitDM 43,8% 56,3% 100,0%
% within Outcome1 25,0% 20,0% 21,9%
tidak Count 21 36 57
% within penyakitDM 36,8% 63,2% 100,0%
% within Outcome1 75,0% 80,0% 78,1%
Total Count 28 45 73
% within penyakitDM 38,4% 61,6% 100,0%
% within Outcome1 100,0% 100,0% 100,0%
penyakitjantung * Outcome1 Crosstabulation
Outcome1 Total
meninggal
tidak
meninggal meninggal
penyakitjantung ya Count 3 6 9
% within penyakitjantung 33,3% 66,7% 100,0%
% within Outcome1 10,7% 13,3% 12,3%
tidak Count 25 39 64
% within penyakitjantung 39,1% 60,9% 100,0%
% within Outcome1 89,3% 86,7% 87,7%
Total Count 28 45 73
% within penyakitjantung 38,4% 61,6% 100,0%
% within Outcome1 100,0% 100,0% 100,0%
hipertensi * Outcome1 Crosstabulation
Outcome1 Total
meninggal
tidak
meninggal meninggal
hipertensi ya Count 7 10 17
% within hipertensi 41,2% 58,8% 100,0%
% within Outcome1 25,0% 22,2% 23,3%
tidak Count 21 35 56
% within hipertensi 37,5% 62,5% 100,0%
% within Outcome1 75,0% 77,8% 76,7%
Total Count 28 45 73
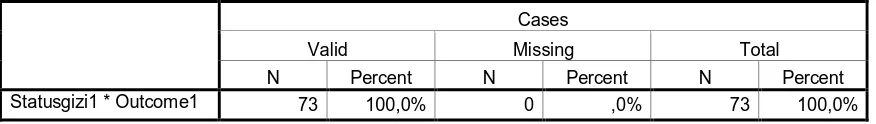
Tabel 5. Karakteristik Sampel Berdasarkan Status Gizi
Case Processing Summary
Cases
Valid Missing Total
N Percent N Percent N Percent
Statusgizi1 * Outcome1 73 100,0% 0 ,0% 73 100,0%
Statusgizi1 * Outcome1 Crosstabulation
Outcome1 Total
meninggal
tidak
meninggal meninggal
Statusgizi1 baik Count 1 9 10
% within Statusgizi1 10,0% 90,0% 100,0%
% within Outcome1 3,6% 20,0% 13,7%
% of Total 1,4% 12,3% 13,7%
sedang Count 18 30 48
% within Statusgizi1 37,5% 62,5% 100,0%
% within Outcome1 64,3% 66,7% 65,8%
% of Total 24,7% 41,1% 65,8%
buruk Count 9 6 15
% within Statusgizi1 60,0% 40,0% 100,0%
% within Outcome1 32,1% 13,3% 20,5%
% of Total 12,3% 8,2% 20,5%
Total Count 28 45 73
% within Statusgizi1 38,4% 61,6% 100,0%
% within Outcome1 100,0% 100,0% 100,0%
% of Total 38,4% 61,6% 100,0%
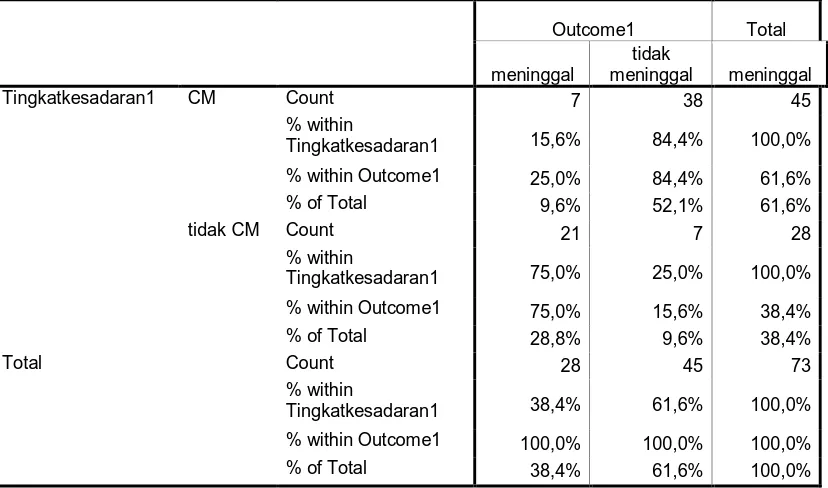
Tabel 6. Karakteristik Sampel Berdasarkan Tingkat Kesadaran Saat Awal
Masuk
Case Processing Summary
Cases
Valid Missing Total
N Percent N Percent N Percent
Tingkatkesadaran1 *
Outcome1 73 100,0% 0 ,0% 73 100,0%
Outcome1 Total
meninggal
tidak
meninggal meninggal
Tingkatkesadaran1 CM Count 7 38 45
% within
Tingkatkesadaran1 15,6% 84,4% 100,0%
% within Outcome1 25,0% 84,4% 61,6%
% of Total 9,6% 52,1% 61,6%
tidak CM Count 21 7 28
% within
Tingkatkesadaran1 75,0% 25,0% 100,0%
% within Outcome1 75,0% 15,6% 38,4%
% of Total 28,8% 9,6% 38,4%
Total Count 28 45 73
% within
Tingkatkesadaran1 38,4% 61,6% 100,0%
% within Outcome1 100,0% 100,0% 100,0%
% of Total 38,4% 61,6% 100,0%
Tabel 7. Karakteristik Sampel Berdasarkan Kadar Urea Saat Awal Masuk
Case Processing Summary
Cases
Valid Missing Total
N Percent N Percent N Percent
Urea1 * Outcome1 73 100,0% 0 ,0% 73 100,0%
Urea1 * Outcome1 Crosstabulation
Outcome1 Total
meninggal
tidak
meninggal meninggal
Urea1 < 20 mg/dl Count 0 11 11
% within Urea1 ,0% 100,0% 100,0%
% within Outcome1 ,0% 24,4% 15,1%
% of Total ,0% 15,1% 15,1%
> 20 mg/dl Count 28 34 62
% within Urea1 45,2% 54,8% 100,0%
% within Outcome1 100,0% 75,6% 84,9%
% of Total 38,4% 46,6% 84,9%
Total Count 28 45 73
% within Urea1 38,4% 61,6% 100,0%
% within Outcome1 100,0% 100,0% 100,0%
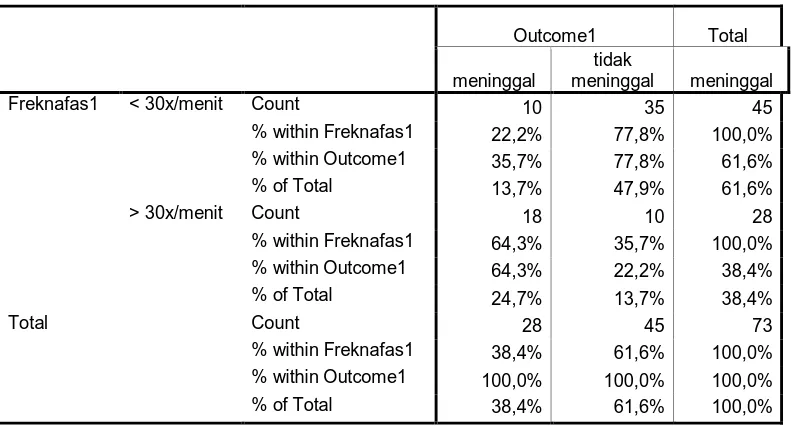
Tabel 8. Karakteristik Sampel Berdasarkan Frekuensi Nafas Saat Awal
Masuk
Case Processing Summary
Cases
Valid Missing Total
N Percent N Percent N Percent
Freknafas1 * Outcome1 73 100,0% 0 ,0% 73 100,0%
Freknafas1 * Outcome1 Crosstabulation
Outcome1 Total
meninggal
tidak
meninggal meninggal
Freknafas1 < 30x/menit Count 10 35 45
% within Freknafas1 22,2% 77,8% 100,0%
% within Outcome1 35,7% 77,8% 61,6%
% of Total 13,7% 47,9% 61,6%
> 30x/menit Count 18 10 28
% within Freknafas1 64,3% 35,7% 100,0%
% within Outcome1 64,3% 22,2% 38,4%
% of Total 24,7% 13,7% 38,4%
Total Count 28 45 73
% within Freknafas1 38,4% 61,6% 100,0%
% within Outcome1 100,0% 100,0% 100,0%
% of Total 38,4% 61,6% 100,0%
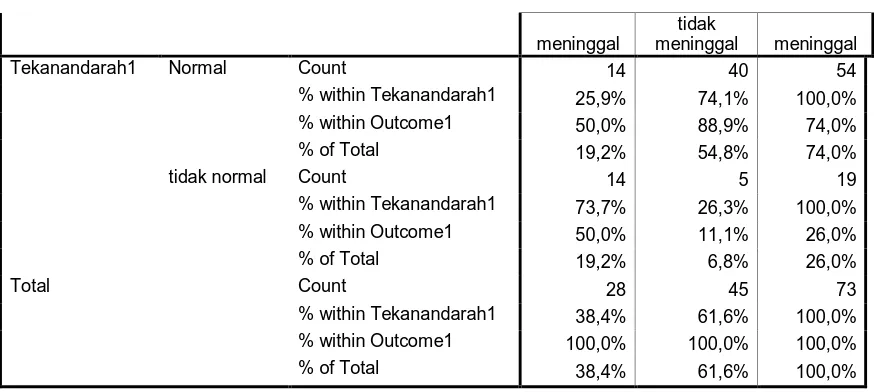
Tabel 9. Karakteristik Sampel Berdasarkan Tekanan Darah Saat Awal
Masuk
Case Processing Summary
Cases
Valid Missing Total
N Percent N Percent N Percent
Tekanandarah1 *
Outcome1 73 100,0% 0 ,0% 73 100,0%
Tekanandarah1 * Outcome1 Crosstabulation
meninggal
tidak
meninggal meninggal
Tekanandarah1 Normal Count 14 40 54
% within Tekanandarah1 25,9% 74,1% 100,0%
% within Outcome1 50,0% 88,9% 74,0%
% of Total 19,2% 54,8% 74,0%
tidak normal Count 14 5 19
% within Tekanandarah1 73,7% 26,3% 100,0%
% within Outcome1 50,0% 11,1% 26,0%
% of Total 19,2% 6,8% 26,0%
Total Count 28 45 73
% within Tekanandarah1 38,4% 61,6% 100,0%
% within Outcome1 100,0% 100,0% 100,0%
% of Total 38,4% 61,6% 100,0%
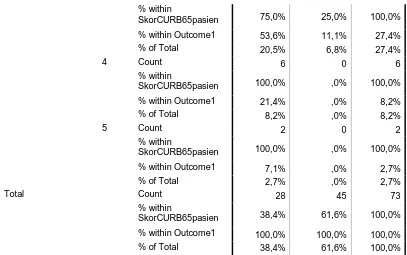
Tabel 10. Distribusi Skor CURB-65 Pada Kelompok Kasus dan Kontrol
Case Processing Summary
Cases
Valid Missing Total
N Percent N Percent N Percent
SkorCURB65pasien *
Outcome1 73 100,0% 0 ,0% 73 100,0%
SkorCURB65pasien * Outcome1 Crosstabulation
Outcome1 Total
meninggal
tidak
meninggal meninggal
SkorCURB65pasien 0 Count 0 3 3
% within
SkorCURB65pasien ,0% 100,0% 100,0%
% within Outcome1 ,0% 6,7% 4,1%
% of Total ,0% 4,1% 4,1%
1 Count 1 21 22
% within
SkorCURB65pasien 4,5% 95,5% 100,0%
% within Outcome1 3,6% 46,7% 30,1%
% of Total 1,4% 28,8% 30,1%
2 Count 4 16 20
% within
SkorCURB65pasien 20,0% 80,0% 100,0%
% within Outcome1 14,3% 35,6% 27,4%
% of Total 5,5% 21,9% 27,4%
% within
SkorCURB65pasien 75,0% 25,0% 100,0%
% within Outcome1 53,6% 11,1% 27,4%
% of Total 20,5% 6,8% 27,4%
4 Count 6 0 6
% within
SkorCURB65pasien 100,0% ,0% 100,0%
% within Outcome1 21,4% ,0% 8,2%
% of Total 8,2% ,0% 8,2%
5 Count 2 0 2
% within
SkorCURB65pasien 100,0% ,0% 100,0%
% within Outcome1 7,1% ,0% 2,7%
% of Total 2,7% ,0% 2,7%
Total Count 28 45 73
% within
SkorCURB65pasien 38,4% 61,6% 100,0%
% within Outcome1 100,0% 100,0% 100,0%
% of Total 38,4% 61,6% 100,0%
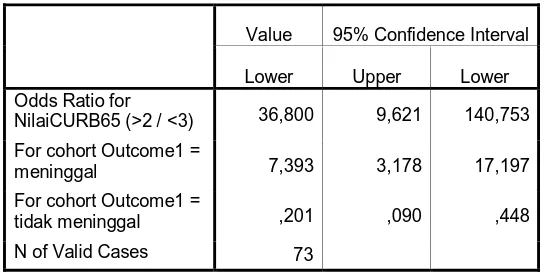
Tabel 11. Hubungan Skor CURB-65 Dengan Kejadian Mortalitas Pneumonia
Komunitas
Case Processing Summary
Cases
Valid Missing Total
N Percent N Percent N Percent
NilaiCURB65 * Outcome1 73 100,0% 0 ,0% 73 100,0%
NilaiCURB65 * Outcome1 Crosstabulation
Outcome1 Total
meninggal
tidak
meninggal meninggal
NilaiCURB65 >2 Count 23 5 28
% within NilaiCURB65 82,1% 17,9% 100,0%
% within Outcome1 82,1% 11,1% 38,4%
% of Total 31,5% 6,8% 38,4%
<3 Count 5 40 45
% within NilaiCURB65 11,1% 88,9% 100,0%
% within Outcome1 17,9% 88,9% 61,6%
% of Total 6,8% 54,8% 61,6%
Total Count 28 45 73
% within NilaiCURB65 38,4% 61,6% 100,0%
% of Total 38,4% 61,6% 100,0%
Chi-Square Tests
Value df
Asymp. Sig. (2-sided)
Exact Sig. (2-sided)
Exact Sig. (1-sided)
Pearson Chi-Square 36,832(b) 1 ,000
Continuity
Correction(a) 33,889 1 ,000
Likelihood Ratio 39,533 1 ,000
Fisher's Exact Test ,000 ,000
Linear-by-Linear
Association 36,328 1 ,000
N of Valid Cases 73
a Computed only for a 2x2 table
b 0 cells (,0%) have expected count less than 5. The minimum expected count is 10,74.
Risk Estimate
Value 95% Confidence Interval
Lower Upper Lower
Odds Ratio for
NilaiCURB65 (>2 / <3) 36,800 9,621 140,753 For cohort Outcome1 =
meninggal 7,393 3,178 17,197
For cohort Outcome1 =
tidak meninggal ,201 ,090 ,448
N of Valid Cases 73
Tabel 12. Hubungan Tingkat Kesadaran Dengan Kejadian Mortalitas
Pneumonia Komunitas
Case Processing Summary
Cases
Valid Missing Total
N Percent N Percent N Percent
Tingkatkesadaran1 *
Outcome1 73 100,0% 0 ,0% 73 100,0%
Chi-Square Tests
Value df
Asymp. Sig. (2-sided)
Exact Sig. (2-sided)
Exact Sig. (1-sided)
Pearson Chi-Square 25,796(b) 1 ,000
Continuity
Correction(a) 23,343 1 ,000
Fisher's Exact Test ,000 ,000 Linear-by-Linear
Association 25,442 1 ,000
N of Valid Cases 73
a Computed only for a 2x2 table
b 0 cells (,0%) have expected count less than 5. The minimum expected count is 10,74. c Based on normal approximation.
Risk Estimate
Value 95% Confidence Interval
Lower Upper Lower
Odds Ratio for Tingkatkesadaran1
(tidak CM / CM) 16,286 5,027 52,757
For cohort Outcome1
= meninggal 4,821 2,362 9,842
For cohort Outcome1
= tidak meninggal ,296 ,154 ,569
N of Valid Cases 73
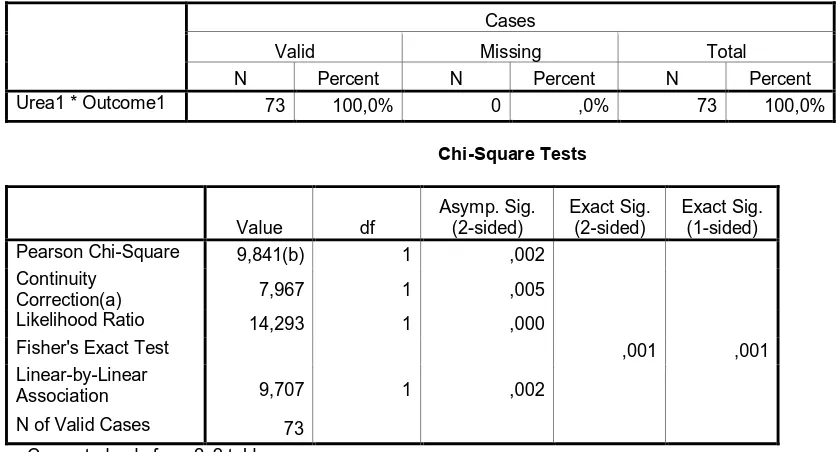
Tabel 13. Hubungan Kadar Urea dengan Kejadian Mortalitas Pneumonia
Komunitas
Case Processing Summary
Cases
Valid Missing Total
N Percent N Percent N Percent
Urea1 * Outcome1 73 100,0% 0 ,0% 73 100,0%
Chi-Square Tests
Value df
Asymp. Sig. (2-sided)
Exact Sig. (2-sided)
Exact Sig. (1-sided)
Pearson Chi-Square 9,841(b) 1 ,002
Continuity
Correction(a) 7,967 1 ,005
Likelihood Ratio 14,293 1 ,000
Fisher's Exact Test ,001 ,001
Linear-by-Linear
Association 9,707 1 ,002
N of Valid Cases 73
a Computed only for a 2x2 table
b 1 cells (25,0%) have expected count less than 5. The minimum expected count is 4,99.
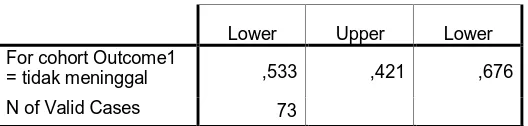
Risk Estimate
Lower Upper Lower For cohort Outcome1
= tidak meninggal ,533 ,421 ,676
N of Valid Cases 73
Tabel 14. Hubungan Frekuensi Nafas dengan Kejadian Mortalitas
Pneumonia Komunitas
Case Processing Summary
Cases
Valid Missing Total
N Percent N Percent N Percent
Freknafas1 * Outcome1 73 100,0% 0 ,0% 73 100,0%
Chi-Square Tests
Value df
Asymp. Sig. (2-sided)
Exact Sig. (2-sided)
Exact Sig. (1-sided)
Pearson Chi-Square 12,916(b) 1 ,000
Continuity
Correction(a) 11,198 1 ,001
Likelihood Ratio 13,032 1 ,000
Fisher's Exact Test ,000 ,000
Linear-by-Linear
Association 12,739 1 ,000
N of Valid Cases 73
a Computed only for a 2x2 table
b 0 cells (,0%) have expected count less than 5. The minimum expected count is 10,74.
Risk Estimate
Value 95% Confidence Interval
Lower Upper Lower
Odds Ratio for
Freknafas1 (> 30x/menit /
< 30x/menit) 6,300 2,216 17,909
For cohort Outcome1 =
meninggal 2,893 1,568 5,337
For cohort Outcome1 =
tidak meninggal ,459 ,273 ,773
N of Valid Cases 73
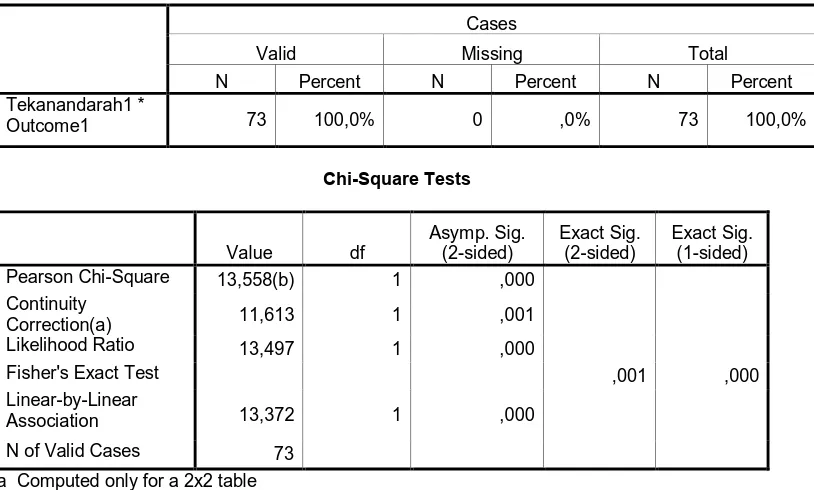
Tabel 15. Hubungan Tekanan Darah dengan Kejadian Mortalitas
Pneumonia Komunitas
Cases
Valid Missing Total
N Percent N Percent N Percent
Tekanandarah1 *
Outcome1 73 100,0% 0 ,0% 73 100,0%
Chi-Square Tests
Value df
Asymp. Sig. (2-sided)
Exact Sig. (2-sided)
Exact Sig. (1-sided)
Pearson Chi-Square 13,558(b) 1 ,000
Continuity
Correction(a) 11,613 1 ,001
Likelihood Ratio 13,497 1 ,000
Fisher's Exact Test ,001 ,000
Linear-by-Linear
Association 13,372 1 ,000
N of Valid Cases 73
a Computed only for a 2x2 table
b 0 cells (,0%) have expected count less than 5. The minimum expected count is 7,29.
Risk Estimate
Value 95% Confidence Interval
Lower Upper Lower
Odds Ratio for Tekanandarah1 (tidak
normal / normal) 8,000 2,437 26,264
For cohort Outcome1 =
meninggal 2,842 1,682 4,804
For cohort Outcome1 =
tidak meninggal ,355 ,165 ,766
N of Valid Cases 73
Tabel 16. Hubungan Usia dengan Kejadian Mortalitas Pneumonia
Komunitas
Case Processing Summary
Cases
Valid Missing Total
N Percent N Percent N Percent
Usia1 * Outcome1 73 100,0% 0 ,0% 73 100,0%
Value df
Asymp. Sig. (2-sided)
Exact Sig. (2-sided)
Exact Sig. (1-sided)
Pearson Chi-Square ,032(b) 1 ,859
Continuity
Correction(a) ,000 1 1,000
Likelihood Ratio ,032 1 ,859
Fisher's Exact Test 1,000 ,531
Linear-by-Linear
Association ,031 1 ,860
N of Valid Cases 73
a Computed only for a 2x2 table
b 0 cells (,0%) have expected count less than 5. The minimum expected count is 10,36.
Risk Estimate
Value 95% Confidence Interval
Lower Upper Lower
Odds Ratio for Usia1 (>
65 tahun / < 65 tahun) ,915 ,343 2,438 For cohort Outcome1 =
meninggal ,947 ,514 1,742
For cohort Outcome1 =
tidak meninggal 1,034 ,714 1,498