Estimation of heat and momentum fluxes over complex
terrain using a large aperture scintillometer
A. Chehbouni
a,∗, C. Watts
a, J.-P. Lagouarde
b, Y.H. Kerr
b, J.-C. Rodriguez
a,
J.-M. Bonnefond
b, F. Santiago
a, G. Dedieu
c, D.C. Goodrich
d, C. Unkrich
daIRD/IMADES, Reyes and Aguascalientes Esq., Col San Benito, Hermosillo, CP 83190, Sonora, Mexico bINRA-Bioclimatologie, Bordeaux, France
cCESBIO, Toulouse, France dUSDA-ARS, Tucson, AZ, USA
Abstract
A comprehensive experimental plan has been designed to further investigate the potential and the limitations associated with the use of a large aperture scintillometer (LAS) to infer path average sensible and momentum fluxes over complex surfaces as part of the Semi-Arid Land–Surface–Atmosphere (SALSA) Program. The complexity of the terrain is associated with the type and the cover of the vegetation canopy as well as with changes in topography. Scintillometer based estimates of sensible heat flux and friction velocity are compared to those measured by eddy correlation systems over a grassland patch, a mesquite patch, and over a transect spanning both patches. The results show that considering the complexity of the surface, the overall performance of the scintillometer is relatively good. © 2000 Elsevier Science B.V. All rights reserved.
Keywords: Area-average sensible heat flux; Effective parameters; Scintillometer; Eddy covariance
1. Introduction
The impact of spatial variation in surfaces fluxes on regional scale atmospheric flow and potential feed back to land-surface processes has been a ma-jor issue in the scientific community during the past two decades. This has been translated into the co-ordination, under the umbrella of international pro-grams such as GEWEX, BAHC, and ISLSCP, of several large-scale multidisciplinary field experiments (LSMFE) at different sites all over the world. All these experiments involved measurements of water, heat,
∗Corresponding author. Permanent address: CESBIO
(CNES-CNRS-IRD-UPS), 18 Avenue Edouard Belin, 13401, Toulouse 4, France. Fax:+33-5-61-55-85-01.
E-mail address: [email protected] (A. Chehbouni).
and momentum fluxes at the land surface atmosphere interface, through a network of point-sampling mea-surement devices using Bowen ratio or eddy correla-tion techniques. In addicorrela-tion to these point-sampling measurements, some of these LSMFEs also involved methods to measure the spatial variation of turbu-lent surface flux using aircraft and LIDAR (FIFE, HAPEX-MOBILHY, HAPEX-Sahel, and SALSA). However, due to their high price and the require-ment for continuous availability of well-trained staff to operate and maintain them, these devices might not be the best choice to fulfill the much-needed long-term measurements of surface fluxes to validate large-scale hydro-atmospheric models. It is therefore important to seek alternative approaches that allow for low-cost and low-maintenance observations of surface fluxes.
Several studies carried out in the past decade have revealed that the scintillation method is a promising approach for routine observations of surface convec-tive fluxes over path lengths of several kilometers (Kohsiek, 1985, 1987; De Bruin et al., 1995; McAneney et al., 1995; Green et al., 1994; Lagouarde et al., 1996; Hartogensis, 1997; Chehbouni et al., 1999). It is not our aim in this paper to provide a detailed overview of this technique, this has been done elsewhere. For detailed information, the reader can refer to a comprehensive review by Hill (1992). Briefly, the principle of the scintillometer consists of transmitting a beam of electromagnetic radiation and measuring the intensity variations of the received sig-nal. This leads to a direct measure of the strength of the refractive index of the air and then to the structure parameter for the refractive index (Cn2), which can then be related to the structure function parameter of temperature (CT2) to derive sensible heat flux.
The objective of this study is to use a large aper-ture scintillometer (LAS) to estimate area-averaged sensible heat flux and friction velocity over complex surfaces. The complexity of the surface is due to het-erogeneity of vegetation type and cover as well as to variability of surface topography. Scintillometer-based sensible heat flux values are compared to those mea-sured using eddy correlation techniques during the 1998 SALSA campaign in Mexico. This paper is organized as follows: in Section 2, we present the basic equations and hypotheses that allow estimation of sensible heat flux and friction velocity from re-fractive index of the air; in Section 3, we describe the experimental design; in Section 4, we present a comparison of sensible heat flux and friction velocity measured by eddy correlation to that derived from the scintillometer. Then, we conclude by discussing the potential and the limitations of the scintillometer technique over complex terrain.
2. Physical background
Based on Tatarskii’s (1961) theory, Clifford et al. (1974) showed that, for a LAS, the variance of the natural logarithm of the irradiance I incident at the receiver is
σln2(I )=[ln(I )−ln(I )]2=
Z 1
0
Cn2(u)W (u)du (1)
where the overbar represents a spatial average, W(u) is a spatial weighing function, given by
W (u)=16π2k2L
whereu = x/Lis the normalized pathlength; L the pathlength;k=2π/λthe optical wave number; x = 1
2KDu, where is D the receiver/transmitter aperture; K is the three-dimensional spatial wave number; J1is a Bessel function of the first kind of order one; and Φn, the three-dimensional Kolmogorov spectrum of the refractive index describes the turbulent medium in terms of its Fourier components K
Φn(K)=0.033Cn2K−11/3 (3) After integrating Eq. (2), and using Eqs. (1) and (3),Cn2 can be obtained as a linear function ofσln2(I ), measured by the scintillometer as
Cn2=Cσln2(I )D7/3L−3 (4) where C = 1.12 for Cn2 ranges from 10−17 to 10−12m−2/3.
The spatially averaged refractive index structure pa-rameter obtained by the scintillometer (Cn2) is related to the temperature structure parameter (CT2) as
CT2 =Cn2
whereβ is the Bowen ratio which is incorporated as a humidity correction such thatCT2 decreases with in-creasing evaporation rate. The study by De Wekker (1996) showed that this term can be safely neglected whenever the Bowen ratio is greater than 0.6, which is generally the case over most natural surfaces in arid and semi-arid areas. The sensible heat and momen-tum fluxes together determine atmospheric stability, and this in turn influences turbulent transport, thus an iterative procedure is needed to calculate sensible heat flux from the scintillometer measurement (Lagouarde et al., 1996), as follows.
We first define the dimensionless temperature scale T∗ as
T∗= H ρcpu∗
whereρis the density of the air, cpthe heat capacity at constant pressure, and u∗the friction velocity given from
u∗= ku
ln(z−d/zo)−Ψm(zo/Lmon)
(7)
where z is the measurement height, zo the roughness length, d the displacement height,ψm the integrated stability function, and Lmon the Monin–Obukhov length defined as
Lmon = Tu∗2
kgT∗ (8)
Under unstable conditions, De Bruin et al. (1993, 1996) found that the temperature structure parameter CT2 andT∗2 are related by
Sensible heat flux can then be derived using Eqs. (5)–(9) via a simple iterative procedure.
This approach has been successfully tested over homogeneous and flat terrains where the needed roughness length and displacement height can be easily estimated using a rule of thumb assumption. The case of heterogeneous surfaces requires an ap-propriate method to estimate their effective values. Additional difficulty appears if the surface presents heterogeneity in topography. As shown in Eq. (9), T∗2 scales as z2/3, therefore the scintillometer height needs to be accurately estimated (see below).
3. Experimental design
3.1. Site description
This study was conducted in the Mexican portion of the Upper San Pedro Basin (USPB) as part of the SALSA Program (Goodrich et al., 1998). Unlike the American part of the basin, a large portion of the Mex-ican part is still covered by native grassland. However, the land in Mexico is experiencing the same degra-dation processes that took place in the United States a century ago. Using historical LANDSAT multi-spectral images, Kepner et al. (2000) showed that grassland and desertscrub covered areas are very
vulnerable to encroachment of woody shrubs, i.e., Mesquite. This study reveals that the grassland ar-eas have significantly decrar-eased. In this context, the objective of the investigation in the Mexican part of the basin is to better understand ecosystem function, and document the impact of land degradation on surface–atmosphere interactions and the hydrological cycle. Two main sites representing two extreme stages of degradation were heavily instrumented: healthy grassland, representing a pre-degradation situation (Zapata 1) and a mesquite site representing the ul-timate stage of degradation. Besides these two main sites, two additional sub-sites were also instrumented for a short period: another healthy grassland at the beginning of 1998 season (Zapata 2) and a degraded grassland site toward the end of the growing season (see Fig. 1 for a location map).
3.2. Instrumentation
In this specific study, data over the mesquite and the degraded grassland sites are used. The Mesquite (Prosopis velutina) site is situated within the Morelos ranch about 5 km west of Zapata village. The average surface cover of the mesquite was about 30% and the average mesquite height was about 4.2 m. A 12 m meteorological tower equipped with a set of standard meteorological instruments to measure the air tem-perature, relative humidity, incoming solar radiation, wind speed, wind direction, and precipitation was set up. These standard meteorological measurements were sampled every 10 s and an average measure-ment recorded every 30 min. Net radiation (Q-7), outgoing short wave (Kipp), and surface temperature (Everest-IRT) were measured separately over bare soil and over the vegetation. Soil heat flux was mea-sured using six HFT3 plates (REBS, WA, USA), soil temperature and soil moisture were measured at dif-ferent depths using six 108 temperature probes and six CS600 TDR (time domain reflectometer) probes, respectively (Campbell Scientific, USA). Sensible, latent, and momentum fluxes were measured using a 3D sonic anemometer, a fast response (fine wire) ther-mocouple and a fast response hygrometer (Campbell Scientific, USA).
Fig. 1. Location map showing the different instrumented sites in the Mexican part of the San Pedro Basin.
height was about 0.25 m and the Leaf Area Index was approximately 0.3 (Chehbouni et al., this issue). A 3-m tower equipped with standard meteorologi-cal sensors was erected over this land cover. These included measurements of incoming and net radia-tion, air temperature and humidity, wind speed and direction, and surface temperature. Additionally, soil moisture and temperature, and soil heat flux were measured at different depths. The sensible heat flux was measured using a 3D sonic anemometer (Ap-plied Technology, USA). The sonic data were then post-processed using a procedure developed in the context of the EURO-FLUX consortium (means and second moments were computed and coordinate rota-tion was performed). At the end of the experiment, an inter-comparison over a homogeneous grassland site was made between this sonic anemometer and the one
used over the mesquite has been made (Chehbouni et al., 2000).
The LASs used in this study were built at the De-partment of Meteorology of the Wageningen Agricul-tural University (WAU). The basic design is described in Ochs and Wilson (1993), but the WAU has improved the electronics. The LAS has an aperture size of 0.15 m and the light source is a light emitting diode (LED: TIES-16A, Texas Instruments, Texas, USA) operating at a peak wavelength of 0.94mm, which is placed at
and emitter housings. The receiver electronics have been designed in such a way that after setting the path length, the output voltage can be used to estimateCn2 usingCn2=10(Vout−12), where V
outis the output volt-age of the scintillometer (using Eq. (4)). 15 min val-ues of the scintillometer output (Vout) were stored on a data logger. After downloading of these data, 30 min averages were computed to allow direct comparison with sonic anemometer data.
The three scintillometers were first inter-calibrated over a grassland site: Zapata 2 (Lagouarde et al., 2000). The original experimental plan was to deploy the first scintillometer over the degraded grassland site, the second over the adjacent mesquite site, and the third over a transect spanning both sites. However, due to the failure of one scintillometer, this original design had to be modified and one scintillometer was deployed over the entire transect from day of the year (DOY) 265 to 277. The receiver was installed on the meteorological tower in the mesquite site at a height of 8.73 m above the ground. The transmit-ter was installed on a tower at a height of 3.47 m above the ground at the other end of the transect. The total pathlength was of 1829 m made up of about 55% mesquite and 45% grass. The second scintil-lometer was installed alternatively over the grass and over the mesquite. When deployed over the mesquite (DOY 265–274), the transmitter was installed on the meteorological tower at a height of 9.61 m and the receiver was installed on another tower situated at the
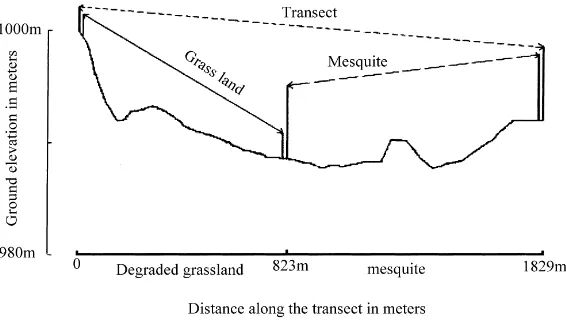
Fig. 2. Ground elevation and scintillometer transmitter/receiver heights along the transect spanning the degraded grass and the mesquite patches.
transition of mesquite/grass zone about 1 km apart at a height of 9.41 m. When deployed over the grass (DOY 274–277), the transmitter was installed at the transition of the mesquite/grass zone on a tower at a height of 3.47 m and the receiver was installed about 826 m apart at a height of 3.41 m. In Fig. 2, the posi-tion of the scintillometer towers along with the spatial variation of the surface across the entire transect is presented.
4. Results
4.1. Estimation of effective scintillometer height
For practical reasons, the transmitter and the receiver were not at the same height for all three se-tups. This means that the height of the scintillometer beam above the surface varies along the path. Conse-quently,Cn2, and thereforeCT2 are not only averaged horizontally but vertically as well. In this study a heuristic approach (method 1) has been used to de-rive an effective scintillometer height. It consists of assuming that sensible heat flux can be formulated us-ing the free convection formula and is constant in the surface layer. In this case,Cn2as well asCT2 scale as (z−d)−4/3(Hartogensis, 1997). This leads to the fol-lowing equation, which can be numerically integrated to derive the effective scintillometer height:
hz−di−4/3=
Z 1
0
(zu−du)−4/3W (u)du (10) where zu is the difference between the elevation of the scintillometer beam and the ground surface and du is the displacement height both defined at the normalized pathlength u.
In the case of a homogeneous vegetation type, d and zo are obtained as fractions of vegetation height using rule of thumb assumptions. Over heterogeneous surfaces (i.e., transect of two patches), effective dis-placement height and effective roughness length are
Fig. 3. Comparison between scintillometer-based and eddy correlation-based momentum flux over the degraded grassland patch. obtained following Shuttleworth et al. (1997) and Chehbouni et al. (1999) as
d=X i
widi and ln−2
z
b−d zo
=X i
wiln−2
z
b−di zoi
(11)
wherezoi and di are the patch scale roughness length and displacement height, respectively, which, wiis the fraction of the surface covered by the patch i, and zbis the blending height which is expressed as a function of the friction velocity, wind speed, and horizontal length scale (Wieringa, 1986).
4.2. Validation and discussion
4.2.1. Validation over individual patches
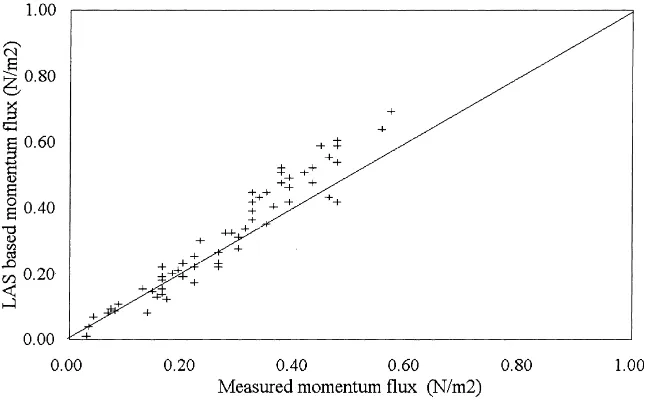
Fig. 4. Comparison between scintillometer-based and eddy correlation-based momentum flux over the mesquite patch.
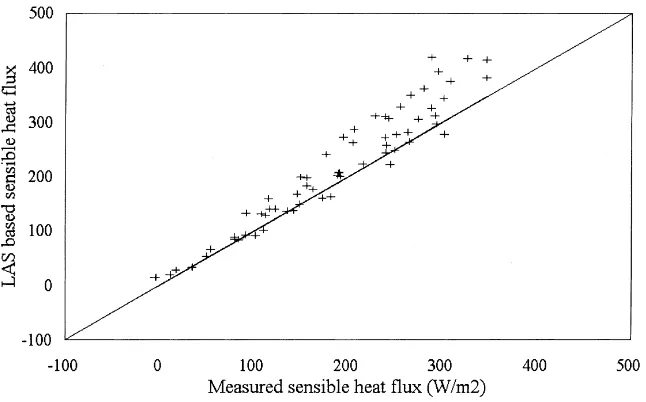
(1.35) and R2 of 0.93 (0.89) and a standard error of 0.05 (0.09) N m−2 for the grass patch (mesquite patch). The corresponding sensible heat flux compar-isons are presented in Fig. 5 for the degraded grassland
Fig. 6. Comparison between scintillometer-based and eddy correlation-based sensible heat flux over the mesquite patch.
estimates of sensible heat flux were 30 W m−2 over the grass and 40 W m−2 over the mesquite, respec-tively. The overestimation of both τ and H can be explained by several factors. First, the cup anemome-ters are known to overestimate wind speed, and there-fore the simulated τ and H might be overestimated (Hill et al., 1991). Second, data in this comparison represent all wind directions including some periods, though not very often, when the wind blew down the scintillometer path. Third, the large difference in the elevation-height between the receiver and the trans-mitter on each patch may affect the representativeness of wind speed and air temperature estimates made over the corresponding eddy correlation tower. Despite the visual impression of homogeneity, field survey indi-cated that there was a patch of bare soil loindi-cated far enough from the micrometeorological tower so that it contributes less to the eddy correlation measurements than to the scintillometer measurements. Similarly, the mesquite height and cover was less important toward the grass–mesquite transition zone, therefore, the av-erage vegetation height, from which roughness length and displacement height are computed, may not be representative of the entire scintillometer path. More
importantly, the specific area of the surface to which the eddy covariance flux corresponds expands or con-tracts, elongates or widens with different conditions of stability and wind speed, while the weighting func-tion of the LAS do not vary with wind speed and direction (Eq. (2)).
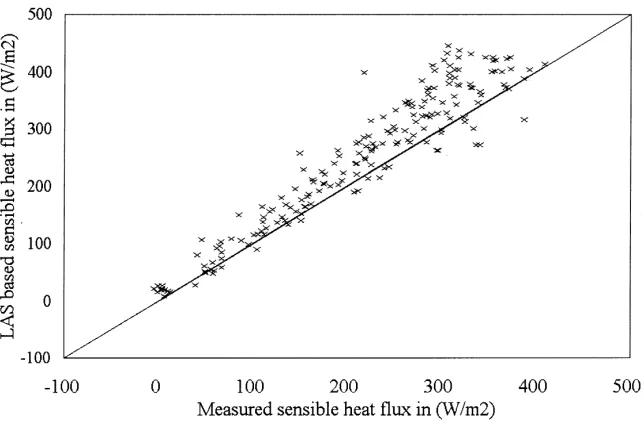
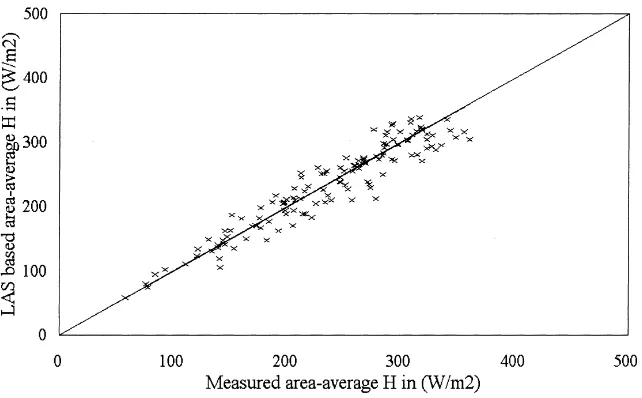
4.2.2. Validation over the transect
Eddy correlation-based values of area-average sen-sible heat and momentum fluxes (H and τ) were obtained by weighting the measurements of sensible heat flux and momentum flux made over the grass and over the mesquite by the scintillometer spatial weighing function W(u). Comparison between scin-tillometer and eddy correlation-based estimates of area-average momentum flux is presented in Fig. 7. The corresponding comparison of area-average sensi-ble heat flux values is presented in Fig. 8. The RMSE between observed and simulated values was about 21 W m−2for the area-average sensible heat flux and 0.04 N m−2for area-averageτ.
Fig. 7. Comparison between scintillometer-based and eddy correlation-based area-average momentum flux (transect).
behavior can be explained by two reasons. Measure-ments of sensible heat flux and momentum flux over each patch were weighted according to the scintil-lometer spatial response function. This certainly im-proves the spatial correspondence between the LAS
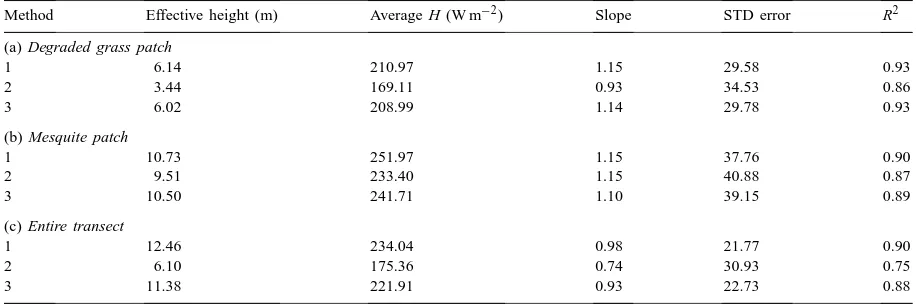
Table 1
Effective scintillometer height, the corresponding time average of sensible heat flux and the result of the linear regression between measured and simulated heat flux values associated with each method
Method Effective height (m) Average H (W m−2) Slope STD error R2
(a) Degraded grass patch
1 6.14 210.97 1.15 29.58 0.93
2 3.44 169.11 0.93 34.53 0.86
3 6.02 208.99 1.14 29.78 0.93
(b) Mesquite patch
1 10.73 251.97 1.15 37.76 0.90
2 9.51 233.40 1.15 40.88 0.87
3 10.50 241.71 1.10 39.15 0.89
(c) Entire transect
1 12.46 234.04 0.98 21.77 0.90
2 6.10 175.36 0.74 30.93 0.75
3 11.38 221.91 0.93 22.73 0.88
height of the scintillometer beam along the path. This situation might not be appropriate for the application of Monin–Obukhov similarity theory.
In order to investigate the sensitivity to the value of the effective scintillometer height, sensible heat flux estimated using the method described above (method 1) are compared to those obtained using two other methods. The second method (method 2) consists of ignoring the topographic variation of the terrain to derive an effective scintillometer height as the av-erage of the receiver and the scintillometer heights. The third method (method 3) consists of deriving an effective height from a line average of (z−d). In Table 1a, 1b and 1c we present the values of effective scintillometer height associated with each method, the corresponding time average value of sensible heat flux as well as the result of the linear regression be-tween measured and simulated heat flux values over the degraded grass patch, the mesquite patch and for the entire transect, respectively are present. This table confirms that the average scintillometer-based values of sensible heat flux increase significantly with the height. It also implies that over complex terrains, the scintillometer height as well as the topographic varia-tion along the scintillometer path must be accurately estimated.
It is also important to emphasize that over heteroge-neous surfaces, one must seriously consider the issue of sampling and scale when validating scintillometer measurements. In addition to the classical W(u) func-tion, the weighing should, in principle, also include a
dependence on wind speed and wind direction. In fact there is a need for a two-dimensional, time depen-dant weighing function which takes into account the spatial and temporal variations of the relative contri-bution of individual patches (here grass and mesquite) to the scintillometer measurements. However, the use of such complex procedure may not be very useful in this particular study since the wind direction was constantly blowing across the scintillometer path. The size of individual patches (1 km×1 km for the grass and for the mesquite) and the setup leads to large fetches. Additionally, the scintillometer pathlength was large (about 2 km) and consisted of about equal proportion of grass and mesquite.
5. Conclusions
mea-surements for the determination of the turbulent fluxes of heat and momentum over heterogeneous surfaces. Scintillation techniques have several advantages over in situ techniques. Scintillation is generally not very sensitive to turbulence in the immediate vicinity of the transmitter or receiver. Therefore measurements can be made with minimal disruption by the instru-ment. More importantly, scintillation measurements inherently represent an average over the path. This reduces the question of representativeness of in situ measurements. Furthermore, scintillation measure-ments are ideal for long-term monitory over spatial scales relevant to atmospheric models and remote sensing observations. However, additional investi-gations are needed to understand the scintillometer measurements over transect of small surfaces where the sign of the heat flux changes along the scintil-lometer path. In this case, one has to be very careful in interpreting the scintillometer measurements. This will required a detailed footprint analysis (Schmid and Lloyd, 1999) and a two-dimensional, time depen-dant weighing function which takes into account the spatial and temporal variations of the relative areas contributing to the scintillometer signal.
Acknowledgements
We acknowledge financial support from IRD, CONACyT, the French Remote Sensing Program: PNTS, and the European Commission through VEG-ETATION projects. This research is situated within the framework of NASA Mission to Planet Earth (MTPE): NASA/EOS grant NAGW2425. Addi-tional support was also provided by the USDA-ARS Global Change Research Program and NASA grant W-18-1997. The assistance of P. Cayrol, G. Boulet, and Mario Garcia during the course of the field ex-periment is gratefully acknowledged. Many thanks to Drs. J.W. Shuttleworth and H.A.R. De bruin for their helpful comments on the manuscript.
References
Chehbouni, A., Kerr, Y.H., Watts, C., Hartogensis, O., Goodrich, D.C., Scott, R., Schieldge, J., Lee, K., Shuttleworth, W.J., Dedieu, G., De Bruin, H.A.R., 1999. Estimation of area-average
sensible heat flux using a large aperture scintillometer. Water Resour. Res. 35 (8), 2505–2512.
Chehbouni, A., Watts, C., Kerr, Y.H., Dedieu, G., Rodriguez, J.-C., Santiago, F., Cayrol, P., Boulet, G., Goodrich, D.C., 2000. Methods to aggregate turbulent fluxes over heterogeneous surfaces: application to SALSA data set in Mexico, Agric. For. Meteorol. 105, 133–144.
Clifford, S.F., Ochs, G.R., Lawrence, R.S., 1974. Saturation of optical scintillation of strong turbulence. J. Opt. Soc. Am. 64, 148–154.
De Bruin, H.A.R., Kohsiek, W., van den Hurk, B.J.J.M., 1993. A verification of some methods to determine the fluxes of momen-tum, sensible heat, and water vapor using standard deviation and structure parameter of scalar meteorological quantities. Boundary-Layer Meteorol. 63, 231–257.
De Bruin, H.A.R., van den Hurk, B.J.J.M., Kohsiek, W., 1995. The scintillation method tested over a dry vineyard area. Boundary-Layer Meteorol. 76, 25–40.
De Bruin, H.A.R., Nieveen, J.P., de Wekker, S.F.J., Heusinkveld, B.G., 1996. Large aperture scintillometry over a 4.8 km path for measuring areally-average sensible heatflux. In: Proceedings of the 22nd AMS Symposium on Agricultural and Forest Meteorology, 28 January–2 February, Atlanta, GA, USA. De Wekker, S.F.J., 1996. The estimation of areally-averaged
sensible heat fluxes over complex terrain with a Large-Aperture Scintillometer. M.S. Thesis. Department of Meteorology, Wageningen Agricultural University, 42 pp.
Goodrich, D.C., Chehbouni A., et al., 1998. An overview of the 1998 activities of the Semi-Arid Land-Surface Program. In: Proceeding of the 1998 American Meteorological Society Meeting, January 1998, Pheonix, AZ, pp. 1–7.
Green, A.E., McAneney, K.J., Astill, M.S., 1994. Surface-layer scintillation measurements of daytime sensible and momentum fluxes. Boundary-Layer Meteorol. 68, 357–373.
Hartogensis, O., 1997. Measuring areally-averaged sensible heat fluxes with a Large Aperture Scintillometer. M.S. Thesis. Department of Meteorology, Agricultural University of Wage-ningen, Netherlands.
Hill, R.J., 1992. Review of optical scintillation methods of measuring the refractive-index spectrum, inner scale and surface fluxes. Waves Random Media 2, 179–201.
Hill, R.J., Ochs, F.R., Wilson, J.J., 1991. Measuring surface-layer fluxes of heat and momentum using optical scintillation. Boundary-Layer Meteorol. 58, 391–408.
Kepner, W.G., Watts, C., Edmonds, C.M., Van Remortel, R.D., Hamilton, M.E., 2000. A Landscape approach for detecting and evaluating change in a semi-arid environment. J. Environ. Monitor. Assess., in press.
Kohsiek, W., 1985. A comparison between line-averaged obser-vations of Cn2 from scintillation of a CO2 laser beam and
time averaged in situ observations. J. Clim. Appl. Meterol. 24, 1099–1102.
Kohsiek, W., 1987. A 15 cm aperture LED scintillometer forCn2 and crosswind measurements. KNMI Scientific Reports WR 87-3.
In: Stewart, J.B., Engman, E.T., Feddes, R.A., Kerr, Y. (Eds.), Scaling Up in Hydrology Using Remote Sensing, Wiley, Chichester, pp. 147–160.
Lagouarde, J.-P., Chehbouni, A., Bonnefond, J.-M., Rodriguez, J.-C., Kerr, Y.H., Watts, C., Irvine, M., 2000. Analysis of the limits of theC2T-profile method for sensible heat flux measu-rements. Agric. For. Meteorol. 105, 195–214.
McAneney, K.J., Green, A.E., Astill, M.S., 1995. Large aperture scintillometry: the homogenous case. Agric. For. Meteorol. 76, 149–162.
Ochs, G.R., Wilson, J.J., 1993. A second-generation large-aperture scintillometer, NOAA Tech. Memo, ERL WPL-232. NOAA Environmental Research Laboratories, Boulder, Co.
Raupach, M.R., Weng, W.S., Carruthers, D.J., Hunt, J.C.R., 1987. Temperature and humidity fields and fluxes over low hills. Q.J.R. Meteorol. Soc. 118, 191–225.
Schmid, B., Lloyd, C.R., 1999. Spatial representativeness and the location bias of flux footprints over inhomogeneous areas. Agric. For. Meteorol. 93, 195–209.
Shuttleworth, W.J., Yang, Z.-L., Arain, M.A., 1997. Aggregation rules for surface parameters in global models. Hydrol. Earth Syst. Sci. 1, 217–226.
Tatarskii, V.I., 1961. Wave Propagation in a Turbulent Medium. McGraw-Hill, New York, 285 pp.