Indo. J. Chem., 2005, 5 (1), 54 - 57
Sutopo Hadi & Trevor G. Appleton
54
* Corresponding author.
Email address : [email protected]
STUDY OF REACTION OF
TRANS
-[Pt(
15NH
3)
2(H
2O)
2]
2+WITH N-ACETYL-L-CYSTEINE
Sutopo Hadi
a,* and Trevor G. Appleton
ba
Department of Chemistry, University of Lampung Jl. S. Brojonegoro No. 1 Bandar Lampung 35145 b
Centre for Metals in Biology, Department of Chemistry, University of Queensland Brisbane QLD 4072, Australia
Received 10 November 2004; Accepted 18 December 2004
ABSTRACT
A study of the reaction between trans-[Pt(15NH3)2(H2O)2](NO3)2 and N-acetyl-L-cysteine (H3accys)
was undertaken to confirm the identity of the products formed. In alkaline solution, the platinum products observed were mononuclear species, while in acidic solution, the oligomeric products were obtained. The mass spectrometry of the reaction in alkaline solution showed a sulfur-bridged dinuclear platinum(II)
species, trans-[{Pt(H2accys-S)2(
15
NH3)2}2((-H2accys-S)] +
giving m/z 948 and the lost of two ammines was observed.
Keywords: thiolate, oligomers, 2D NMR, mass spectrometry
INTRODUCTION
Although the chemistry of cisplatin interacting with thiol (-SH) groups has been extensively studied [1-4], the corresponding reactions of the trans analogue on the other hand are relatively unexplored due to the lack of antitumour activity of trans-diammineplatinum(II) complexes [5, 6].
The reaction of platinum(II) complexes with sulfur-containing ligands is of interest as it is believed that before reaching the DNA, the platinum(II) complexes bind first to the constituents of cells containing sulfur donor [7-12].
Lempers et al. [13, 14] have shown that in the reaction of [PtCl(dien)]+ with glutathione, a sulfur donor, the products obtained depended on the pH. At pH < 7, the favoured coordinating mode of the thiol group was to bridge two platinum centers, whereas at pH > 7 mononuclear species were preferred. At pH < 7, the thiol group is still protonated, so it is not readily available for coordination. A thiol already coordinated to the metal is still a good nucleophile, and therefore at lower pH a second metal will preferentially bind with this coordinated thiol, forming a bridged species. At high pH a greater percentage of the free thiol is deprotonated and the preferred binding mode is non-bridging.
Appleton et al. [1] have shown that when cis-[Pt(15NH3)2(H2O)2]2+ reacts with thiols at low pH, the
preferred products involved sulfur bridges at the concentration of platinum complex ~0.1 M, thiolate tends to bridge more in acidic condition than in basic condition. This observation is also useful in characterizing the products obtained from the reactions carried out in this study.
EXPERIMENTAL SECTION
Starting Materials
Trans-[Pt(15NH3)2(NO3)2] was prepared based
on the procedure as previously described [15]. N-acetyl-L-cysteine (H3accys) was used as supplied by
Sigma – Aldrich Chemical Company without further purification. 15NH4)2SO4 (99% 15N, Cambridge
Isotopes) was supplied by Novachem, Melbourne, Australia.
Preparation of trans-[Pt(15NH3)2(H2O)2](NO3)2 (1)
Trans-[Pt(15NH3)2(NO3)2] was converted to
trans-[Pt(15NH3)2(H2O)2](NO3)2 in aqueous solution
with the following procedure. A certain amount of
trans-[Pt(15NH3)2(NO3)2] (based on the concentration
desired, normally either 5 mM or 10 mM) was weighed out, then it is dissolved by warming in 2 mL of water (normally about 30 minutes were required). Nitric acid 0.1 M was added to adjust the pH. Any solid remaining was removed by gravity filtration to give a solution containing trans-[Pt(15NH3)2(H2O)2](NO3)2 (1) which was then
Indo. J. Chem., 2005, 5 (1), 54 - 57
Sutopo Hadi & Trevor G. Appleton
55
Reaction of trans-[Pt(15NH3)2(H2O)2](NO3)2 (1)
with N-acetyl-L-cysteine (H3accys)
This reaction was monitored with 2D [1H, 15N] HSQC NMR. The following procedure was used : To a small bottle containing solid of H3accys (0.163
mg, 1 mmol) was added 0.5 mL of trans-[Pt(15NH3)2(H2O)2](NO3)2 (1) 1 mM (0.5 mmol). The
pH was adjusted to ~2.0 under argon gas. The solution was immediately transferred to a 5-mm NMR tube, then placed in the AV400 NMR spectrometer which has been tuned for 15N NMR and accumulation 2D [1H, 15N] HSQC NMR spectrum was commenced. The spectrum was monitored periodically. 30 hours after the initial mixing, the pH was adjusted to > 7 and the spectrum was again monitored.
The reaction was also carried out at the same way as with the initial pH of the solution of > 7.
NMR Spectra
The 1D 40.54 MHz 15N NMR spectra were recorded using DEPT pulse sequence [16] to increase the sensitivity in a Bruker Avance 400 MHz spectrometer with a 5 mm broadband multinuclear probe. The number of scans used to
R
and acidic conditions
obtain spectra was normally 250 - 500. A recycle time of 3.54 s was used with pulse width of 12.55 µs (tilt angle of 45o). The number of data points used was 32 K. Chemical shifts are reported relative to 2.5 M (15NH4)2SO4 in 1 M H2SO4 (δN = 0.00) in
coaxial capillary.
The 2D [1H, 15N] heteronuclear single-quantum coherence (HSQC) NMR spectra were recorded on a Bruker Avance 400 MHz spectrometer (1H, 400.1 MHz; 15N, 40.54 MHz) using the sequence of Stonehouse et al. [17].
Electrospray Mass spectrometry
The following method was used to prepare sample for ES-MS. To a small bottle containing H3accys (0.816 mg, 5 mmol) was added 0.5 mL of
solution (1) 5 mM (2.5 mmol) and pH was adjusted to ~2.0 under argon gas. The bottle was then sealed with parafilm to minimise the oxidation of H3accys.
The mole ratio of H3accys and Platinum complex
was 2 :1. The reaction mixture was left for 45 minutes to 1 hour then electrospray ionization mass spectrometry (ES-MS) was undertaken.
RESULTS AND DISCUSSION
The reaction of (1) with H3accys was followed
by 2D [1H, 15N] NMR with the initial concentration of (1) was 1 mM. The mole ratio used in this reaction any condition was 1 : 2 platinum complex to H3accys. The reactions occurred both in acidic and
alkaline solutions are shown in Fig 1.
The reaction was carried out initially at higher pH (pH > 7). In this reaction, apart from a peak due
to trans-[Pt(OH)2(
15
NH3)2] (2) (δN/δH –62.57/3.66
ppm), two new peaks were present in the 2D NMR spectrum (Fig 2), labelled as A (δN/δH –59.24/3.76
ppm) and B (δN/δH –63.42/3.46 ppm). Peak B was
slightly more intense than A and did not change with time.
As thiolate bridging is not enhanced at higher pH [1, 13, 14], these two peaks were assigned to
trans-[Pt(OH)(H2accys-S)(15NH3)2] (3) and
trans-[Pt(H2accys-S)2(15NH3)2] (4), respectively. This can
Indo. J. Chem., 2005, 5 (1), 54 - 57
Sutopo Hadi & Trevor G. Appleton
56
Figure 2 2D [1H, 15N] HSQC NMR spectrum of obtained from the reaction of 1 mM (1) and H3accys in 1:2 mol ratio at the pH ~9, 1 hour after
the reaction commenced
Figure 3 2D [1H, 15N] HSQC NMR spectrum of obtained from the reaction of 1 mM (1) and H3accys in 1:2 mol ratio at pH ~2, 30 hours after the reaction commenced.
were present in the 2D NMR spectrum, a similar observation as in acidic condition as discussed in the next paragraph.
Then the reaction between trans-[Pt(15NH3)2(H2O)2]2+ (1) and H3accys was carried
out in acidic solution (pH ~2). 1 hour after mixing, apart from the peak from starting material (1) (δN/δH
–62.38/4.07 ppm) four major peaks were present in the 2D NMR spectrum. They are labelled as C (δN/δH –55.54/4.17 ppm), D (δN/δH –55.91/4.12
ppm), E (δN/δH –60.22/3.78 ppm) and F (δN/δH –
59.53/3.73ppm). This spectrum did not change significantly for a further 30 hours (Fig 3) and was
Figure 4 2D [1H, 15N] HSQC NMR spectrum of obtained from the reaction of 1 mM (1) and H3accys in 1:2 mol ratio at initially pH ~2, then the pH was adjusted to ~7, 32 hours after the reaction commenced.
similar to the spectrum described above, from the solution which was initially alkaline, then acidified. When the pH of this solution mixture was increased to about 7, all these peaks disappeared and two peaks appeared in the 2D NMR spectrum corresponding to those labeled A and B from reaction at higher pH (Fig 4).
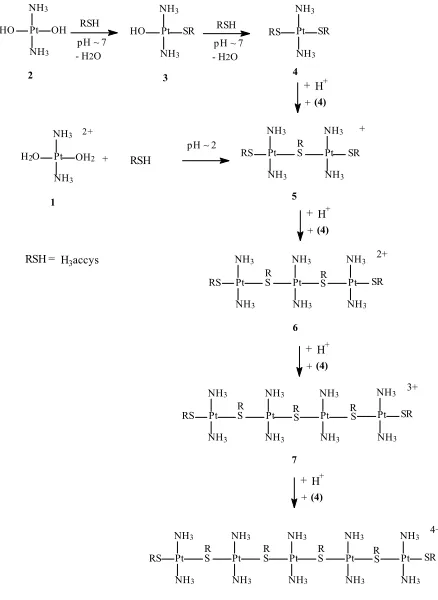
The peaks observed from the reaction of (1) at lower pH are assigned to sulfur-bridged complexes. The formation of dinuclear, trinuclear, tetranuclear and pentanuclear platinum complexes would be possible in this reaction.
If the dinuclear platinum complex (5) is formed, in the 2D NMR, it would give rise to a single peak at the region near δN/δH –60/3.7 ppm, the region for
terminal Pt(NH3)2. When the trinuclear complex (6) is
formed, it would give rise to two peaks in the NMR spectrum, one for terminal Pt(NH3)2 and one for
“internal” Pt(NH3)2 at the region δN/δH –55/4.1 ppm,
with the intensity ratio of 2 : 1. If the tetranuclear species (7) is present in the mixture reaction, it would also give rise to two peaks, but in this complex the intensity of terminal Pt(NH3)2 : “internal”
Pt(NH3)2 would be in 1 : 1 ratio. For a pentanuclear
(8) species, there would be one peak from terminal Pt(NH3)2, and two different peaks for internal
Pt(NH3)2 with intensity ratios 2 : 2 : 1.The spectrum
Indo. J. Chem., 2005, 5 (1), 54 - 57
Sutopo Hadi & Trevor G. Appleton
57
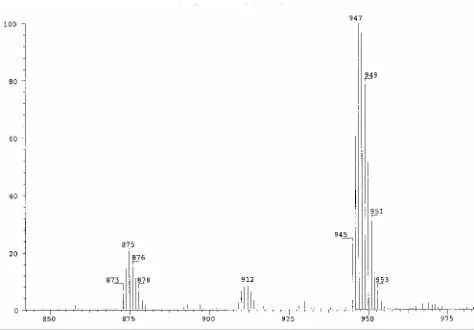
Figure 5 Electrospray mass spectrometry obtained
from the reaction of 5 mM (1) and H3accys in 1 : 2
mol ratio, taken 1 hour after mixing
From the mass spectrometry data obtained at low pH, the strongest peaks were from complex (5) with the m/z 948 (Fig 5). The separation between isotope lines is showed that charge was +1. The isotope pattern obtained corresponded to the pattern expected for 2 platinum atoms.
There were also two other peaks present in the spectrum with the difference of 36 amu between one peak to another. From this difference, these peaks are due to the sequential loss of two ammine ligands at a time (15NH3 = 18 amu).
However, when the reaction was carried out at higher pH (pH > 7), the mass spectrometry data did not show any peaks. This is probably due to the formation of platinum complexes with neutral or negative charge.
ACKNOWLEDGEMENTS
We thank Australian Research Council for the financial support. S. Hadi is grateful for the award of DUE Project scholarship from The University of Lampung Indonesia and The Department of Chemistry, The University of Queensland. Thanks to Ms. L. Lambert for her help in NMR experimentationand Mr. G. McFarlane for his help in running electrospray mass spectrometry.
REFERENCES
1. Appleton, T.G., Connor, J.W., Hall, J.R., and Prenzler, P.D., 1989, Inorg. Chem., 28, 2030. 2. Dedon, P.C., and Borch, R.F., 1987, Biochem.
Pharmacol., 36, 1955.
3. Odenheimer, B., and Wolf, W., 1982, Inorg. Chim. Acta 66, L41.
4. Shanjin, X., Peiyuan, D., Li, Y., and Kui, W., 1984, Fenzi Kexue Yu Huaxue Yanjiu 4, 537.
5. Berners-Price, S.J., and Kuchel, P.W., 1990,
Inorg. Biochem., 38, 305.
6. Van Beusichem, M., and Farrell, N., 1992, Inorg. Chem., 31, 634.
7. Johnson, N.P., Mazard,J., Escalier, J., and Macquet, J.P., 1985, J. Am. Chem. Soc., 107, 6376.
8. Borch, R.F., and Pleasants, J.M., 1979, Proc. Natl. Acad. Sci. U.S.A., 26, 6611.
9. Broch, R.F., Katz, J.C., Leider, P.H., and Pleasants, M.E., 1980, Proc. Natl. Acad. Sci. U.S.A., 77, 5441.
10. Gale, G.R., Atkins, L.M., and Walker Jr., E.M., 1982, Ann. Clin. Lab. Sci., 12, 1, 345.
11. Dedon, P.C., and Borch, R.F., 1984, Proc. Am. Assoc. Cancer. Res., 25, 3571.
12. Bodenner, D.L., Dedon, P.C.,Keng, P.C., Katz, J.C., and Borch, R.F., 1986, Cancer Res., 46, 2571.
13. Lempers, E.L.M., Inagaki, K., and Reedijk, J., 1988, Inorg. Chim. Acta, 152, 201.
14. Lempers, E.L.M., and Reedijk. J., 1990, Inorg. Chem, 29, 217.
15. Appleton, T.G., Bailey, A.J., Barnham, K.J., and Hall, J.R., 1992, Inorg. Chem., 31, 3077.
16. Berners-Price, S.J., and Kuchel, P.W., 1990, Inorg. Biochem., 38, 327.
![Figure 4 2D [obtained from the reaction of 1 mM (1) and H3accys in 1:2 mol ratio at initially pH ~2, then the pH was adjusted to ~7, 32 hours after the reaction 1H, 15N] HSQC NMR spectrum of commenced](https://thumb-ap.123doks.com/thumbv2/123dok/3386581.1759836/3.612.319.551.81.277/figure-obtained-reaction-initially-adjusted-reaction-spectrum-commenced.webp)