CONSUMER PREFERENCES FOR RICE IN MALANG,
EAST JAVA, INDONESIA
Anisa Aprilia
1*, Fitrotul Laili
1, Sujarwo
11
Agricultural Socio-Economics Department, Faculty of Agriculture, University of Brawijaya,
Indonesia
*corresponding author: [email protected]
ABSTRACT: This research aims to investigate characteristic of rice consumers in Malang and determine which combination of rice attributes that included into consumer preferences. The research method was descriptive analysis and conjoint analysis. The results show that the consumer preferences for rice in Malang are affected by taste, colour, rice grain, packaging size and label. Rice taste that desired by consumers in Malang is a tasty rice. In addition, consumers prefer small packaging, pure white colour and labelled rice product, which contains information related to the rice and brand product.
Keywords: consumer preferences, conjoint analysis, rice attributes
INTRODUCTION
Rice is one of staple foods commodities with the highest consumption rate in Indonesia, including Malang area. It leads to the equivalent increasing of rice consumption and population growth, as well as in Malang. Rice production in Malang was about 475,783 tons in 2013, while the amount of rice consumption in the same year was 171,991.57 tons (Statistics Indonesia, 2015). Accordingly, there is surplus of rice in the market. This phenomenon leads consumers to have more alternatives for buying the rice products. So that, consumers can select characteristics of rice product based on their need.
This selection proces is heavily affected by consumer behavior in consuming rice. The knowledge that owned by consumers will determine characteristic of rice products that they want to consume. Despite that, the advancement of
information technology will also affect consumer’s
selection.
Prior research that conducted by Beisiegel (2014) found that the most important purchasing criteria to the rice product in Thailand were rice attributes of health and safety as well as soft texture and Thai origin. Cuevas et al (2016) conducted research of rice consumer behavior in Philippine. Rice attributes, which assessed through visual scoring were gelatinization temperature and
calorimetric and digital image analysis). The results indicated that rice consumed by respondents mainly had similar physical and chemical grain quality attribute. Moreover, the advanced technology will change pattern of rice demand. Consumer behavior in purchasing food items including rice product in line with its progress. The increasing of household income leads to the increasing of rice quality demand.
Demographic changes such as education level, urbanization level and participation rate of women in labor force as well as the progress of transportation and communication certainly affect consumer preferences. Consumers emphasize on balance quality, nutrition and aesthetics. While the increase of women participation in labor force, particularly in urban area, encourages consumers to select food products which packed in certain way so that they will be comfortable in shopping, easy to cook and easy to set up (Astuti, 2008).
The development of consumption pattern is also followed by very tight rice marketing competition from rice producers. Large number of rice products available in the market, in this situation, each rice producers will compete in improving positioning of their rice product property and quality in consumer mind.
provide rice product, which is fit with consumer preferences.
Rice consumers in India prefer to polished white rice. According to the research about consumer acceptance towards unmilled brown and undermilled rice among urban South Indian, in which education regarding health benefit may help the consumers to switch their selection towards brown or undermilled rice (Sudha, et al, 2013). Meanwhile, mostly Nigerian prefer to rice product with moderate and high flaky rice quality. It suggested in any rice improvement programme in Nigeria where these characteristics should be defined as premium (Adeyeye, 2010).
Based on the explanation above, factors that should be considered by rice producers are knowledge of consumer behavior, how and what rice characteristics that desired by consumers. Understanding consumer preferences for rice product will really help rice producers in making decision regarding to the rice products; in which it will not be contradictive to the consumer preferences. Thus, this research aims to determine the characteristics of rice consumer in Malang and to determine which combination of rice attributes that included into consumer preferences.
RESEARCH METHODS
This research was conducted in Malang Regency and Malang City. Research location was determined by purposive technique, in which it was located in traditional and modern market. The research respondent was 190 respondents consisted of 100 respondents from Malang City and 90 respondents from Malang Regency.
Data Type and Analysis Method
This research used primary data that obtained from distributed questionnaires. Data was collected from both areas (Malang City and Malang Regency) and used in data aggregate.
Analysis method that used in this research was descriptive analysis and conjoint analysis. Descriptive analysis used to examine characteristic of rice consumers according to age, ethnicity, gender, marital status, education level, occupation, number of family member, income and place of rice purchasing. Conjoint analysis used to analyze level of consumer preferences for rice based on the attributes.
Conjoint Analysis
Conjoint analysis is part of multivariate statistical analysis. The analysis related to all statistical techniques that simultaneously analyze a number of measurements on individu or object (Santoso, 2011). Conjoint analysis is also an analytical technique that can be used to determine relative importance level and utility value appeared from related product attributes based on customer perception. Thus, conjoint analysis is fit analysis that specifically used to understand consumer preferences towards multi attribute either product or service.
RESULTS AND DISCUSSION
Characteristic of Rice Consumers in Malang, East Java
Characteristic of rice consumers could be seen from gender, marital status, education level, occupation, number of family member, age, income and place of rice purchasing (type of market). The results showed that most of consumers that purchased rice product were women with percentage of 98.42%; while the percentage of male consumers was only 1.58%. It means that women hold the decision about what kind of rice that they would be purchased and consumed. Nevertheless, it was possible for men to pay attention towards household consumption as well.
Based on marital status, married rice consumers had greater proportion of rice purchase than single consumers. Obviously it was due to the fact that married people tend to have more family numbers, so that they would consume more than single people.
Table 1. Characteristic of Rice Consumers in Malang Based on Education Level No Education Percentage (%)
1 Uneducated 1.6 2 Elementary School 5.3 3 Junior High School 21.6 4 Senior High School 35.8 5 Diploma 10.5 6 Undergraduate 24.7 7 Postgraduate 0 Source: Primary data, 2016 (analyzed)
The respondents based on education level was uneducated (1.6%), elementary school (5.3%), junior high school (21.6%), senior high sccool (35.8%), diploma (10.5%), undergraduate (24.7%). Thus, the frequency distribution of respondents in rice purchased at every level of education is not so much different, it cause rice is as a staple food in Malang.
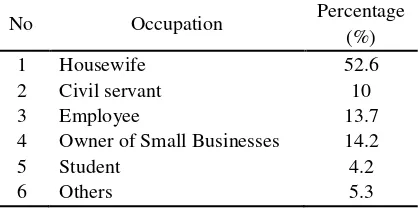
Table 2. Characteristic of Rice Consumers in Malang Based on Occupation
No Occupation Percentage (%) 1 Housewife 52.6 2 Civil servant 10 3 Employee 13.7 4 Owner of Small Businesses 14.2 5 Student 4.2 6 Others 5.3 Source: Primary data, 2016 (analyzed)
The respondent distribution based on occupation was housewife (52.6%), civil servant (10%), employee (13.7%), owner of small businesses (14.2%) and others (5.3%). It indicated that housewife was dominant in rice purchase due to rice as staple food in household consumption.
Number of family members was one factor that been investigated as rice consumer indicator. It was because the number of family members could affect decision of rice purchase. Consumer with highest percentage of family members was consumer with 4 family members. In addition, in this research, age of family member could be factor that considered by consumers in the rice purchase. It was because
proportion of rice consumption determined by age, according to nutritional needs and energy required by the consumers.
Age of rice consumers ranged from ≤ 20 and ≥ 51 years old. Age is one of characteristics that affect consumer decision in purchasing rice product. Age would affect mind-set consumption behavior. Total of 38.9% rice consumers ranging from 31-40 years old as the highest percentage of rice purchasing in Malang.
Income was greatly important material resource for consumers because income used to fulfill their consumption. Consumer income which ranging from > IDR4,000,000 to IDR6,000,000 per month was the largest income range of rice consumer with percentage of 35.26%. While in Philippine, consumer with high income had the largest variability in rice grain quality attribute and concurrently appear to be the most prominent preference among consumers. Consumer with high income also spent more money to rice product as with the consumption increases, while it was in contrast with middle-income customer (Cuevas et al, 2016). Therefore, the higher income level will imply the higher ability of consumer in purchasing rice.
Thus, consumer’s income level would affect
purchasing ability.
Based on the place of rice purchasing, traditional market had the greatest frequency of rice purchasing with percentage of 52.63%. While place of rice purchasing in modern market or store was 47.36%. It showed slight difference that means both of traditional markets and modern market became common place for consumers to purchasing rice.
Consumer Preferences for Rice Assessment to the Rice Consumers
Besides describing individual criteria, the respondents also asked about attributes of rice product that included into their preferences, such as rice taste, rice colour, rice grain, packaging size and label.
Table 3. Assessment of Rice Consumers in Malang
No Description Criteria Answers
Frequency Percentage (%) 1. Taste Less crusty and glutinous 21 11.05
Tasty 169 88.95
2. Colour Turbid white 51 26.84 Pure white 139 73.16 3. Rice grain Broken grain 155 81.58 Whole grain 35 18.42 4. Packaging size 5 kg 47 24.74
10 kg 58 30.53
25 kg 86 45.26
5. Label Only brand name 73 38.42 Contains rice and brand description 117 61.58 Source: Primary Data, 2016 (Edited)
Consumer preferences for rice colour showed that mostly respondents preferred to pure white (73.16%), while for turbid white rice colour preferrence was 26.84%. Thus, pure white rice colour had the highest level of importance to consumer preference in Malang. The rice grain attribute are whole grain (18.42%), and broken grain (81.58%). It means 155 respondents rom 190 respondents prefer to consume rice that contain of broken grain.
Packaging size attribute are 5 kg (24.74%), 10 kg (30.53), and 25 kg (45.26%). It indicated that 25 kg package has highest percentage. However, on average, those three packaging sizes almost had same proportion. The consumers assumed that the rice packaging size was not much different from one to another.
Label attribute of rice are only brand name (38.42%), and contains rice and brand description (61.58%). Thus, label with rice and brand information on the rice packaging was the most considered by consumers in Malang.
Conjoint Analysis
Conjoint analysis in this research used to measure rice attributes preference and assist rice sellers in Malang about product characteristic that rice consumers desire. Firstly, this analysis conducted by considering of importance and utility rice product attributes (taste, colour, rice grain, packaging size and label)
Overall, it could be seen that consumers preferred to the tasty rice. It was indicated by positive result of utility value (0.578) compared to less crusty and glutinous taste which showed negative result. Thus, the level of consumer preference for taste attribute was tasty rice. The
uniqueness of rice taste would affect consumer purchasing decision. The more unique or distinctive taste of a product, the more likely for consumers in purchasing the product. Thus, producers should considered on taste attribute, because the consumers would consider in purchasing rice product and likely to make another purchasing repeatedly. Taste attribute in this research was preferred to tasty rice than less crusty and glutinous, which is affected consumer decision of rice purchasing. Overall, rice that produces tasty rice was very important attribute that affected consumer purchasing decision.
Indonesian people commonly consume rice as carbohydrate source. Rice colour in this research shows consumer preference to make decision on rice purchasing. Consumers prefer pure white colour (0.168) while for turbid white rice (-0.168) (Table 4). It shows that rice colour that the most preferred by consumers is pure white rice. Thus, milled rice and free from rice bran and husk are rice that consumer desire to consume based on its colour.
Table 4. The weight of importance towards value and utility of rice attributes
No Attribute Attributes Level Importance
Value Weight Utility 1. Taste Less crusty and glutinous
36.809% -0.578
Tasty 0.578
2. Colour Turbid white
10.678% -0.168 Pure white 0.168 3. Rice grain Broken grains
14.447% 0.227 Whole grains -0.227 4. Packaging size 5 kg
30.444%
0.557
10 kg -0.402
25 kg -0.152
5. Label Only brand name
7.621% -0.120 Contains rice and brand description 0.120 Source: Primary Data, 2016
From marketing strategy point, product packaging is not limited on protecting product. Moreover, it is also functioned as product communication, which finally leds to the best way of how to sell the product itself. Packaging is used as product protection and maintaining content hygiene as well as creating attractive appearance. In line with the reason above, this research employs packaging size as one of rice attribute.
On the packaging sizes attribute, overall, respondents in this research prefer for rice with 5kg packaging size and it results positive utility value of 0.557. Meanwhile, packaging size of 10kg and 25kg result negative utility value for 0.402 and -0.152, respectively. It explain that both packaging sizes are not included into consumer preference. Packaging size of 5 kg is the smallest size among the rice packages. Thus, consumers prefer rice product with 5kg packaging size because the size is handy and the rice is not taking too long time in household storage. This imply that consumers would always have fresh and good quality rice product due to faster restock product issue.
In this research, respondents showed preferrence on label attribute which contained of rice and brand information. It is indicated by positive utility value of 0.120. While label attribute with only brand name resulted in negative utility value of -0.120, it means that consumer prefer rice product with an informative packaging. Moreover, informative packaging that contains of label and brand of product gives consumer information about the product and help them to differentiate from other products. Thus, product label which contained rice and brand description is very important to consumer preferences and a good
among producers could not be avoided, so producers that have strong brand equity would be able to survive in tight market competition and probably would dominate the market.
Preference combination of rice product that affected on consumer purchasing decision based on this research are pure white color rice, containing broken grains, with 5kg packaging size and having label and brand information. Thus, producers should consider this preference combination in order to produce and create good marketing product, which leds to the customer satisfaction. While, in Ghana, quality attribute are considered as important by consumers to make purchasing decision. Most of consumers preferred long grain aromatic rice that produced soft and tasty rice (Asante et al, 2013). It showed that rice consumer in Malang most consider about the taste than physically matter.
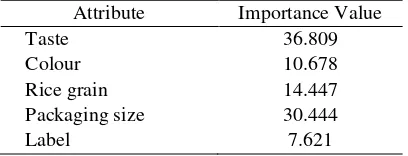
This relative importance score indicates degree of importance to the attribute (Table 5). Those values indicate size (in percent) of relative importance of single factor to the utility determination. Sequences of relative importance score are taste (36.809), packaging size (3.0444), rice grain (14.447), colour (1.678), and label (7.621). It showed that the most important factor that rice consumer consider before they made purchasing desicion is rice taste.
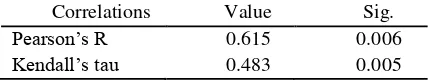
The next step in this research is correlation test. Correlation value uses to determine whether the result aggregate of conjoint analysis is valid in predicting respondent preferences or not (Table 6).
Kendall’s Tau correlation measurement shows
score 0,483 with significance value 0.005. It indicated relatively high correlation between estimated preference and actual preference or it contains accurate prediction in the conjoint process. Thus consumer preferences for rice products, which analyzed by several attributes – taste, colour, rice grains, packaging size and label – have strong correlation in determining consumer preferences for rice in Malang.
Table 6. Correlation Value Based on Kendall’s Tau Correlation
Correlations Value Sig.
Pearson’s R 0.615 0.006
Kendall’s tau 0.483 0.005
Managerial Implications
Based on research result above, rice consumer is major part of marketing activities in Malang. Thus, rice producers require to develop and improve marketing strategy for their products in order to fulfill consumer preferences both in quality and price. High knowledge level of consumers significantly affecte on purchasing behaviour. It means that rice producers tend to face an increasing market competitiveness.
Rice producers need to fulfill consumer expectation of rice product based on consumer preference. Producers need to determine good and precise marketing strategy. Producer planing management is affected by consumer preference. Thus, it could be conducted by developing marketing strategy of rice product using marketing mix.
Product was essential part in marketing activities. Rice producer need to consider on rice product quality –taste, colour, and rice grain- for perform a precise marketing strategy. Rice consumer in Malang highly prefer for a tasty rice. Thus, rice producers need to highly consider on starch that affected on rice taste.
Rice starch consists of large molecules, which composed or assembled from simple sugar chains like glucose. The straight chain refers to amylose, then branched chain called as amylopectin. Ratio of amylose/ amylopectin determined rice texture, either glutinous or not, becomes crusty quickly or not. Ratio of amylose / amylopectin also called as amylose content (Koswara, 2009).
Amylose content on rice affects volume and tenderness of rice. More higher amylose content on rice it produced crusty rice, and vice versa.. Thus, crusty rice has 7-10 percent of amylose content
(Koswara, 2009). Amylose content of rice determined by rice varities, so rice producers need to choose a better varities to produce a tasty rice.
The next product attribute is rice colour. Rice colour that preferred by consumers is white and pure white (clean) colour. Rice colour is affected by physical properties of rice varieties and post-harvest management. Thus, producers need to consider and improve post-harvest treatment. It aims to produce a high quality product. Despites colour, consumers also consider rice grain as their preference, which is related to the presence and absence of broken grains.
Rice consumers in Malang prefer to rice, which contains broken grains, but the producers also needed to consider about post-harvest management. The reason of consumer preference for rice grains is rice price. Rice product with premium quality tend to be more expensive than rice product with low quality, so that consumers preferred to inexpensive rice product with its grain quality as well.
Seen from income aspect, rice consumers in Malang earned income range from IDR 2,000,000 to IDR 6,000,000 per month with the average of 4 family members raging from age 5-20 years old. That condition would affect purchasing decision and consumed rice quantity, in which they tend to buy inexpensive rice product. Other product attribute, which also considered as consumer preference is packaging size where it has the second highest percentage of importance factor after rice taste. Again, based on rice consumer income in Malang then packaging size of 5kg is preferred by the consumers. Indeed, it is highly correlated with rice price. Moreover, packaging size of 5kg would be easier to carry.
Last attribute that considered as consumer preference is label. Along with level of knowledge that owned by rice consumers, they tend to need more information related to the product. Consumer prefer a label wih a good information about the product, and rice producers need to consider it.
CONCLUSION
fourth highest importance value is rice colour (10.678%), rice colour that consumer preferred is white pure rice. Furthermore, the last consideration of consumer preferences was product label (7.621%), while the consumers preferred an informative packaging.
SUGGESTION
Based on the research results and conclusion made, there are several suggestions: (1) for rice producer and rice seller should consider of consumer preference and factors that affect on purchasing decison; (2) government should support any programmes to improve rice quality by providing education and training for farmers. Besides, the government should establish policy in order to manage rice price, so that high qualified rice product will be affordable for consumers; (3) For the next researcher in conducting further research should include analysis of customer satisfaction which contains rice product combination the most desired by rice consumers in Malang.
REFERENCES
Adeyeye, J.A, E.P. Navesero, O.J. Ariyo and S.A. Adeyeye. (2010). Consumer Preference for Rice Consumption in Nigeria. Journal of Humanities, Social Sciences and Creative Arts. 5(1):26-36
Asante et al. (2013). Farmer and Consumer Preferences for Rice in the Ashanti Region of Ghana: Implications for Rice Breeding in West Africa. Journal of Plant Breeding and Crop Science
Astuti, Endang Pudji. (2008). Analisis Preferensi dan Kepuasan KonsumenTerhadap Beras di Kecamatan Mulyorejo Surabaya JawaTimur. Skripsi. Institut Pertanian Bogor. Bogor.
Beisiegel, Lara. (2014). Consumer Preferences Regarding Quality Rice in Thailand. Master Thesis at the Faculty of Agriculture, University of Bonn, in cooperation with Deutsche Gesellschaftfür Internationale Zusammenarbeit (GIZ) GmbH. Bangkok. Thailand
Cuevas RP, Pede VO, McKinley J, Velarde O, Demont M. (2016). Rice Grain Quality and Consumer Preferences: A Case Study of Two Rural Towns in the Philippines. PLoS ONE 11(3): e0150345.
doi:10.1371/journal.pone.0150345 Engel, J.F., R.D, Blackwell and P.W, Miniard.
(1994). Perilaku Konsumen (Consumer Behavior). Binarupa Aksara. Jakarta Koswara, Sutrisno. (2009). Teknologi Pengolahan
Beras: Teori dan Praktek. eBook Pangan.com.
Santoso, S. (2010). Statistik Multivariat: Konsep dan Aplikasi dengan SPSS. Elex Media Komputindo.Jakarta