Journal of Marketing © 2014, American Marketing Association
George Knox & Rutger van Oest
Customer Complaints and Recovery
Effectiveness: A Customer Base
Approach
Although customer complaints are a well-studied aspect of business, no study has measured the impact of actual complaints and recoveries on subsequent customer purchasing. The authors develop a customer base model to investigate the effectiveness of recovery in preventing customer churn. They calibrate it on panel data that track actual purchases, complaints, and recoveries for 20,000 new customers of an Internet and catalog retailer over 2.5 years. Complaints are associated with a substantial increase in the probability that the customer stops buying, but the size of the increase depends on prior customer experiences: prior purchases mitigate the effect, and their impact is long-lasting, whereas prior complaints exacerbate the effect, but their impact is short-lived. Thus, unless the customer leaves the company after a complaint, or a second failure occurs shortly after the first, the relationship quickly returns to normal. Recovery counters the effect of the complaint but, in almost all cases, does not entirely offset it. The authors use simulation to translate the results to financial impact and discuss implications for researchers and managers.
Keywords: complaints, complaint management, churn, failure, recovery
George Knox is Associate Professor, Tilburg University (e-mail G.Knox@ tilburguniversity.edu). Rutger van Oest is Associate Professor, BI Norwe-gian Business School (e-mail: [email protected]). The authors thank Tor Wallin Andreassen, Bart Bronnenberg, Marnik Dekimpe, Josh Eliashberg, Els Gijsbrechts, Rik Pieters, and participants of the Tilburg Summer Research Camp, the Kleivstua research seminar, the Marketing Dynamics Conference, the Direct/Interactive Marketing Research Summit, the Zaragoza Logistics Center, and the Marketing Science Conference for their detailed and useful comments. The first author thanks the Nether-lands Organization for Scientific Research (NWO Vici Grant 453-09-004) for financial support. The authors thank Sander Beckers and Inge Vening for their help recording data. Finally, the authors thank three anonymous JMreviewers for their helpful comments. Leigh McAlister served as area editor for this article.
C
ompanies need to maintain long-term relationshipswith their customers to survive. Customer base analysis aids managers by, among other things, fore-casting future purchasing and identifying which customers are most at risk of leaving (Fader and Hardie 2005; Gupta et al. 2006). The majority of customer base models rely exclu-sively on customers’ prior transaction history to make these predictions (e.g., Fader, Hardie, and Lee 2005a, b; Schmitt-lein, Morrison, and Colombo 1987), though more recent work incorporates nontransactional elements such as cus-tomer satisfaction (Ho, Park, and Zhou 2006) and service quality (Braun, Schweidel, and Stein 2013).
Customer complaints are important nontransactional events because they represent critical turning points in the company’s relationship with its customers (Blattberg, Kim, and Neslin 2008). They are a daily reality of business in vir-tually any industry and are typically stored in data ware-houses, making them easily accessible to managers. How
complaints are handled (i.e., the recovery) marks the “acid test of a company’s customer orientation” (Homburg and Fürst 2005, p. 95) and may have far-reaching positive or negative consequences for the company’s relationship with its customers. An extraordinary recovery may turn com-plaining customers into loyal ones and generate more good-will than if the failure had not occurred in the first place (Hart, Heskett, and Sasser 1990); an ineffective recovery can leave customers feeling even worse about the company and drive them to leave (Bitner, Booms, and Tetreault 1990). If recovery is a strategic resource (Hart, Heskett, and Sasser 1990), companies need to know how effective it is in driving subsequent customer behavior.
The goal of our study is to incorporate these critical nontransactional elements—complaints and recoveries— into customer base analysis and investigate their effects on customer churn (i.e., the likelihood that the customer per-manently stops buying from the company). In transactional (noncontractual) settings—applicable to many retailers and service providers—this poses a challenge because churn is not directly observed and thus must be inferred using observed customer activity (Kumar and Reinartz 2012).
experiences (Bolton, Lemon, and Bramlett 2006), and prod-uct returns (Reinartz and Kumar 2003) on future purchasing. Virtually all service recovery studies take the customer’s perspective (Parasuraman 2006) and use survey-based approaches, sometimes combined with experimental data (e.g., Smith and Bolton 1998; Smith, Bolton, and Wagner 1999), to investigate the consequences for customer percep-tions and intenpercep-tions. Although these survey-based metrics are crucial for understanding the customer’s process, they have limited managerial relevance (Davidow 2003; Mittal and Kamakura 2001), in part because behavioral intentions may be systematically biased and the link with actual behavior may be weak (Chandon, Morwitz, and Reinartz 2005; Gupta and Zeithaml 2006). Therefore, “the most fertile area for research on customer impact pertains to how customer behavior (rather than attitudes or intentions) responds to changes in marketing actions” (Rust et al. 2004, p. 84).
Our customer base approach is novel because we take the company’s perspective and examine the consequences of actual complaints and recoveries on actual purchasing. We test whether three fundamental hypotheses from the ser-vice recovery literature stream hold with actual customer behavior and test a new hypothesis about how long the effects of prior purchases and complaints last in the cus-tomer relationship; such a hypothesis would be difficult to test without panel data. We control for unobserved hetero-geneity in customer response and endohetero-geneity in the com-pany’s recovery decision to separate out effects due to the recovery from those due to unobserved customer character-istics or company targeting. Our model can help managers decide whether to provide recovery by balancing the costs and benefits, an important yet largely ignored issue (Para-suraman 2006).
We contribute several new findings to the collective knowledge on customer complaints. Complaints are associ-ated with a substantial increase in churn, but the size of the increase depends on prior customer experiences. Prior pur-chases mitigate the effect and have a long-lasting, multiyear impact; in contrast, prior complaints exacerbate the effect, but their impact is short-lived because of the changing com-position of the customer base: the most dissatisfied cus-tomers stop buying and thus drop out of the customer base, leaving only customers who are willing to give the com-pany another chance. So, unless the customer leaves after a complaint, or a second failure follows closely after the first, the relationship quickly returns to normal. Finally, although recovery counters the effect of a complaint and helps reset the relationship, in almost all cases it does not entirely off-set the complaint; we find little evidence for a recovery paradox.
In the following sections, we present the conceptual framework and develop the hypotheses underlying our empirical analysis. Next, we describe the data set and spec-ify the model. We then discuss the empirical findings, the results of the hypothesis tests, and the financial conse-quences of complaints and recoveries. We conclude with the implications of our study for researchers and managers.
Conceptual Framework
Future purchasing depends on the likelihood of churn fol-lowing two types of events—complaints and purchases—in which “churn” refers to the event in which the customer permanently becomes inactive (i.e., stops buying from the company forever). Our main interest centers on explaining churn following a complaint, so we formulate our hypothe-ses using churn as our dependent variable. Nevertheless, we also control for churn following a purchase and its drivers. Figure 1 presents the framework.
We define complaints as customer-initiated expressions of dissatisfaction to the company (e.g., Landon 1980); they represent an opportunity for the company to remedy a prob-lem (Bijmolt et al. 2010). Recovery refers to the set of actions a company takes in response to the failure to keep the customer’s goodwill (Grönroos 1988). The service recovery literature stream has typically viewed recovery from the customer’s perspective by using customer satisfac-tion with complaint handling (e.g., Smith and Bolton 1998; Tax, Brown, and Chandrashekaran 1998). In contrast, we approach recovery from the company’s perspective as a dichotomous outcome: the company recovers the complaint if it makes an attempt that the customer does not refuse. Thus, no recovery is provided if the company does not make any (further) attempt to resolve the problem; the no-recovery outcome includes cases in which the customer refuses the proposed solution and the company does not make a new offer. We characterize prior complaints and purchases by their incidence and timing (Van Oest and Knox 2011). Similar to Ansari, Mela, and Neslin (2008) and Van Diepen, Donkers, and Franses (2009), we weight these prior cus-tomer experiences by their recency to capture the notion that events are less salient (and therefore likely discounted more) the longer ago they occurred. Our last hypothesis involves the speed of decay (i.e., the degree of discounting) for prior complaints relative to prior purchases.
FIGURE 1 Conceptual Framework
s t n i a l mp o C r o i Pr
H4
s
d pse Ela e Tim
s e s a h c r u P r o i Pr
R t n i a l mp
Co ecove
H1
H2
H3
ery
of hood li Like
A n r u Ch fter
Impact of Prior Complaints on Churn After Complaint
One complaint may signal a forgivable error, but more than one complaint may indicate a more systemic problem. Attri-bution theory predicts that the customer will react more negatively if the cause of the complaint is perceived to be permanent rather than temporary (Folkes 1984; Maxham and Netemeyer 2002). The first failure decreases trust but also creates uncertainty as to whether the lower level of trust is justified; a second failure acts as confirmation and decreases both level of trust and degree of uncertainty (Chandrashekaran et al. 2007; Rotte et al. 2006). Memory research has suggested that a second failure may reactivate the effects of the first failure if the latter is recent enough (Solomon 2006); this reinforcement effect (Van Oest, Van Heerde, and Dekimpe 2010) makes the impact of the sec-ond failure more severe. If there are prior incidents, cus-tomers are less satisfied, have lower self-stated repurchase intentions (Maxham and Netemeyer 2002; Van Doorn and Verhoef 2008), and thus are more likely to leave.
H1: Prior complaints increase the likelihood of churn follow-ing a complaint.
Impact of Prior Purchases on Churn After Complaint
High prior satisfaction with the company relationship may influence customer responsiveness to failure in opposite ways. Accumulated goodwill can provide a buffer and make customers less responsive when a failure occurs. However, positive prior experience can also lead to high expectations that are more difficult to meet and may therefore trigger more negative customer response (Bolton 1998; Tax, Brown, and Chandrashekaran 1998). There is considerable survey evidence that the goodwill (or buffer) effect of prior satisfaction dominates the expectations effect (i.e., cus-tomers become less responsive to failure when satisfaction increases; see, e.g., Anderson and Sullivan 1993; Tax, Brown, and Chandrashekaran 1998; Van Doorn and Verhoef 2008). In line with the goodwill explanation, a failure is inconsistent with prior experience for a satisfied customer. Thus, although the customer’s level of trust in the company decreases, this decreased trust is tempered with uncertainty, which limits the negative impact of the failure (Chan-drashekaran et al. 2007; Rotte et al. 2006). A lengthy and extensive purchase history indicates a stable and satisfac-tory customer–company relationship (Cooil et al. 2007; Gupta and Zeithaml 2006; Rust and Chung 2006) and thus should make the customer more forgiving when a complaint occurs.
H2: Prior purchases decrease the likelihood of churn following a complaint.
Impact of Recovery on Churn After Complaint
The customer starts from a deficit position when a com-plaint occurs (Andreassen 1999; Oliver 1997) and expects the company to resolve the issue. Customers have expecta-tions not only about the quality of service but also about the quality of the company’s recovery following a service
fail-ure (McCollough, Berry, and Yadav 2000). They encode a recovery outcome as a gain or loss depending on their expectations. A good recovery (positive disconfirmation) is a perceived gain; no recovery or insufficient recovery (negative disconfirmation) implies a perceived loss. Although the company may not be able to avoid the failure itself, it has control over the recovery provided (Hart, Hes-kett, and Sasser 1990). The gain–loss outcome of recovery and the notion that the company has control over it should make customers responsive to it (Folkes 1984; Maxham 2001).
Prospect theory states that customers are more sensitive to losses than gains; worse-than-expected service is more harmful than better-than-expected service is beneficial (e.g., Anderson and Sullivan 1993; Rust et al. 1999). Whereas no recovery or insufficient recovery (a loss) may have large negative consequences for retention, the positive effect of the size of a good recovery (a gain) is limited (Davidow 2003). Thus, exceeding the threshold is the primary objec-tive of recovery; the precise amount is secondary.
If the recovery is worse than expected (i.e., below the threshold), there is a double deviation from expectations resulting from both the service failure and the company’s unsuccessful recovery (Bitner, Booms, and Tetreault 1990). This double deviation results in low perceived justice and low satisfaction (e.g., Maxham and Netemeyer 2003) and decreases self-reported customer loyalty (Andreassen 1999; Orsingher, Valentini, and De Angelis 2010). However, if the recovery is better than expected, the negative effect of the failure may be partially or completely mitigated.
In some cases, customers may respond so well that their satisfaction or self-stated repurchase levels are higher than they would have been had no failure occurred (De Matos, Henrique, and Rossi 2007; Parasuraman 2006). Although some studies have offered evidence for this recovery para-dox (e.g., Hart, Heskett, and Sasser 1990; Maxham and Netemeyer 2002; Smith and Bolton 1998), others have reported that recovery effectiveness may offset but does not exceed the failure’s impact (Andreassen 2001) or does not entirely offset it (Maxham 2001; McCollough, Berry, and Yadav 2000). Importantly, none of these studies use actual purchase, complaint, and recovery data to estimate recovery effectiveness. Most extant studies have confirmed that recovery matters (e.g., Gilly and Gelb 1982; Smith and Bolton 1998), with a few studies reporting either no signifi-cant effect (Bolton 1998; Van Doorn and Verhoef 2008) or that the effect depends on the attribution context (Grewal, Roggeveen, and Tsiros 2008). We hypothesize the following:
H3: Recovery decreases the likelihood of churn following a
complaint.
Impact of Prior Complaints and Purchases on Churn After Purchase
Gupta and Zeithaml 2006; Gustafsson, Johnson, and Roos 2005); most studies have found that even a better-than-expected recovery does not fully mitigate the negative effects of the underlying failure. In contrast, many prior purchases should reduce the likelihood of churn after a pur-chase because they signal satisfaction with the company (e.g., Cooil et al. 2007; Gupta and Zeithaml 2006), and many good experiences increase trust and decrease per-ceived risk of future purchasing (Rust et al. 1999).
Speed of Decay in Impact of Prior Complaints Relative to Prior Purchases
We provide two competing hypotheses from different per-spectives. The underlying mechanisms lead to opposite pre-dictions; the dominating mechanism determines which hypothesis (if any) is confirmed.
The first perspective is that the impact of negative expe-riences lasts longer than that of positive expeexpe-riences (Baumeister et al. 2001); negative events tend to occur rela-tively infrequently but often with large consequences, mak-ing them both accessible in memory and diagnostic (Feld-man and Lynch 1988; Menon, Raghubir, and Schwarz 1995). This can manifest in multiple ways: negative emo-tions trigger more cognitive processing and stronger changes in behavior than positive emotions (e.g., Schwarz 1990); negative events also affect relationships more than positive events (Levenson and Gottman 1983). Thus, the impact of low-frequency and mostly negative emotional events such as complaints should last longer (i.e., decay more slowly) than the impact of high-frequency, mostly positive events such as purchases (Fiske 1980; Nisbett and Ross 1980). This leads to the first competing hypothesis:
H4a: The effect of prior complaints on churn lasts longer than
that of prior purchases.
The second perspective amounts to a potentially strong sorting effect (e.g., Fader and Hardie 2010) in which the most dissatisfied complaining customers drop out of the customer base and thus do not contribute to the rate of decay of prior complaints. The customers who remain with the company and (by definition) give it another chance are the ones on which the rate of decay is estimated. Within this group, the effect of the complaint on the future likelihood of churn is likely short-lived; although the complaint may remain accessible in memory, it quickly becomes less diag-nostic when a customer decides to stay with the company after the complaint. These customers may be dissatisfied and suffer in silence but remain loyal in terms of future pur-chasing (Hirschman 1970).
H4b: The effect of prior complaints on churn does not last as long as that of prior purchases.
Data
Our transaction and complaint data are from a major U.S. Internet and catalog retailer with more than 2,000 employ-ees and ranked in the Top 50–largest direct marketers by Catalog Age and Internet Retailer. We observe 20,000 new customers from their first purchase with the company, in
one of the first ten weeks of 2001, until June 30, 2003 (i.e., at most 2.5 years since their initial purchase). Customers made, on average, 2.3 purchases (ranging from 1 to 26) with an average (completed) interpurchase time of 192 days; they spent an average of $57.32 per order. The corre-lation between interpurchase time and spending per pur-chase is nearly zero (p= .64).
The novel feature of our data is the complaint log file, which identifies the customer, date, and a description of the complaint incident. There are 922 complaints recorded from 805 customers (4% of total customers). Most complaints are voiced soon after a purchase: 18% of all complaints occur on the same day as a purchase, and 80% occur within three weeks; the average time to voice a complaint is 28 days. The across-customer correlation between number of purchases and number of complaints is .14 (p< .001). We hired two graduate students to independently code whether the company provided recovery for each of the 922 com-plaint events. This resulted in 884 recovered comcom-plaints and 38 cases without recovery, with a high intercoder reliability of .973 (Perreault and Leigh 1989). A third judge (one of the authors) resolved coding discrepancies.
A Model for Purchasing,
Complaining, and Churn
We assume that customers go through two stages in their latent lifetime with the company (e.g., Schmittlein, Morri-son, and Colombo 1987): all customers begin in an active state and remain there until they become permanently inac-tive, when churn takes place. Because our setting is non-contractual (i.e., transactional), the time at which churn occurs is not observed and must be inferred from observed patterns in purchasing (Fader, Hardie, and Lee 2005a, b; Schmittlein, Morrison, and Colombo 1987) and complain-ing behavior (Van Oest and Knox 2011). Similar to the beta geometric/negative binomial distribution (BG/NBD) model (Fader, Hardie, and Lee 2005a), we assume that churn can only occur after an event (i.e., a purchase or a complaint).
Although a customer must be active to either purchase or complain, the absence of these events over time has two possible explanations: (1) the customer permanently became inactive after the last event and will never purchase or complain again, or (2) the customer is still active and the next event will occur beyond the observation horizon. For a frequent customer, a long hiatus in purchasing and com-plaining is a strong signal of churn; for an infrequent cus-tomer, a long hiatus is a weaker signal because it is consis-tent with both active (but infrequent) and inactive states.
complaint is voiced, it either occurs on the same day as a purchase with probability psamedayor is delayed with proba-bility 1 – psameday, where the number of days of delay fol-lows a timing distribution. The customer leaves the com-pany after the complaint with churn probability pchurn_com or remains active with probability 1 – pchurn_com. If the cus-tomer remains active, he or she may still be unhappy and may voice another complaint with probability panother, with the timing since last complaint again drawn from a timing distribution, or he or she may not voice any further com-plaints with probability 1 – panother.
This process describes an iteration of one purchase and possibly multiple complaints. Next, a new iteration begins for an active customer, in which the time of the next pur-chase relative to the last event (purpur-chase or complaint) fol-lows a timing distribution. Iterations continue until the cus-tomer churns.
To test our hypotheses, we make the pchurn_comin Figure 2 a function of the customer’s prior complaints, prior pur-chases, and whether the company provides recovery. Because churn is unobserved, we need to infer it from the timing of purchases and complaints; to do so, we must specify their corresponding timing distributions. We next describe these model components. We use the index i = 1, ..., N for customers and the index j = 1, ..., Jifor customer i’s events (i.e., purchases and complaints).
Event Timing
For j = 2, ..., Ji(time is initialized at 0 for event j = 1), we capture purchase timing relative to the last event by a Weibull density. The constant shape parameter is apur, and we allow the scale parameter b~pur, i, jto depend on the last Equation 1 is flexible and allows for nonmonotonic shapes. If apur= 1, it collapses into the more restrictive and mono -tonically decreasing exponential density that is often used (Fader, Hardie, and Lee 2005a, b; Schmittlein, Morrison, and Colombo 1987). Similar to Equation 1, we assume that complaint timing for j = 2, ..., Jiis given by another Weibull density, with its scale parameter depending on COMi, j – 1:
with
Customer Churn
In accordance with H1–H3, the probability that the customer churns after a complaint, pchurn_com,i,j, may depend on the customer’s prior complaints and purchases and whether the company recovered the current complaint1:
where RECi, jis the 0/1 indicator variable for recovery. The variables PCOMi, jand PPURi, jcapture customer i’s prior complaints and purchases by the time of event j. If there is no recency weighting (i.e., every prior event is weighted equally), then PCOMi, j= Sj – 1
k = 1COMi, k (i.e., the number of
prior complaints from initial event 1 to the most recent event j – 1), where the 0/1 indicator variable COMi,k ensures that only complaint events are counted. Similarly, PPURi, j= Sj – 1
k = 1(1 – COMi, k) counts the number of prior
pur-chases, where the 0/1 indicator variable 1 – COMi, kensures that only purchase events (not complaints) are included. We incorporate recency weighting using an exponential decay pattern (Ansari, Mela, and Neslin 2008; Van Diepen,
1We extended the churn probability after a complaint with two
Donkers, and Franses 2009) so that the final forms of the two variables are
where Ti, kÆjis the number of days between customer i’s prior event k and current event j, and 0 < lcom£1 and 0 <
lpur£1 are the decay parameters for prior complaints and purchases, respectively. H4a(H4b) corresponds to lcom> (<)
lpur. The summation index k in Equation 6 runs over all event types (both purchases and complaints), where the 0/1 indicator variables ensure that only the appropriate event type is included. If lcom = lpur = 1, there is no recency weighting, and prior complaints and purchases would become unweighted counts.
We let the customer’s likelihood of churn after a pur-chase, pchurn_pur, i, j, vary according to prior complaints and purchases in a similar way as Equation 5:
Unobserved Customer Heterogeneity
We capture unobserved heterogeneity using latent classes. We make all parameters in the customer’s timing and churn decisions in Equations 1–5 and Equation 7 class specific and do the same for the customer’s probability of voicing a complaint (i.e., pcom). We keep the probabilities psameday
and panotherhomogeneous; they are necessary for predicting
future purchasing but are not the focus of our hypotheses and are based on few observations.
Endogeneity of the Company’s Decision of Whether to Provide Recovery
Whether the company provides a recovery to a complaining customer may be partially driven by observed summaries of customer behavior, such as prior complaints and purchases. Other unobservable factors such as attributes of the customer (e.g., irate, friendly) or the complaint (e.g., attribution, sever-ity) may also play a role. Thus, the recovery decision is not entirely random; ignoring the association between recovery and the customer’s propensity to purchase, complain, and leave the company may lead to biased parameter estimates. We establish an association by estimating the parameters governing the customer’s decisions and the company’s recov-ery decision simultaneously in the latent class framework (e.g., Donkers et al. 2006; Schweidel and Knox 2013). We let the probability that the company provides recovery depend on the customer’s prior complaints and purchases. Thus, (7)
exp PCOM PPUR
1 exp PCOM PPUR ,
churn _ pur, i, j
pur, 0 pur, 1 i, j pur, 2 i, j pur, 0 pur, 1 i, j pur, 2 i, j
(
)
(
)
π
= δ + δ + δ
+ δ + δ + δ
(6) PCOM COM , and
PPUR 1 COM ,
i, j com
T
k 1
j 1
i, k
i, j pur
T
k 1
j 1
i, k
i, k j
i, k j
∑
∑
(
)
= λ
= λ −
= −
= −
→
→
(8)
exp PCOM PPUR
1 exp PCOM PPUR ,
rec, i, j
rec, 0 rec, 1 i, j rec, 2 i, j rec, 0 rec, 1 i, j rec, 2 i, j
(
)
(
)
π
= δ + δ + δ
+ δ + δ + δ
where PCOMi, jand PPURi, jare defined by Equation 6 and the parameters drec, 0and drec, 2are class specific. We keep
drec, 1fixed across classes because it is difficult to identify
empirically; relatively few customers have prior complaints (limited variation in the independent variable), and com-plaints are recovered in almost all cases (also limited varia-tion in the dependent variable). We estimate all model parameters in Equations 1–8 across all classes jointly using maximum likelihood. Appendix A provides the technical details.
Results
To determine the number of latent classes, we begin with one and increase this number until the Bayesian informa-tion criterion does not decrease further (e.g., Donkers et al. 2006). Using the whole observation period, the Bayesian information criterion score is lowest for two classes; this result does not change when a shorter calibration period is taken. When we randomly divide customers in our sample into two equally sized groups of 10,000 and fit the model separately to these two subsamples, we again find an opti-mal two-class solution with similar relative class sizes and class-specific estimates. Thus, our latent class results seem to be stable.
We validate our model by comparing its out-of-sample predictions with those of two benchmark models that ignore complaints and recoveries: a two-class nested “purchase-only” model and the well-known BG/NBD model (Fader, Hardie, and Lee 2005a). We find that our out-of-sample predictive performance is better than both benchmark mod-els. The results of the model validation exercise appear in Appendix B. We next report the parameter estimates and their implications for our hypotheses about customer churn. Then, we quantify our estimates further by simulating the financial consequences of complaints and recoveries.
Parameter Estimates and Hypothesis Tests
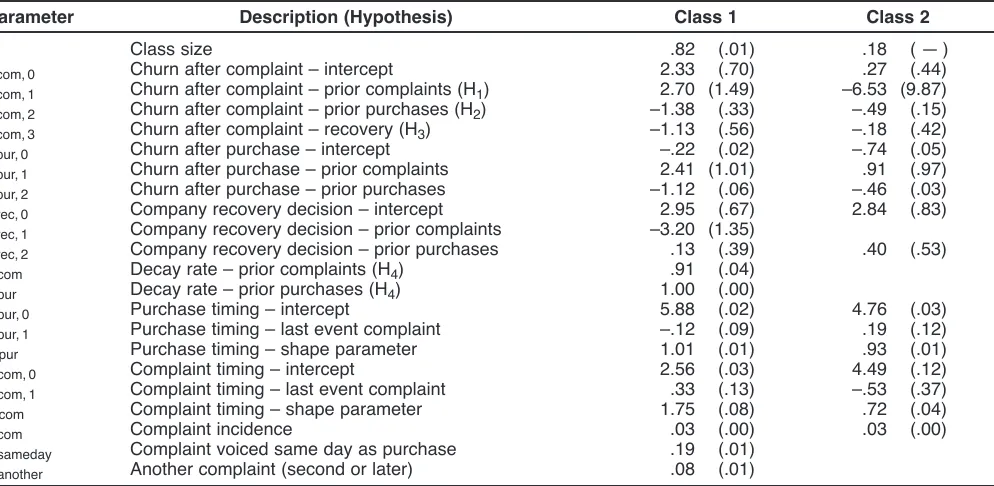
We use the full 130-week sample to calibrate the model and test our hypotheses. Table 1 presents all parameter estimates and standard errors specific to each latent class. Class 1 comprises 82% of the customer base; Class 2 represents the remaining 18%.
The baseline propensity to churn following a complaint
(dcom, 0) is larger in Class 1 than in Class 2. According to
H1, more prior complaints increase the likelihood of churn after a complaint; H2 posits that more prior purchases decrease the likelihood of churn after a complaint. In Class 1, we find marginal support for H1(dcom, 1= 2.70, t-statistic = 1.82) and strong support for H2(dcom, 2= –1.38, t-statistic = –4.17). In Class 2, we also find strong support for H2
(dcom, 2= –.49, t-statistic = –3.30) but not for H1: the estimate
of prior complaints on churn after a complaint is negative and has a very large standard error. This parameter may not be well identified in Class 2 because the prior complaints variable PCOM is usually very close to 0 when complaints occur in this class.
Consistent with H3, recovery leads to a significant drop in the likelihood of churn following a complaint in Class 1
average customer in our database, the likelihood of churn drops from 67% to 40% if the company provides recovery to the complaint. In the smaller Class 2, the effect of recov-ery is as expected (i.e., negative), but it is not significant. In summary, five out of six coefficients for H1–H3in the two classes are as anticipated; all three coefficients in the large Class 1 are (marginally) significant and one of the two well-identified coefficients in Class 2 is significant at the 1% level.
The baseline propensity to leave the company following a purchase is lower than a complaint for both classes. In Class 1, customer churn following a purchase increases with prior complaints (dpur, 1 = 2.41, t-statistic = 2.38) and decreases with prior purchases (dpur, 2= –1.12, t-statistic = –19.23); the effects are smaller in magnitude but in the same direction for Class 2.
Taken together, what do these estimates imply about the extent of recovery effectiveness? Can the probability of churn after a recovered complaint be less than after a hassle-free purchase? For a customer with one recent purchase and zero prior complaints (HPUR = 1, HCOM = 0), offering recovery reduces the probability of churn from 72% to 46%, but the likelihood of churn after a hassle-free pur-chase is still lower (i.e., 21%). Although this pattern holds for the majority of cases in our data, the model does not completely rule out the paradox. Using our estimates, we can show that churn is more likely after a hassle-free pur-chase than a recovered complaint when the prior purpur-chases variable PPUR is larger than 5.5.2Because this threshold is
extremely high relative to the empirical range found in our data—only 15 of 922 complaints (1.6%)—we can conclude that the conditions under which the paradox occurs are unlikely.
Turning to the recovery decision, we note that the base-line propensity for the company to provide recovery is high because a vast majority of complaints are recovered. Cus-tomers with more (and more recent) prior complaints are less likely to receive a recovery (drec, 1= –3.20, t-statistic = –2.36).3 Customers with more prior purchases are slightly more likely to receive a recovery in both classes, but the coefficient is not significant.
Do the effects of complaints last longer or shorter than purchases (H4)? The decay parameter of complaints lcom= .9121 is significantly lower than the decay parameter of purchases lpur= .9978 (c21= 15.98, p< .01), in support of H4b. One way to quantify how long an effect lasts is its halving time—the number of days it takes for the prior pur-chases or prior complaints variable to lose half its value. The halving time is 315 days for purchases and just 8 days for complaints.4 Thus, the memory for prior purchases is long, whereas complaints are forgotten quickly in the cus-tomer’s purchasing behavior. Taken together, these results imply that unless the customer leaves the company after the first complaint or unless a close second failure occurs, the relationship quickly returns to normal.
Last, we turn to the timing process in Table 1. The Weibull parameter estimates are significantly different from TABLE 1
Parameter Estimates (Standard Errors Between Parentheses)
Parameter Description (Hypothesis) Class 1 Class 2
k Class size .82 (.01) .18 (.— ) dcom, 0 Churn after complaint – intercept 2.33 (.70) .27 (.44)
dcom, 1 Churn after complaint – prior complaints (H1) 2.70 (1.49) –6.53 (9.87)
dcom, 2 Churn after complaint – prior purchases (H2) –1.38 (.33) –.49 (.15)
dcom, 3 Churn after complaint – recovery (H3) –1.13 (.56) –.18 (.42)
dpur, 0 Churn after purchase – intercept –.22 (.02) –.74 (.05)
dpur, 1 Churn after purchase – prior complaints 2.41 (1.01) .91 (.97)
dpur, 2 Churn after purchase – prior purchases –1.12 (.06) –.46 (.03)
drec, 0 Company recovery decision – intercept 2.95 (.67) 2.84 (.83)
drec, 1 Company recovery decision – prior complaints –3.20 (1.35)
drec, 2 Company recovery decision – prior purchases .13 (.39) .40 (.53)
lcom Decay rate – prior complaints (H4) .91 (.04)
lpur Decay rate – prior purchases (H4) 1.00 (.00)
bpur, 0 Purchase timing – intercept 5.88 (.02) 4.76 (.03)
bpur, 1 Purchase timing – last event complaint –.12 (.09) .19 (.12)
apur Purchase timing – shape parameter 1.01 (.01) .93 (.01)
bcom, 0 Complaint timing – intercept 2.56 (.03) 4.49 (.12)
bcom, 1 Complaint timing – last event complaint .33 (.13) –.53 (.37)
acom Complaint timing – shape parameter 1.75 (.08) .72 (.04)
pcom Complaint incidence .03 (.00) .03 (.00)
psameday Complaint voiced same day as purchase .19 (.01)
panother Another complaint (second or later) .08 (.01)
2p
churn_com < pchurn_pur implies that dcom,0 + dcom,1PCOM +
dcom,2PPUR + dcom,3REC < dpur,0+ dpur,1PCOM + dpur,2PPUR.
Setting PCOM = 0 (no prior complaints), REC = 1 (recovery is provided), and rewriting yields PPUR > (dcom,0 + dcom,3 –
dpur,0)/dpur,2– dcom,2).
3As we mentioned previously, we estimate this parameter for
both classes for identification.
4For purchases, the halving time x corresponds to .9978x= .5.
those of an exponential model (c2
4= 596.68, p< .01); thus, we can justify our Weibull timing model on statistical grounds. The estimates indicate that customers in Class 1 purchase almost yearly (356 days) and that the average time until a complaint is voiced (if it is not voiced on the same day as a purchase) is 11 days. Customers in Class 2 pur-chase more frequently (121 days) and take longer to com-plain (110 days); the prior comcom-plaints variable is usually very close to 0 when complaints occur in this class, leading to the earlier identification issue. Complaint incidence (i.e., the probability that a purchase is followed by a complaint rather than a purchase, pcom) is approximately 3% in both latent classes. Approximately 19% of complaints occur on the same day as purchase (psameday), and 8% of complaints are followed by another complaint rather than a purchase (panother).
The Financial Consequences of Complaints and Recoveries
The previous discussion suggests that customer complaints, prior complaints, purchases, and company recovery efforts can have a dramatic impact on customer churn. We next examine the financial consequences of these factors by computing their impact on residual lifetime value (RLV).
There are many possible scenarios to illustrate the financial impact of complaint and recovery and how it inter-acts with prior complaints and purchases. We consider two customer types: a new customer without any repeat pur-chases (the majority of customers in our data) and an estab-lished customer who made five repeat purchases. After the last purchase, there is either no complaint or a complaint that occurs 28 days later. We consider three settings for prior complaints: none, one prior complaint 28 days before the current complaint (i.e., on the day of the most recent purchase), and one prior complaint that occurred only 7 days before the current complaint. Appendix C provides a detailed description of the various scenarios and the proce-dure to compute RLV.
First, we show the effects in Figure 3 for a new cus-tomer with a single purchase. The RLV of this cuscus-tomer is $108 in the absence of a complaint. If this is followed by a complaint 28 days later, the company can decide to recover the complaint, in which case the RLV is $100, or the com-pany can withhold recovery, in which case the RLV is $58. In other words, the value of recovery to the company for a new complaining customer without prior complaints is $100 -$58 = $42. Because the value of recovery is larger than a reasonable estimate of its costs, the company should always recover these complaints.
What if this complaint were not the first made by this new customer? If she had made a complaint in the recent past (7 days earlier), her RLV drops to $57 if the company provides recovery for the current complaint and $39 if no before the current complaint, the RLV is $89 if recovery is
provided and $52 if it is not provided—still less than if no prior complaint had occurred but substantially more than when the prior complaint occurred 7 days earlier; the effect of prior complaints diminishes rapidly.
Figure 4 shows the analogous results for an established customer with five repeat purchases. The hassle-free RLV is $221. If this customer complains 28 days after her last pur-chase and the company provides a recovery, the RLV is $217, almost the amount it would be in the case of no com-plaint. If no recovery is provided, the RLV drops to $179, implying that the value of recovery for an established cus-tomer without prior complaints is $217 – $179 = $38. If
FIGURE 4
RLV as a Function of Prior Complaints and Recovery for an Established Customer (Five
Repeat Purchases)
Recovery No recovery FIGURE 3
RLV as a Function of Prior Complaints and Recovery for a New Customer (Zero Repeat
Purchases)
there is a recent prior complaint (7 days before the current complaint), RLV drops to $166 with recovery and to $118 without recovery; the value of recovery is $166 - $118 = $48. If there is a more distant prior complaint (28 days before the current complaint), RLV again lies between the amount it would be in cases without any prior complaint and those with a complaint 7 days earlier. Taken together, the value of recovery is slightly higher for new customers ($42) than for established customers ($38) when there are no prior complaints, but this pattern is reversed when a prior complaint is present and a second complaint occurs ($18 and $48 if the prior complaint was 7 days earlier).
Implications
Implications for Theory
Our study is the first to integrate complaint management with customer base analysis. In contrast to the extant litera-ture, we take the company’s perspective by studying the effects of actual customer complaints and company recov-eries on actual customer purchasing. This is a key point of differentiation; virtually all previous studies have measured recovery effectiveness with survey-based metrics such as satisfaction or repurchase intentions (Parasuraman 2006). We tested three fundamental hypotheses from the services literature stream using actual behavior and a new hypothe-sis regarding the duration of the effects of prior purchases and complaints on the customer relationship. Our approach and findings have several implications for theory.
Customer churn as a self-selection mechanism. Consis-tent with H1, longitudinal survey evidence (Maxham and Netemeyer 2002), and attribution theory (Folkes 1984), customer complaints are more harmful if the customer has complained before. But how long do the negative effects last? Extant theory has suggested that negative experiences are more memorable than positive ones (e.g., Baumeister et al. 2001). Yet we find the opposite: the effects of complaints are short-lived, with a half-life of just eight days, much shorter than those of purchases (H4b).
We can reconcile these findings by considering the role of customer churn as a self-selection mechanism (Hausman and Wise 1979). Customers sort themselves following a complaint. Those who are most dissatisfied drop out of the customer base; those who remain are willing to give the company another chance. Sorting effects have been docu-mented in the customer base (e.g., Fader and Hardie 2010) and pricing (e.g., Danaher 2002) literature streams but have received scant attention in service recovery research. A key implication is that if all complaints voiced by customers— both those likely to churn and those likely to stay—are con-sidered, the duration of negative effects of complaints on future purchasing is likely to be overstated.
Relationship building by transaction building. Accord-ing to extant literature, prior satisfaction creates a buffer that mitigates the negative impact of a failure on current satisfaction, trust, and purchase intentions (e.g., Tax, Brown, and Chandrashekaran 1998; Van Doorn and Verhoef 2008). Consistent with this finding, we observe that prior
purchases alleviate the effect of a complaint on churn (H2). Importantly, we find that the impact of prior purchases is long-lasting, with a halving time of almost one year—a finding that, to the best of our knowledge, has not been con-sidered in prior research. Whereas customer base research has suggested that recency of last purchase is often more crucial than the number of prior purchases (e.g., Kumar and Reinartz 2012), our results suggest that purchase frequency may actually be the most important driver of postcomplaint response; this indicates that the number of prior purchases is a simple but good proxy for the strength of the customer relationship (e.g., Hess, Ganesan, and Klein 2003).
Measuring recovery effectiveness with customer behav-ior. Estimates of recovery effectiveness reported in the lit-erature vary widely and range from a null effect (e.g., Bolton 1998; Van Doorn and Verhoef 2008) to the case in which recovery more than offsets the loss associated with a complaint—the recovery paradox (e.g., Maxham and Nete-meyer 2002; Smith and Bolton 1998). In contrast to these studies, our results are based on actual complaint, recovery, and purchase behavior. We show that recovery has a sub-stantial impact on churn (H3), mostly offsetting the loss associated with a complaint, but we find little evidence of the recovery paradox. Given the weak link between inten-tions and behavior (e.g., Chandon, Morwitz, and Reinartz 2005; Gupta and Zeithaml 2006), it is important to use behavioral data to estimate recovery effectiveness.
Implications for Managers
Our model and empirical results offer several new implica-tions for managers. We take a first step toward a decision support system using customer base analysis for financially accountable service recovery.
Recovery based on costs and benefits. Although the basic concept of using cost–benefit analysis to determine recovery is straightforward and has been in use for more than 20 years, to the best of our knowledge, no article has put it into practice. For example, Rust, Subramanian, and Wells (1992) provide a conceptual illustration in which recovery lifts a repurchase rate from 60% to 90%; they explain that if RLV of a retained customer is $200, recovery is cost effective until (.90 – .60) ¥ $200 = $60. Goodman (2006) offers a similar calculation. Although these back-of-the-envelope calculations are insightful, they require sev-eral strong assumptions about RLV and how complaints affect the customer’s churn probability (and thus RLV). Another complication is that in noncontractual settings, customer churn is unobserved, making it difficult to quan-tify. Our approach addresses these issues.
from occurring because recovery is costly and does not result in a “better” customer compared with the hassle-free case. Although we cannot make precise claims about how much to invest in failure prevention, our results imply that it is better to prevent than recover if prevention is suffi-ciently cheap.
Do not always prioritize new customers. A widespread belief is that managers should focus recovery resources on new customers because their preferences are most influ-enced by negative disconfirmation (e.g., Bolton 1998; Rust et al. 1999). Unlike previous studies, we consider long-term financial impact, and our findings add an important quali-fier to this result. Our value-of-recovery calculations show that it is most profitable to provide recovery to an estab-lished customer when there is a recent complaint; such cus-tomers may not feel appreciated enough if recovery is refused and the previous incident is still fresh. Furthermore, even without any prior complaint, the value of recovery was only slightly higher for new than for established customers. Although the likelihood of churn for new customers is indeed affected most by the company’s recovery decision, the expected future profits at stake are smaller; both deter-mine the value of recovery.
Further Research
There are several ways to extend this research. Future scholars could add behavioral complexity to the model by breaking up complaints and recoveries into specific types or dimensions (e.g., Smith and Bolton 1998; Tax, Brown, and Chandrashekaran 1998), including interactions between complaint and recovery types (Smith, Bolton, and Wagner 1999). Furthermore, our model can be extended by making the purchase timing process dependent on customers’ prior purchases and complaints and whether complaints are recovered.5It would also be useful to develop an approach that accounts for word of mouth or other network effects across customers to capture the impact of such customer interactions on churn and, ultimately, RLV (Hogan, Lemon, and Libai 2003). Collecting self-reported perceptual mea-sures, such as customer satisfaction, and merging them with longitudinal purchase and complaint data (Gupta et al. 2006; Gupta and Zeithaml 2006) could comprise the back-bone of any company’s service-quality information system and allow for a more detailed assessment (Berry and Para-suraman 1997).
Although we have investigated the consequences for churn, we have ignored the aggregate-level implications for customer equity and company value (Gupta, Lehmann, and Stuart 2004; Rust, Lemon, and Zeithaml 2004). Companies that have superior recovery capabilities may enjoy greater customer acquisition and are likely to have a greater
inter-action orientation (Ramani and Knox 2014) and, thus, bet-ter customer relationships and higher profits (Ramani and Kumar 2008). Although there are several good examples of companies with a reputation for superior recovery capabili-ties (e.g., Zappos.com), there is scant research systemati-cally linking recovery and customer equity. Furthermore, although we focus on the consequences of complaints, studying their antecedents within the company (e.g., prod-uct or service failures, service quality) would shed more light on the relative merits of preventing failures and recov-ering from failures.
Last, from a more methodological point of view, manual coding could be replaced with automated content analysis of the complaint log file to take full advantage of promising innovations in electronic text mining (Coussement and Van den Poel 2008; Kanaracus 2008). We hope this work will inspire further research on these and other topics.
Appendix A: Derivation of
Likelihood
In this appendix, we provide the derivation of the (log-) likelihood function. We first derive it for one latent class and then extend it to multiple latent classes. We treat all purchases and complaints as separate events, implying that a purchase and a same-day complaint have different indices j. There are three types of events:
COMi, j RECi, j
1. Purchase 0 0 2. Complaint without recovery 1 0 3. Complaint with recovery 1 1
Initial Event
For each customer, the initial event j = 1 is a purchase with timing ti, 1= 0. Because this event occurs with probability 1, it does not show up in the likelihood.
Repeat Events
Repeat event j = 2, ..., Jionly occurs if the customer did not churn after the previous event; timing and type also depend on the last event. If the previous event was a purchase, it follows from the flowchart in Figure 2 that the probability of the current event being a purchase with timing ti, j (rela-tive to the last event) is given by
(A1) (1 – pchurn_pur, i, j – 1)(1 – pcom)fpur(ti, j),
and the probability of a complaint without recovery and with timing ti, jis
where the indicator function I(ti, j= 0) equals 1 if ti, j= 0 and 0 otherwise. Similarly, the probability of a complaint with recovery and timing ti, jis
(
)
( )
(
)
(
)
− π π π
× − π − π
(
)
(
)
− =
− =
(A2) 1
1 f t 1 ,
churn _ pur, i, j 1 com sameday
I t 0
sameday com i, j
1 I t 0
rec, i, j
i, j
i, j
5We compared the average noncensored postcomplaint
If the previous event was a complaint, the probabilities
for a complaint without and with recovery, respectively. Combining Equations A1–A5 yields
Silent Period After Customer’s Last Event
The silent period of length Tsilent,ibetween the customer’s last observed event and the end of the observation period implies either that the customer became inactive after the last event or that the next event (purchase or complaint) occurred beyond the observation horizon. If the last event Ji of customer i was a purchase, the probability that the cus-tomer became inactive is pchurn_pur,i,Ji, and the probabilities of a purchase or a complaint outside the observation period are
respectively, where
are the survival function counterparts of fpur(ti,j) in Equation 1 and fcom(ti,j) in Equation 3. Analogously, if the last event
(A6) L 1
churn _ pur, i, J com sameday com silent, i
i
was a complaint, the probability that the customer became inactive is pchurn_com, i, Ji, and the probabilities of a purchase or a complaint outside the observation period become
respectively. Combining all possible cases yields
Likelihood Function (per Customer per Latent Class)
Using Equations A6 and A7, the likelihood for customer i is given by
where, by convention, the empty product has a value of 1.6
Log-Likelihood Function with Latent Classes
If we denote the value of Equation A8 resulting from the parameter values in class z by Li|z, the log-likelihood func-tion with Z latent classes and N customers is given by
where the relative class sizes kzsum to 1 across classes.
Appendix B: Model Validation
To validate our model, we compare our model’s predictions with two benchmark models. First, we fit a two-class nested “purchase-only” model: complaint incidents and churn after complaints are excluded. Second, we fit the BG/NBD model (Fader, Hardie, and Lee 2005a), which uses the prior purchase summary statistics recency and frequency to fore-cast future purchasing. Because both models ignore the role of complaints, they also ignore the role of the company’s recovery decision. Furthermore, they ignore the endogene-ity correction, which has been shown to diminish predictive performance in holdout samples (Ebbes, Papies, and Van
silent, i churn _ pur, i, J com sameday
silent, i com silent, i
1 COM
silent, i churn _ com, i, J
silent, i churn _ com, i, J another pur silent, i
silent, i churn _ com, i, J another com silent, i COM
churn _ com, i, J another pur silent, i
churn _ com, i, J another com silent, i
i
Heerde 2011). Thus, the reported predictive performance of our model is conservative.
We calibrate all models using the first 104 weeks (i.e., two years) and validate them using the remaining 26 weeks (i.e., six months). Because there are no closed-form expres-sions for expected future purchasing in the complaints and purchase-only models, we must simulate future purchases, complaints, and churn following these two types of events. If there is a future complaint, we simulate whether the com-pany provides a recovery using the model estimates of Equation 8. Each latent class has its own parameter esti-mates (Table 1); we simulate from each class separately and combine these simulations with the probabilities of class membership to forecast the expected unconditional future purchases. We use 1,000 simulations to forecast future pur-chasing. The standard error of the forecasts in the com-plaints model is low, on average .007 purchases.
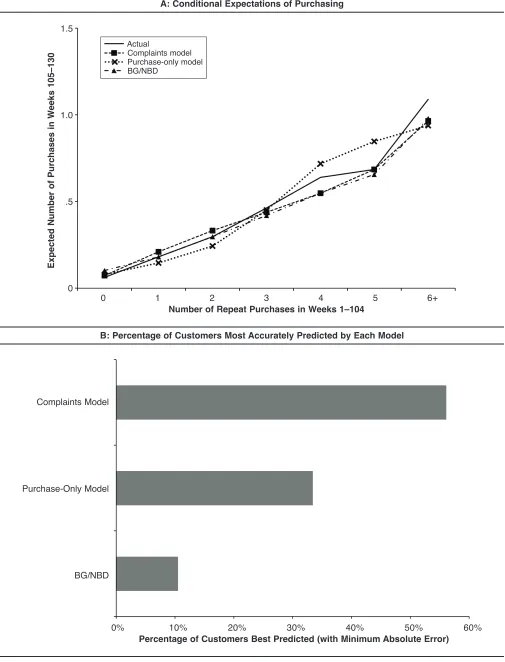
We judge model fit using two methods. Following the customer base literature stream (e.g., Fader, Hardie, and Lee 2005a, b; Van Oest and Knox 2011), we divide cus-tomers into groups according to how many repeat purchases they made in the calibration period (0, 1, ..., 6+) and com-pute the average number of expected purchases in the vali-dation period in the Panel A of Figure B1. We also count the number of customers best predicted by each model, as mea-sured by the absolute error between the actual number of purchases made by each customer in the validation period and the model predictions, in Panel B of Figure B1.
In Figure B1, Panel A, the grouped predictions figure shows that the predictions of the complaints model (dashed line with squares) and the BG/NBD model (dashed line with triangles) are substantially closer to the actual average number of purchases (the solid line) than the purchase-only model (dashed line with crosses). The absolute error is lower for the complaints model than the purchase-only model in five of seven cases.
The performance of the complaints model relative to the BG/NBD model is more difficult to judge. The BG/NBD model is closer to the actual (i.e., has a lower absolute error) in four of seven cases, but the three cases in which the complaints model performs better account for more total customers than the BG/NBD model. For example, the complaints model has a lower absolute error than the BG/NBD model for the 9,897 customers who made zero repeat purchases in the calibration period, the largest group. Thus, we turn to Figure B1, Panel B, to observe, customer by customer, which model predicts best (in terms of having the lowest absolute error). Panel B shows that the com-plaints model provides the best predictions for the majority of the customer base (56%). Therefore, we conclude that the complaints model characterizes future purchasing better than the purchase-only model and the BG/NBD.
Appendix C: Simulation Procedure
for RLV
The Scenarios Considered
We always calculate RLV standing immediately after the last event, either a purchase or a complaint. We consider
two customer types: a new customer without any repeat purchases (the majority of customers in our data) and an established customer who made five repeat purchases, which we assume split our observation period of 2.5 years evenly so that each interpurchase time is 182 days. If there is no complaint (the hassle-free case), the last event is a purchase, and we calculate RLV standing immediately after the last purchase. If the last event is a complaint, we assume it occurs 28 days—the empirical average time until a com-plaint is voiced—after the last purchase, and we calculate RLV assuming that we stand immediately after this last com-plaint. If the last event is a complaint, (1) it may be the only complaint voiced (no prior complaints from this customer), (2) there may have been a prior complaint voiced 28 days before the current complaint (i.e., on the day of the most recent purchase), or (3) there may have been a prior com-plaint that occurred only 7 days before the current comcom-plaint.
Procedure to Compute RLV
Fader, Hardie, and Lee (2005b) derive an expression for the RLV of an already acquired customer, conditional on observed behavior, by combining a model for the interpur-chase time and churn processes with a separate model for profit per transaction. We follow the same path by simulat-ing future purchases, complaints, and churn followsimulat-ing these two types of events until the inactive state is reached (i.e., for the entire residual lifetime of each customer). In the process, we keep track of (simulated) prior purchases and complaints. If there is a complaint, we simulate whether the company provides a recovery using the model estimates of parameters drec, 0, drec, 1, and drec, 2in Table 1.7We impute the company’s cost of providing recovery to a future com-plaint at $20.8We arrive at this cost estimate by considering a lost shipment: the average order size is $57.32, and the cost price of the shipped goods is 26% of this amount (i.e., approximately $15); we assume the reshipment itself costs approximately $5, resulting in $20 in total. Similar to Schweidel and Knox (2013), we simulate separately for each latent class and combine these estimates with the probabilities of class membership.9We simulate purchase amount from a gamma-gamma distribution (Colombo and Jiang 1999; Fader, Hardie, and Lee 2005b). The annual dis-count rate is 10%.
7Instead of using the recovery model in Equation 8 for future
complaints, we also considered a policy of “always recover” or “never recover,” on the basis of the company’s response to the cur-rent complaint, which we manipulate in the various scenarios. The RLV results did not differ by more than 12%, and the substantive findings remained unaffected.
8The RLV results change by less than 2% if the cost of recovery
is reduced from $20 to $0; they do not critically depend on the cost of recovery.
9We weigh the classes by their posterior probabilities to
0 1 2 3 4 5 6+ 1.5
1.0
.5
0
Number of Repeat Purchases in Weeks 1–104
Ex
p
e
c
te
d
N
u
m
b
e
r
o
f
Pu
rc
h
a
s
e
s
i
n
W
e
e
k
s
1
0
5
–
1
3
0
FIGURE B1
Model Comparison Forecasts of Future Purchasing
A: Conditional Expectations of Purchasing
B: Percentage of Customers Most Accurately Predicted by Each Model Actual
Complaints model Purchase-only model BG/NBD
10% 20% 30% 40% 50% 60%
0% Complaints Model
Purchase-Only Model
BG/NBD
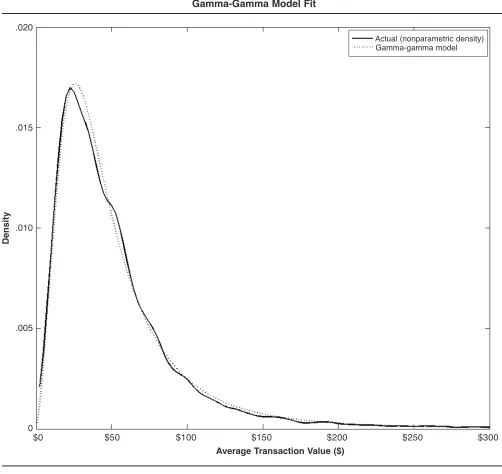
Parameters and Fit of Gamma-Gamma Model for Purchase Amounts
The maximum likelihood estimates of the gamma-gamma distribution (following the notation in Fader, Hardie, and Lee 2005b) are pˆ = 2.67, qˆ = 3.85, gˆ = 58.52. The model prediction of the overall mean purchase amount is $54.82,
close to the actual overall mean of $57.32. We visualize the fit of the gamma-gamma distribution by comparing it with the actual distribution (using kernel smoothing) in Figure C1. Overall, the two distributions are very close. At $25, the actual mode is only slightly smaller than the gamma-gamma mode ($26).
Ansari, Asim, Carl F. Mela, and Scott A. Neslin (2008), “Cus-tomer Channel Migration,” Journal of Marketing Research, 45 (February), 60–76.
Baumeister, Roy F., Ellen Bratlavsky, Catrin Finkenauer, and Kathleen D. Vohs (2001), “Bad Is Stronger than Good,” Review of General Psychology, 5 (4), 323–70.
Berry, Leonard L. and A. Parasuraman (1997), “Listening to the Customer—The Concept of a Service-Quality Information System,” MIT Sloan Management Review, (April 15), 65–76.
REFERENCES
Anderson, Eugene W. and Mary W. Sullivan (1993), “The Antecedents and Consequences of Customer Satisfaction for Firms,” Marketing Science, 12 (2), 125–43.
Andreassen, Tor Wallin (1999), “What Drives Customer Loyalty with Complaint Resolution?” Journal of Service Research, 1 (4), 324–32.
——— (2001), “From Disgust to Delight: Do Customers Hold a Grudge?” Journal of Service Research, 4 (1), 39–49.
FIGURE C1
Gamma-Gamma Model Fit
$0 $50 $100 $150 $200 $250 $300
.020
.015
.010
.005
0
Average Transaction Value ($)
D
e
n
s
ity