CORPORATE
FINANCIAL
ANALYSIS
with
MICROSOFT
FRANCIS J. CLAUSS
New York Chicago San Francisco Lisbon London Madrid Mexico City Milan New Delhi San Juan Seoul Singapore Sydney Toronto
CORPORATE
FINANCIAL
ANALYSIS
with
MICROSOFT
prior written permission of the publisher.
ISBN: 978-0-07-162884-6
MHID: 0-07-162884-3
The material in this eBook also appears in the print version of this title: ISBN: 978-0-07-162885-3, MHID: 0-07-162885-1.
All trademarks are trademarks of their respective owners. Rather than put a trademark symbol after every occurrence of a trademarked name, we use names in an editorial fashion only, and to the benefit of the trademark owner, with no intention of infringement of the trademark. Where such designations appear in this book, they have been printed with initial caps.
McGraw-Hill eBooks are available at special quantity discounts to use as premiums and sales promotions, or for use in corporate training programs. To contact a representative please e-mail us at [email protected].
This publication is designed to provide accurate and authoritative information in regard to the subject matter covered. It is sold with the understanding that neither the author nor the publisher is engaged in rendering legal, accounting, or other professional service. If legal advice or other expert assistance is required, the services of a competent professional person should be sought.
—From a Declaration of Principles Jointly Adopted by a Committee of the American Bar Association and a Committee of Publishers
TERMS OF USE
This is a copyrighted work and The McGraw-Hill Companies, Inc. (“McGraw-Hill”) and its licensors reserve all rights in and to the work. Use of this work is subject to these terms. Except as permitted under the Copyright Act of 1976 and the right to store and retrieve one copy of the work, you may not decompile, disassemble, reverse engineer, reproduce, modify, create derivative works based upon, transmit, distribute, disseminate, sell, publish or sublicense the work or any part of it without McGraw-Hill’s prior consent. You may use the work for your own noncommercial and personal use; any other use of the work is strictly prohibited. Your right to use the work may be terminated if you fail to comply with these terms.
Contents
Preface
vii
Introduction: An Overview of Financial Management
xi
1:
Corporate Financial Statements
1
2:
Analysis of Financial Statements
35
3:
Forecasting Annual Revenues
69
4:
Turning Points in Financial Trends
123
5:
Forecasting Financial Statements
167
6:
Forecasting Seasonal Revenues
185
7:
The Time Value of Money
213
8:
Cash Budgeting
251
9:
Cost of Capital
291
10:
Profit, Break-Even, and Leverage
317
12:
Capital Budgeting: The Basics
363
13:
Capital Budgeting: Applications
401
14:
Capital Budgeting: Risk Analysis with Scenarios
435
15:
Capital Budgeting: Risk Analysis with Monte Carlo Simulation
455
Epilogue
485
Preface
In today’s global economies, spreadsheets have become a multinational language. They are the tools of choice for analyzing data and communicating information across the boundaries that separate nations. They have become an important management tool for developing strategies and assessing results.
Spreadsheets have also become an important tool for teaching and learning. They have been widely adopted in colleges and universities. They have the advantage of being interactive, which makes them ideal for teaching on the Internet as well as self-learning at home.
Corporate Financial Analysis with Microsoft Excel teaches both financial management and spread-sheet programming. Chapters are organized according to the essential topics of financial management, beginning with corporate financial statements. The text discusses management principles and provides clear, step-by-step instructions for using spreadsheets to apply them. It shows how to use spreadsheets for analyzing financial data and for communicating results in well-labeled tables and charts. It shows how to be better managers and decision makers, not simply skilled spreadsheet programmers.
working knowledge of a variety of financial functions available in Excel for such things as the time value of money and the payoffs of capital investments. He or she will also know how to use Excel’s powerful tools for forecasting, doing sensitivity analysis, optimizing decisions, and using Monte Carlo simulation to evaluate risks. In short, anyone who studies the text will acquire a toolbox of spreadsheet skills that will help him or her understand and apply the principles of financial management—and be better prepared for a successful career in the business world.
Models Rather Than Solutions
Corporate Financial Analysis with Microsoft Excel shows how to create models that provide realistic infor-mation. Unlike pocket calculators, which are limited in their output, spreadsheet models can supply solu-tions over a wide range of condisolu-tions and assumpsolu-tions. Models help identify what must be done to achieve desired results, determine the best strategies and tactics for maximizing profits or minimizing losses, iden-tify conditions that must be avoided, or prepare for what might happen. Learning from models is cheaper, faster, and less hazardous than learning from real life. Spreadsheet models make this possible.
Managing Risks
Global competition puts a premium on the ability to handle risk. Although it may not appear as a separate item in a CFO’s job description, risk assessment underlies all financial decisions. Risk is a high-stakes game of “What if?” analysis. Corporate Financial Analysis with Microsoft Excel shows how to use Monte Carlo simulation and other spreadsheet tools to gamble like a professional—without the cost. A bit of intelligent programming is the only ante needed to play the game. Spreadsheets help define the risks due to uncertain customer demands, the ups and downs of business cycles, changes by competitors, and other conditions outside a manager’s control. In place of expensive experiments or learning in the school of hard knocks, you can use spreadsheet models to assess the risks and impacts of contemplated actions without actually taking them.
Teamwork
Increased worldwide competition and a market-driven economy have forced corporations to restructure their functional hierarchies in ways that promote teamwork. Rigid hierarchies that once divided finance, marketing, production, quality control, and other business functions are disappearing. In their place, functions and responsibilities are being shared in tighter alliances between areas of specialization. These changes extend outside corporate walls to subcontractors and suppliers.
The Enabling Role of IT
Better Than Algebra
Most students are already familiar with spreadsheets by the time they enter college or complete their fresh-men year. It is safe to say they understand the basic principles of spreadsheets better than those of algebra. Row and column labels transform the values in a spreadsheet’s cells into concrete concepts rather than the abstract notations of algebraic formulas. They help one visualize the logical relationships between vari-ables much better than equations with Xs and Ys. Spreadsheets simply provide a better way than algebra to learn any subject that involves understanding numbers.
Communicating
Spreadsheets are used to prepare tables and charts for making presentations that can be easily understood by others and that justify recommended courses of action. Spreadsheets are much more than sophisticated calculators. They are “digital storytellers” that can help you get your message across to others.
A Proven Text
Corporate Financial Analysis with Microsoft Excel is the result of the author’s use of spreadsheets for teach-ing financial management over a four-year period. Classes have been conducted at both the graduate and undergraduate level. The text has been used for teaching in a classroom as well as for distance-learning on the Internet (via the CyberCampus system at Golden Gate University in San Francisco).
Skills Pay the Bills
Students have found that spreadsheets make learning easier and enhance their understanding of the complexities of financial management. The spreadsheet skills they have acquired have helped many of the author’s students gain employment and earn raises and promotions. That is the success story related by numerous students who have studied Corporate Financial Analysis with Microsoft Excel and applied its teachings.
Understanding
An Appreciation
The author has been blessed with an outstanding bunch of students in his graduate classes. Most were working full time to support themselves and their families while attending “distance-learning” classes on Golden Gate University’s CyberCampus. They were mature, most with 10 to 20 years of real-life business experience. Their jobs ranged from entry level to managers and executives, with a few CFOs, CEOs, and vice presidents. They were eager to learn and invested a great deal of their time in doing the weekly homework assignments and posting their responses to my questions for discussion. They shared their experiences and how they coped with problems. Their places of business and their experience were worldwide—one of the advantages of teaching a class on the Internet. Their feedback has been invalu-able in shaping and improving Corporate Financial Analysis with Microsoft Excel, The author is deeply indebted to them.
Introduction
An Overview of Financial Management
Before plunging into the creation of Excel models for financial management, it is worth a brief stop to look at the following:
• The functions and responsibilities of financial managers
• The position of financial managers and their functions in a corporate hierarchy
• The relationship of financial management to other functions, such as production and opera-tions, marketing, sales, and quality control.
• The importance of teamwork and communications
• The role of information technology in financial management • The role of spreadsheet models in financial management
Functional Specialization and Linkages
Today’s corporations need many talents—more than any individual or business discipline can provide. Here are a just a few of the more obvious business functions that need different talents:
• Serving customers
• Manufacturing a variety of products
• Investing in facilities and equipment
• Controlling the quality of goods and services • Ordering and receiving goods from suppliers. • Distributing goods to worldwide markets • Paying workers and suppliers
• Hiring workers with various types and levels of skills • Collecting sales revenues from customers
• Managing short-term investments and borrowings
Individuals with the different talents needed to operate a business are organized in a hierarchy of departments. At the lowest levels, workers perform the specific functions and responsibilities assigned to them. At the upper levels, managers direct and coordinate the levels below them.
The concept of an organizational structure according to specific functions and responsibilities is simple. Implementing it can be difficult. At their best, business organizations are models of efficiency. At worst, they are wasteful bureaucracies. When bureaucracies run amok, the inevitable results are administrative delays, poor service, shoddy products, late deliveries, high costs, alienated customers, and eventual bankruptcy.
Think of a business as a chain consisting of links. Just as a chain is no stronger than its weakest link, so a business organization is no stronger than its weakest function. And just as a chain is a joining of many links to form a structural network, so business organizations are chains of separate functions joined together in a common enterprise.
Financial managers are an essential part of corporate networks. Their functions are inextricably linked to those of other managers, both financial and nonfinancial. Success depends on how well each does his or her job, and how well they work together as separate parts of the same corporate team.
As we develop financial models in the chapters that follow, keep in mind the concept of chains, linkages, and networks—and the need for all parts to work together.
Organizational Charts
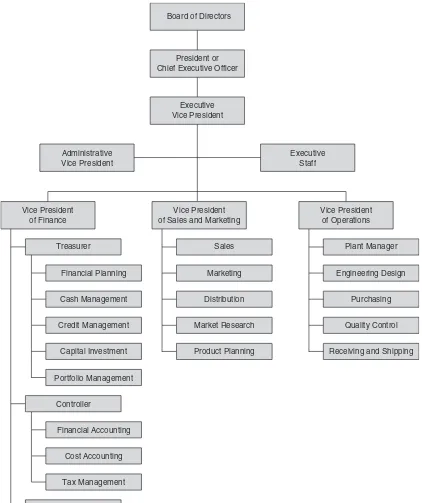
Perhaps the quickest way to get a picture of corporate structures and the roles of financial managers is to look at an organizational chart. Figure 0-1 shows a typical organizational chart of the upper and lower levels of management for a manufacturing company. There are many variations on the chart shown, but this functional layout is generally followed.
A Board of Directors is elected by the company’s stockholders to represent their interests as the company’s owners. A corporate board is headed by a Chairman of the Board and typically has a number of standing committees, such as an executive committee, a finance committee, an auditing committee, a human resources and compensation committee, and others.
Treasurer Administrative Vice President
Executive Staff
Vice President of Operations Vice President
of Sales and Marketing Vice President
of Finance
Board of Directors
President or Chief Executive Officer
Executive Vice President
Cash Management
Credit Management
Capital Investment
Portfolio Management Financial Planning
Sales
Marketing
Distribution
Market Research
Product Planning
Plant Manager
Engineering Design
Purchasing
Quality Control
Receiving and Shipping
Cost Accounting
Tax Management
Data Processing Controller
Financial Accounting F i g u r e 0 - 1
are common in large companies. A firm’s legal counsel is usually part of the executive staff. Members of the staff have advisory positions rather than line or functional responsibilities.
The vice presidents of finance, sales and marketing, and operations are line positions that are responsible for actually carrying out the company’s business. The vice president of finance is usually the company’s chief financial officer (CFO). The essential functions of financial management are separated between those reporting to the company’s treasurer and those reporting to its controller. Data processing is an important support function under the vice president for finance, although it is often a function at the vice-presidental level itself.
The details of how functions and responsibilities are organized vary from company to company and from industry to industry. Therefore, the organizational chart of any company will differ in details from Figure 0-1.
The structure shown in Figure 0-1 for financial management is common to many types of com-panies. The structures for sales and marketing and for operations, however, vary with the industry. For example, the vice presidents for sales or sales directors of hotels have separate functional managers under them for marketing to conference groups and to the tour industry. The sales directors of airlines have separate functional managers for passenger sales and cargo sales, as well as administrators responsible for reservations, schedules, and tariffs.
The organizations for companies in service industries also vary from that shown in Figure 0-1, which is typical for a manufacturing company. For example, the operating functions of hotels are divided between a front desk manager, executive housekeeper, chief operating engineer, materials manager, and security manager. The responsibilities of the materials manager are further divided into those for the food and beverage manager, restaurant and café manager, room services manager, and catering manager. Airline operations are divided into flight operations, ground operations, and flight equipment maintenance.
Anyone interested in managing would do well to study organizational charts. Study those of the company for which you work or would like to work. Understand the functions and responsibilities that go with each box, and how the boxes are related to each other. Do the same with the organizational charts of other firms that are available, especially those of competitors. Learn how companies are organized and how your functions and responsibilities interface with others. Companies value employees who know how to be members of their team.
A Quick Look at the F&Rs of Chief Financial Officers
activities, such as: deciding the firm’s capital structure (i.e., determining the best mix of debt, equity, and internal financing); deciding how to invest the company’s money, taking into consideration risk and liquidity; and managing cash inflows and outflows. The third deals with strategic planning. This is a forward-looking activity. It includes economic forecasting of the future of the company and the impacts on it of future changes in markets, competition, and the general economy. It includes using forecasts to position the company for future profitability and long-term survival.
Teamwork
Organizational charts show the division of functions and responsibilities. Teamwork is what puts them back together and combines the parts into an effective organization. Success depends on how well the parts work as a team. Collaboration is more than just a good idea; it is the only way to survive the chal-lenges that confront modern corporations.
As companies grow in size, the administrative levels between executives at the top and workers at the bottom grow in number. The administrative levels form a loop that routes directions and commands down to the line organizations, which actually provide service and goods to customers, and then collects information at the working level and passes it up in the form of reports to those at the top. Top-heavy structures discourage teamwork and reduce efficiency.
Entrenched ways of thinking or doing business are difficult to displace. A crisis is often needed to provide the impetus for change. World War II was such a crisis. It brought together the team that created the world’s first atomic bomb, the weapon that hastened the end of World War II.
The code name for the atomic bomb’s development was the Manhattan Project. It assembled a team of scientists, led by the brilliant physicist J. Robert Oppenheimer, and sequestered them in an isolated community in the Jemez Mountains of New Mexico. That community became the city of Los Alamos. The team was given the unlimited support of the U.S. government under the direction of Major General Leslie R. Groves. The incredibly complex technical details of the bomb’s development need not be recited here. What is significant is that the members of the team surmounted all the problems and deto-nated the first man-made atomic explosion at the Trinity Site in New Mexico on July 16, 1945. The team accomplished this feat in only 28 months. To put this accomplishment in perspective, Detroit automakers still take three years or more to design a new automobile and get it into production.
The demonstration at Trinity Site was followed three weeks later, on August 6, with the dropping of the first atomic bomb on Hiroshima, Japan. On August 9, a second bomb was dropped on Nagasaki. Japan gave up the struggle five days later. On September 2, formal surrender ceremonies were held aboard the battleship USS Missouri that ended World War II.
Despite opposition to change, the concepts of interdisciplinary teamwork that succeeded at Los Alamos are being applied today to make corporations more effective and competitive. Their focus is on doing a job, not on maintaining an organization. The purpose of the organization is to do the work, rather than the purpose of the work is to justify an administrative hierarchy. Corporate restructuring is based on that simple concept—to determine how best to provide goods and services to customers, and then to organize the functions around the activities and processes for doing the work.
The concept of teamwork appears throughout this book. In real life, it is often disguised as a buzzword like “concurrent design” when discussing product design and the interactions between design engineers, manufacturing specialists, and procurement personnel. Financial managers use the term “activity-based costing” for accounting systems that identify the activities and organizations responsible for costs rather than collecting costs at an aggregate level, which rather defeats the purpose of cost control. (The impor-tance of activity-based costing is discussed in Chapter 8: Cash Budgeting.) Other terms are “total quality management” or “TQM” when the focus is on product quality, and “Just-in-Time” or “JIT” when discuss-ing inventory management. Learn the buzzwords because they are part of today’s jargon. More than that, learn what they really mean, and don’t let any huckster con you into a myopic view of how to apply them. Many with shortsighted understandings failed when they tried to implement buzzword concepts without recognizing their widespread consequences. The true essence of each is teamwork—truly corporate-wide teamwork that enlists personnel in the corporate enterprise regardless of their workplaces and to whom they report.
In terms of the organizational structure of Figure 0-1, teamwork means eliminating the up-and-down ladders of administrative levels that keep workers from working together. Instead of imposing vertical movements along “chains of command,” the corporate structure is “flattened out” so that workers can move horizontally between organizations and work as teams.
Information Technology and Management
Computer-based management information systems (MISs) are management tools that facilitate team-work. Their development can be traced to computer-based cost accounting systems and to the Materials Requirements Planning systems introduced into factories in the 1970s. Today’s MISs are corporate-wide. They go by various names, such as Enterprise Planning Systems. In a very real sense, they replace the rungs on administrative ladders.
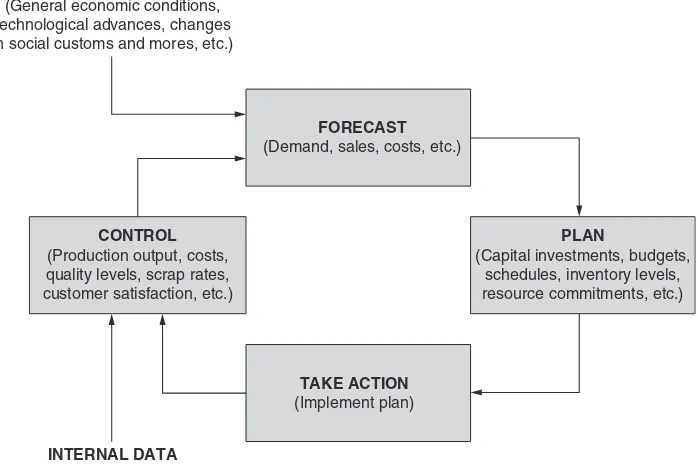
Figure 0-2 shows the Forecast-Plan-Implement-Control Loop that is an important part of an MIS. Each box contains a brief summary of what it should contain.
Information technology and MISs have expanded the boundaries of teamwork. It is no longer neces-sary or desirable to sequester team members in an isolated community that forces them to work together, as in the wartime Manhattan Project. Members of international teams now communicate in computer-based languages they all understand, draw data for analysis from common databases, and exchange infor-mation at electronic speeds.
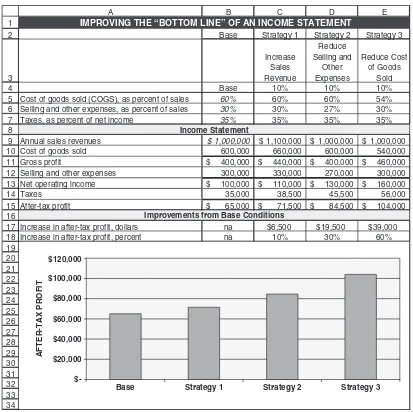
Figure 0-3 is a simple example of the concept of using information technology to show organiza-tional linkages and promote understanding and teamwork. It is a spreadsheet that shows the essential ele-ments of a corporate income statement, and the results of different strategies to improve profits. (We will look at the details of income statements and other financial statements in the first and later chapters.) The spreadsheet is simply a matrix of rows and columns for organizing the information. To simplify discussion, the row numbers and column code are included in Figure 0-3.
Column B shows the base conditions. The company has annual revenues of $1 million (Cell B9). Its cost of goods sold (COGS) is 60 percent of the sales revenues, its selling and other expenses are 30 percent of the sales revenues, and its tax rate is 35 percent of its net operating income (Cells B5:B7). With these starting values, COGS is computed as $600,000 in Cell B10 (i.e., 60% of $1 million, or the product of the values in Cells B5 and B9) and the firm’s gross profit is computed as $400,000 in Cell B11 (i.e., revenues of $1 million in Cell B9 minus COGS of $600,000 in Cell B10). Selling and other expenses are
F i g u r e 0 - 2
The Forecast-Plan-Implement-Control Loop of Management Information Systems
EXTERNAL DATA (General economic conditions, technological advances, changes in social customs and mores, etc.)
FORECAST (Demand, sales, costs, etc.)
PLAN
(Capital investments, budgets, schedules, inventory levels, resource commitments, etc.) CONTROL
(Production output, costs, quality levels, scrap rates, customer satisfaction, etc.)
TAKE ACTION (Implement plan)
computed as $300,000 in Cell BB12 (i.e., 30% of $1 million, or the product of the values in Cells B6 and B9). Net operating income is computed as $100,000 in Cell B13 (i.e., Cell B11 minus Cell B12). Taxes of $35,000 are computed in Cell B14 (i.e., 35% of $35,000, or the product of the values in Cells B7 and B13). After-tax profit of $65,000 is computed in Cell B15 (i.e., net operating income in Cell B13 minus taxes in Cell B14).
Base Strategy 1 Strategy 2 Strategy 3
Increase
Cost of goods sold (COGS), as percent of sales 60% 60% 60% 54%
Selling and other expenses, as percent of sales 30% 30% 27% 30%
Taxes, as percent of net income 35% 35% 35% 35%
Annual sales revenues $1,000,000 $ 1,100,000 $ 1,000,000 $1,000,000 0
IMPROVING THE “BOTTOM LINE” OF AN INCOME STATEMENT
Improvements from Base Conditions
Base Strategy 1 Strategy 2 Strategy 3
AFTER-TAX PROFIT
F i g u r e 0 - 3
expenses by 10 percent, and strategy 3 is to reduce COGS by 10 percent. Implementing the first strategy requires actions primarily by the sales and marketing organizations, implementing the second requires actions by various organizations, and implementing the third requires actions by the operations orga-nization (e.g., improve any or all of the functions shown in Figure 0-1 for which the vice president of operations is responsible). Note that a change of 10 percent in different functions produces significantly different changes in profits.
Although the example is intentionally simple, it illustrates some important concepts. First, financial results follow from actions in the various parts of a corporation. The results follow a path expressed by the linkages between functions on the organization chart of Figure 0-1. Second, the linkages between orga-nizations and between actions and results can be expressed by entries in the cells of spreadsheets. Third, as a result of the first two, spreadsheets are extraordinarily powerful management tools—not merely for calculating results for given conditions, but also for analyzing the interactions between organizations and for evaluating the impacts of actions taken by different parts of a corporation. It also follows that spread-sheets are powerful management tools for promoting teamwork across organizational boundaries, as well as powerful teaching tools for understanding business functions and their interrelationships.
Communicating
Spreadsheets are much more than sophisticated calculators. Their value is as much for communicating as for calculating. They can help provide transparency into a corporation’s workings. They are easily incor-porated into reports and management presentations.
Successful CFOs need to communicate clearly, fully, and honestly. Failure to do that caused a number of corporate scandals in the recent past. Investors were misled by financial shenanigans at Enron, WorldCom, Global Crossing, and other major corporations that filed for bankruptcy. Between 1997 and 2000, for example, Enron reported an annual growth of 70 percent in its annual revenues and 35 percent in operating profit by moving debt off its books and other accounting tricks. Too late, lenders and other investors discovered that true revenues were lower than reported, debt levels were higher, and prospects for growth were less favorable. They began suing corporations and their executives, threatening them with large dollar penalties and prison terms. In addition to honesty, they insisted on better transparency into corporate performance.
Chief financial officers are no longer narrowly focused on the mechanics of finance. Duties that once were transaction-intensive are now knowledge-intensive.
Today’s CFOs must be forward looking. They are responsible for planning that looks far into the future and across broader markets. They are strategic partners in negotiating global alliances, managing the risks of huge gambles, and organizing new corporate structures. They work closely with corporate boards, the investment community, financial markets, and government regulatory agencies.
Spreadsheets as Tools for Financial Management
Life is complex. The famed naturalist John Muir likened the natural environment to a giant spider web. “Touch just one strand and the whole web vibrates in response,” he pointed out. Corporations are also like giant spider webs of interlocking functions and responsibilities. What happens in one part affects all.
Today, the functional elements of large corporations are linked together by system of computers and software called enterprise management systems. The largest and best known of these are ORACLE and SAS. Such systems do the “heavy lifting” for managing corporate-wide operations. Yet, even in corpora-tions with such systems, many managers have installed Excel on their office computers and use it for accessing information from corporate databases, analyzing it, and preparing reports.
Excel is entirely adequate for handling many business problems. It is more convenient, more acces-sible, and less costly than enterprise management systems. Indeed, using a large enterprise management system to analyze problems that spreadsheets can handle easier and faster is like using an elephant gun to shoot squirrels. Each has its proper place and use.
Excel is essentially a complete small-scale enterprise management system itself with substantial power. Unfortunately, its capabilities are largely under-appreciated and overlooked. Excel can handle much larger problems than most users recognize—including those who have used it for years. It is flexible and can solve a wide diversity of financial and other business problems.
Students in the author’s classes have all, in fact, used Excel before, many for ten years or longer on their jobs. Yet none were fully aware of all that Excel offers for doing their jobs better and easier. Practically none had used it for doing Monte Carlo simulation or sensitivity analysis. Few knew how to use Excel to evaluate the impact of changes in corporate strategies or tactics. Few knew how to use Excel to calculate the risks for operating in an uncertain world. Many, in fact, had been unaware of even such simple Excel tools as sorting, conditional formatting, and regression analysis or the commands for the time value of money. You don’t need an enterprise management system to do these things. What you need is to improve your Excel spreadsheet skills, which is one of this book’s goals.
But sound financial management requires more than spreadsheet skills. This book is also intended to help you apply spreadsheet skills to improve your management skills.
As a financial manager, don’t take a narrow view of your job. Recognize your relationship to others in the business. Understand their functions and responsibilities as well as your own, and how they’re related. Understand the linkages in teamwork and how to make them. Use Excel in any financial analysis to help link the functions in corporate networks, just as enterprise management systems can do. And use Excel to
Corporate Financial Statements
CHAPTER OBJECTIVES
Management Skills
• Identifythethreekeyfinancialstatementsofcorporations(i.e.,theincomestatement,balance sheet,andstatementofcashflows)anddescribetheircontentsandpurposes.
• Followthestandardformatsfororganizingitemsonfinancialstatements. • Interprettheitemsonfinancialstatementsandrecognizehowthey’rerelated. • Recognizewhenerrorshavebeenmadeinfinancialstatements.
Spreadsheet Skills
• Createspreadsheetsforfinancialstatements.
• Organizethecontentofspreadsheetsinlogicalformats.
• Labelrowsandcolumnstocommunicateclearlyaswellastocalculatecorrectly. • Enterdatavaluestoshowthebasisforcalculatedvalues.
• Formulateandenterexpressionstocalculatevalues. • Wraptextinrowsorcolumns.
• Usecellreferencesinexpressionsforcalculatedvaluesthatlinkthecellstoothercellswithdata orothercalculatedvalues.
• Formatvalues.
• Hiderowsorcolumnsoffinancialstatementssothatonlyselectedonesaredisplayed.
• Linkworksheetssothatentriesorvaluesononeworksheetcanbeusedforcalculatingvalueson anotherworksheetinthesameworkbook.
• UseExcel’sFormulaAuditingtooltoexaminecelllinkages.
Overview
A firm’s financial health is summarized in three key financial reports: (1) the income statement, (2) the balance sheet, and (3) the cash flow statement. These reports summarize detailed information on a firm’s financial actions during the preceding fiscal year and its financial position at the end. The Securities and Exchange Commission (SEC) requires every corporation to include these reports in its annual stockhold-ers’ report for at least the two most recent years.
Annual statements cover one-year periods ending at a specified date. For most firms, the ending date is the end of the calendar year. Many large corporations, however, operate on 12-month cycles (or fiscal years) that end at times other than December 31. In addition to annual reports to stockholders, corporations usually prepare monthly statements to guide a corporation’s executives, as well as quarterly statements that must be made available to stockholders of publicly held corporations.
Financial statements are based on values from a firm’s cost accounting system. The statements follow the generally accepted accounting principles (GAAP) recommended by the Financial Accounting Standards Board (FASB), which is the accounting profession’s rule-setting body. In addition to the finan-cial statements, annual stockholders’ reports usually contain the president’s letter and historical summa-ries of key operating statistics and ratios for the past five or ten years.
The information in financial statements is used in several ways. Regulators, such as federal and state security commissions, use it to enforce compliance by providing proper and accurate disclosures to stock-holders and investors. Lenders or creditors use the reports to evaluate the credit rating of firms and their ability to meet scheduled payments on existing or contemplated loans. Investors base their decisions to buy, sell, or hold the corporation’s stock on the information in the reports. Corporate financial managers use the information to ensure compliance with regulatory requirements, to satisfy creditors and shareholders, and to monitor the firm’s performance. They also use the information to determine the value of other firms they are thinking of buying, or the value of their own firms as a basis for negotiating a selling price. Employees peruse financial statements to assess how well their firm is doing and to compare its current performance with earlier periods. Corporate executives and boards of directors often view their annual stockholders’ reports as tools for marketing the company and its products and for building or improving their image.
This chapter shows how to use Excel to prepare financial statements. It defines the meanings of the financial entries and identifies the formulae for using data values of some to calculate values for others. The printouts in this chapter include column headings, row numbers, and grid lines to help identify the cells where the formulas are entered. These can be eliminated when printing the spreadsheets in reports. (Use the Sheet tab on File/Page Setup to show or hide them.)
Notes are included below the title of many spreadsheet printouts in order to identify key cell entries and give other information. These programming notes are intended to help readers understand the modeling process, the expressions for calculating values, and the links between cells.
Preparing a spreadsheet begins with understanding its purpose: who will read it, what items it will con-tain, and how the items are related. Values for the items will be either data values or calculated values.
Some Important Steps for Creating Spreadsheet Models • Provideashort,descriptivetitleatthetop.
• Entershort,descriptivelabelsforthecolumnsandrows.Includeanyunitsinwhichthevalueswillbe
expressed (e.g., $ million, $/day, etc.).
• Entertheknownordatavalues.Check the entries to ensure the data has been entered correctly.
• Enterexpressionsforcalculatedvalues.Check the entries to ensure the expressions and calculated
values are correct. If you understand the logical relationships between items on a worksheet, you will find it easier to recognize and correct errors as they are made rather than locating errors and correcting them after a complex worksheet has been completed.
The Income Statement
Income statements provide a financial summary of a firm’s operation for a specified period, such as one year ending at the date specified in the statement’s title. They show the total revenues and expenses during that time. An income statement is sometimes called a “profit and loss statement,” an “operating state-ment,” or a “statement of operations.” Essentially, it tells whether or not the firm is making money.
Note that the income statement does not show cash flows or reflect the company’s cash position. (The cash flow statement does that.) Certain items, such as depreciation, are an expense although they do not involve a cash outlay. Some items, such as the sale of goods or services, are recognized as income even though buyers have not yet paid for them. Other items, such as purchased materials, are recognized as expenses even though the firm has not yet paid for them. Such income and expense items are recorded when they are accrued (e.g., when sold goods are shipped), not when cash actually flows.
General Format
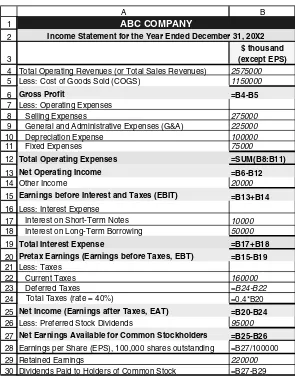
Figure 1-1 shows the basic elements of an annual income statement. It indicates the essential informa-tion that must be provided and the standard format. Annual income statements for large corporainforma-tions are organized in the same format as Figure 1-1. However, they often have a number of subdivisions with additional detail for selected items.
The income statement is organized into several sections. The upper section (Rows 4 to 15 of Figure 1-1) reports the firm’s revenues and expenses from its principal operations. Below that (Rows 16 to 24) are nonoperating items, such as financing costs (e.g., interest expense) and taxes.
F i g u r e 1 - 1
Income Statement for One Year
1
Total Operating Revenues (or Total Sales Revenues) 2,575.0
Less: Cost of Goods Sold (COGS) 1,150.0
Gross Profits 1,425.0
Less: Operating Expenses
Selling Expenses 275.0
General and Administrative Expenses (G&A) 225.0
Depreciation Expense 100.0
Fixed Expenses 75.0
Total Operating Expenses 675.0
Net Operating Income 750.0
Other Income 20.0
Earnings before Interest and Taxes (EBIT) 770.0
Less: Interest Expense
Interest on Short-Term Notes 10.0
Interest on Long-Term Borrowing 50.0
0 60.0 Total Interest Expense
Pretax Earnings (Earnings before Taxes, EBT) 710.0
Less: Taxes
Current Tax 160.0
124.0 Deferred Tax
284.0
Net Income (Earnings after Taxes, EAT) 426.0
Less: Preferred Stock Dividends 95.0
Net Earnings Available for Common Stockholders 331.0
Earnings per Share (EPS), 100,000 shares outstanding $3.31
Retained Earnings 220.0
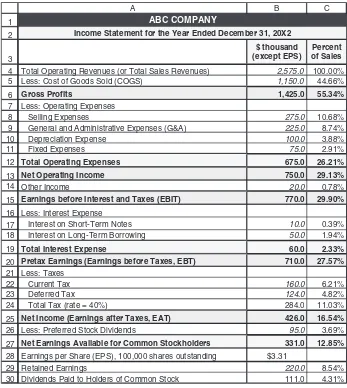
111.0 ABC COMPANY
Income Statement for the Year Ended December 31, 20X2
Italicized values in Cells B4, B5, B8, B9, B10, B11, B14, B17, B18, B22, B26, and B29 are data entries. They are entered as values rounded to the nearest whole dollar (e.g., the entry in Cell B4 is 2750000) and formatted in thousands with one decimal point. Values in the other cells are calculated by the following entries:
B6: =B4-B5 “Gross Profits” equals “Total Operating Revenues” minus “COGS.” B12: =SUM(B8:B11) This command adds entries in cells B8:B11.
B13: =B6-B12 This term is also known as “Net Operating Profits.” B15: =B13+B14
B19: =B17+B18
B20: =B15-B19 Also known as “Net Profits (or Earnings) before Taxes.” B23: =B24-B22 “Deferred Tax” equals “Total Tax” minus “Current Tax.” B24: =0.40*B20 “Total Tax” equals 40% of EBT.
B25: =B20-B24 Also known as “Net Profits (or Earnings) after Taxes.” B27: =B25-B26
B28: =B27/100000 Per share value is based on 100,000 shares. B30: =B27-B29
Cell entries and notes
Firms generally divide the net earnings available for common stockholders between retained earn-ings and dividends paid to common stockholders (Rows 29 and 30). Retained earnearn-ings are the amount held by the company for future uses. They are the difference between the net earnings available and the amount paid to common stockholders. Retained earnings accumulate from year to year and are often used for repaying loans or financing new facilities or equipment.
Some Guides for Using Excel for Financial Modeling
Financial statements are only a few of the many reports used for communicating important information about a firm’s activities. You will meet others in the chapters that follow.
Communicating as Well as Calculating
As you use Excel to create financial models, keep the importance of communicating before you. Don’t think of an Excel spreadsheet as simply a sophisticated tool for calculating. Think of it also as a tool for
communicating with others. As a communication tool, it must satisfy the four Cs of good
communica-tions: Clear, Correct, Complete, and Concise.
Spreadsheets are widely used for making presentations at business meetings and for presenting information in management reports. To be useful, they must be understandable to others—that is, to the attendees at meetings or the readers of reports. Because you may not have an opportunity to explain your work to others, your spreadsheets should be able to “stand on their own.” Well-designed spreadsheets make it easy for others to understand them. Another benefit of spreadsheets is that they can help the pro-grammer recognize and correct errors.
Titles
Add short descriptive titles at the tops of worksheets. Those shown in Figure 1-1 identify the company and the type and date of the financial statement. The first is typed in Cell A1 and the second in Cell A2. After typing, each title can be centered across Columns A and B by dragging the mouse from Column A to Column B and clicking on the “Merge and Center” button on the format toolbar. You can use the “Bold” button to emphasize the text. You can use the “Fill Color” button to add color to the cells, and the “Font Color” button to change the color of the type.
You can change the font type and size to help distinguish titles from other entries by using the “Font” and “Font Size” buttons near the left of the format toolbar.
Row and Column Labels
It is usually good practice to type row and column labels before entering data values or making calcula-tions. Labels should be short, descriptive, and accurate. Avoid labels that can be misunderstood. Expunge ambiguities. If you don’t understand something, don’t cover it up with a label that could be misleading. A good rule to follow is this: “It is not enough to use labels that are so clear that others can easily understand
them. Labels must be so clear that others canNOT easily MISunderstand them.” (Think Murphy’s Law:
It is important that labels include not only a title but also any units. For example, the label in Cell B3 identifies the entries below as being expressed or measured in thousands of dollars, except for the value for earnings per share (Cell B28). The entry in Cell B4 is actually 2,575,000 dollars.
Excel’s format toolbar contains a number of buttons and pull-down menus that are useful for format-ting worksheets. Skim over the following sections on first reading, and return to them when you need help to format a worksheet.
Long Row Labels
Many row labels will be too long to fit into the default width of the columns, which is 8.43 units. There are several ways to remedy this:
1. Move the mouse’s pointer to the separation line with the next column at the top of the spreadsheet, hold the left button down, and drag the line far enough to the right for the label to fit.
2. Double-click on the separation line with the next column at the top of the spreadsheet. This will change the width of the column to the minimum needed to fit the longest label in the column. 3. Hold the mouse’s left button down and drag it over the column or columns whose width is to
be changed. Click on Format/Column/Width and enter the value for the column width. (This assumes you know beforehand how wide you want to make the column(s) selected.)
4. Wrap the text so that it appears on more than one line. (That is more than one line, not more than
one row.) To do this, click on the cell with the label to activate it, select “Alignment” from the
Format menu on the format toolbar, and then click on the Wrap text button, as shown in Figure 1-2.
F i g u r e 1 - 2
Long Column Labels
Long column headings, such as “$ thousand (except EPS)” can be shown in a single narrow column by wrapping the text so that it occupies two lines or more in a single cell. To wrap text, click on the cell and use Format/Cells/Alignment/Wrap text. Adjust row height, as necessary.
Boldfacing and Adding Color for Emphasis
To boldface information to stress its importance, click on the cells, rows, or columns with the
informa-tion and then click on the B (Bold) button on the format toolbar or press the Ctrl/B keys. Add color or
shading by selecting the cells, rows, or columns and clicking on the selection on the “Fill Color” button
menu, which is also located on the format menu. Caution: Too much color can be distracting. Dark
backgrounds make it difficult to read labels or values with black fonts.
Distinguishing between Data and Calculated Values
For discussion purposes and to distinguish them from calculated values, all data entries in Figure 1-1 have
been italicized. This is done by selecting the data cell or cells and clicking the I (Italic) button on the
format toolbar. You can also use color to distinguish between data and calculated values. (The author’s use of italics for data values is a personal choice. You may wish to use a different method. If you use italics, you can always change back to a normal font for printing the final copy of the spreadsheet.)
Formatting Values
Except for earnings per share, dollar values are entered with as many significant figures as available in the data. They are then usually formatted as either thousands or millions. For example, an entry of 12,345,678 might appear as 12,346 or as 12,346.78 if the income statement is given in thousands of dollars. You can use a custom format to express entries in thousands or millions of dollars. Formatting large values to minimize the number of decimal places that are displayed makes it easier to focus on what is significant. Even though some of the significant figures are not displayed, the precise value is carried in the cell so that there is no loss of accuracy by rounding the values for display.
Custom Formatting
Open a new spreadsheet and enter the value 12,345,678 in a convenient cell. Click on the cell and then click on Format on the menu bar. Select “Custom” from the list of categories on the Format menu and type #,###,;(#,###,) in the Type box, as shown in Figure 1-3. This will cause the number 12,346 to appear in the cell, although the actual value is 12,345,678. (Note that the last digit shown has been rounded to 6 rather than 5.) If you use a minus sign so that the value in the cell is minus 12,345,678, the formatted value will appear as (12,346), with the value in parentheses. Try it.
parts of the formats. Be sure to include them. You can use the “Format Painter” button on the standard toolbar to copy the format(s) of a cell (or range of cells) to another cell (or range).
You can also use the “Increase decimal” or “Decrease decimal” buttons on the formatting toolbar to increase or decrease the number of decimal places shown on the worksheet.
Indenting Subtopics in a List
Use the “Increase Indent” button on the format menu to indent selected labels or other text. You can also indent by pressing the spacebar before the text, but the indent button makes it easier.
Centering Entries
Use the “Center” button on the toolbar to center labels in the middle of a cell. Use the “Merge and Center” button to center labels in the middle of a group of cells next to one another.
Sheet Orientation
Sheet orientation can be either portrait or landscape. Portrait is preferable for spreadsheets that will be printed in reports because it avoids a reader having to twist the page in order to read it. Landscape is usually preferable for spreadsheets that will be used on projected slides.
F i g u r e 1 - 3
Dialog Box for Formatting Cell Values to Thousands
Documenting
Documents often need to be traced back to their source. Adding your name and the date makes it easier to do this. A good place for the creator’s name and date is at the bottom of the worksheet on the right side. Use =today() to add the date in the cell to the right of the cell with your name. Or use the Header/ Footer dialog box in the Page Setup menu to add this information at the top or bottom of printed copies of your worksheet. Another way of documenting a worksheet is to include a formal documentation sheet as the first sheet in the folder.
Column Headings and Row Numbers
In order to refer to particular cells in the spreadsheets shown in the text, both the row numbers and the alphabetic column headings are included, as in Figure 1-1. These can be removed before printing the worksheets in corporate reports. To do this, change the settings in the File/Page Setup/Sheet tab dialog box to omit them. Figure 1-4 shows the result.
F i g u r e 1 - 4
Income Statement with Column Headings, Row Numbers, and Gridlines Omitted
$ thousand (except EPS)
Total Operating Revenues (or Total Sales Revenues) 2,575.0 Less: Cost of Goods Sold (COGS) 1,150.0
Gross Profits 1,425.0
Less: Operating Expenses
Selling Expenses 275.0
General and Administrative Expenses (G&A) 225.0
Depreciation Expense 100.0
Fixed Expenses 75.0
Total Operating Expenses 675.0
Net Operating Income 750.0
Other Income 20.0
Earnings before Interest and Taxes (EBIT) 770.0
Less: Interest Expense
Interest on Short-Term Notes 10.0
Interest on Long-Term Borrowing 50.0 60.0 Total Interest Expense
Pretax Earnings (Earnings before Taxes, EBT) 710.0
Less: Taxes
Current Tax 160.0
124.0 Deferred Tax
284.0 Total Tax (rate = 40%)
Net Income (Earnings after Taxes, EAT) 426.0
Less: Preferred Stock Dividends 95.0 Net Earnings Available for Common Stockholders 331.0
Earnings per Share (EPS), 100,000 shares outstanding $3.31
Retained Earnings 220.0
111.0 Dividends Paid to Holders of Common Stock
ABC COMPANY
The Items on an Income Statement
Once you have created a skeleton of the spreadsheet with a title, column headings, and row labels, you are ready to flesh it out with data and calculated values. These are the “meat and potatoes” of what the spreadsheet is all about. You may, of course, edit the spreadsheet later to improve your first attempt at creating the skeleton.
Cell entries will include both data values and expressions for calculated values. In Figure 1-1, the entries in Cells B4, B5, B8, B9, B10, B11, B14, B17, B18, B22, B26, and B29 are data values and
are italicized to distinguish them from the calculated values in other cells. Note that the number you
enter in Cell B4, for example, is NOT 2575.0, as it appears in Figure 1-1. The actual number entered is 2,575,000. It appears as 2,575.0 because it has been custom formatted that way. Even though the number appears as 2,575.0 on the spreadsheet, the column heading makes it clear that the actual values in the column have been formatted to appear as thousands of dollars (except for earnings per share, EPS).
Large corporations usually format values on their financial statements to millions rather than thou-sands of dollars. (See the preceding section for details on how to custom format numbers.)
Total Operating Revenues (or Total Sales Revenues) is the income earned from the firm’s operations
during the fiscal year reported. Note that revenues are reported when they are earned, or accrued, even
though no cash flow has necessarily occurred (as, for example, when goods are sold for credit or when services are rendered before being paid for).
The Cost of Goods Sold (COGS) for a retail firm is the amount paid to wholesalers or other suppliers for the goods that the firm resells to its customers. The cost of goods sold for a factory includes the cost of direct production labor and materials used to manufacture the goods. Direct production labor includes that used in fabricating parts and assembling them, along with purchased components, into the factory’s finished goods. Material cost includes the costs of raw materials that are fabricated into parts and the costs of purchased parts and components that are assembled into products.
The cost of goods sold often involves both fixed and variable costs. In this case, the dollar value of the fixed cost remains constant from one year to the next, and only the dollar value of the variable cost would be estimated as a percentage of forecast sales.
Gross Profit is the amount left after paying for the goods that were sold. It is calculated in Figure 1-1 by the entry =B4-B5 in Cell B6.
Operating Expenses are those that are the cost of a firm’s day-to-day operations rather than a direct cost for making a product. This category includes a number of items that are entered as data values.
Selling Expenses are the costs for marketing and selling the company’s products, such as advertising costs
and the salaries and commissions paid to sales personnel. General and Administrative Expenses (G&A)
include the salaries of the firm’s officers and other management personnel and other costs that are included in the firm’s administrative expenses (e.g., legal and accounting expenses, office supplies, travel
and entertainment, insurance, telephone service, and utilities). Fixed Expenses include such costs as the
Depreciation Expenses are the amount by which the firm reduced the book value of its capital assets during the preceding year. Because the purposes of financial reporting are often different from those for
tax legislation, the depreciation method a firm uses for financial reporting is not necessarily the same as
what it uses for tax reporting. Firms are allowed to use a variety of depreciation methods for financial
reporting, whereas they are required to use the Modified Accelerated Cost Recovery System (MACRS) mandated by the Internal Revenue Code for tax purposes and for reporting on the Income Statement. (Depreciation methods, including MACRS, are discussed in Chapter 11: Depreciation and Taxes. MACRS generally provides the fastest write-off and greatest reduction in taxable income. Because it usu-ally gives the best cash flows, MACRS is the method that is most often used by financial managers for calculating tax liability).
Total Operating Expense is the sum of the individual expenses. It is calculated by the entry =SUM(B8:B11) in Cell B12.
Net Operating Income (also called Net Operating Profit) is what is left after subtracting the total operating expense from the gross profits. It is calculated by the entry =B6-B12 in Cell B13. (If the result
is a negative value, it is called a Net Operating Loss and can be used to reduce the firm’s taxes.)
Other Income is income derived from nonoperating sources. It is entered as a data value in Cell B14 of Figure 1-1.
Earnings before Interest and Taxes (EBIT, also known as Pretax Income) is the difference between income and the sum of the operating expenses. It is calculated by the entry =B13+B14 in Cell B15.
Interest Expense is the cost paid for borrowing funds. Interest on Short-Term Notes is that paid on loans from banks or commercial notes that the company issues for short terms, such as 30 days to 90 days, in order to meet payrolls and other current obligations during months when expenses exceed income. (The company may also earn interest by lending excess funds to others during periods when its income
exceeds expenses.) Interest on Long-Term Borrowing is that paid on bonds or other multiyear debts that the
company incurs in order to raise capital for capital assets, such as factories and other facilities. The Total Interest Expense is calculated by the entry =B17+B18 in Cell B19.
Subtracting nonoperating expenses, such as the total interest, from EBIT gives the Earning before
Taxes (EBT, also known as the Net Profits (or Earnings) before Taxes). EBT is calculated by the entry =B15-B19 in Cell B20.
Taxes are computed by multiplying EBT by the tax rate, which is assumed in Figure 1-1 to be 40 percent. The total tax is computed by the entry =0.4*B20 in Cell B24. Note that the taxes are separated
into Current Taxes and Deferred Taxes. The current tax portion (data value in Cell B22) is the amount of
Earnings after Taxes (EAT, also known as the Net Profits (or Earnings) after Taxes) are what is left after subtracting taxes from EBT. For purposes of the Income Statement, the total tax is the value to be subtracted from the EBT to compute the EAT. Thus, the value of EAT is calculated by the entry =B20-B24 in Cell B25.
Preferred Stock Dividends are what is paid to holders of the firm’s preferred stock, who are paid before holders of the firm’s common stock. Preferred stock dividends are at a fixed rate on the preferred stock issued. They are entered as a data value in Cell B26.
Preferred stock dividends can be calculated by multiplying the number of shares of preferred stock by the dividend rate. Both of these values are unchanged from year to year unless the company issues more preferred stock to raise capital.
Net Earnings Available to Common Stockholders are what is left from the EAT after paying the
hold-ers of preferred stock first. It is calculated by the entry =B25-B26 in Cell B27.
Earnings per Share (EPS) is calculated by dividing the net earnings available to common
stock-holders by the weighted average number of shares of common stock outstanding during the period.1 For
100,000 shares of common stock outstanding, it is calculated by the entry (B27/100000) in Cell B28. Note that the format for earnings per share is different from that for the other dollar values on the income statement, as indicated by the column heading in Cell B3. EPS has been formatted in Figure 1-1 by using the currency format with two decimal places. Whereas the values in other cells in Column C appear in thousands of dollars, the value of EPS is in dollars and cents.
Retained Earnings is the portion of the net earnings available to common stockholders, if any, that is retained for investing in the company’s future. It is entered as data in Cell B29. The remainder is paid
to the holders of common stock; that is, the Dividends Paid to Holders of Common Stock are calculated
by the entry =B27-B29 in Cell B30. If, on the other hand, the dividends paid to holders of common stock are a set value that is entered in Cell B30, then the retained earnings are what is left and are calculated by the entry =B27-B30 in Cell B29.)
Company policies for retaining funds versus paying dividends are the responsibility of the firm’s directors. Their decisions affect corporate liquidity and stockholder morale. Company officers generally favor retaining as much income as possible in order to promote the company’s growth and increase the value of its common stock. This is particularly true when there are opportunities for profitable growth through investments in capital assets or by other investment strategies (e.g., buying back stock). Thus, when profits are high, companies may retain a larger portion of their earnings and reduce the portion paid out as dividends. Companies with heavy expenditures of research and development generally favor retain-ing earnretain-ings. Some companies pay no regular dividends in favor of growretain-ing and increasretain-ing stock value.
Stockholders are divided between those with short-term interests who favor paying dividends and those with long-term interests who favor growth. Dividend money gets taxed twice: once at the corporate level and again at the individual level, where it is taxed at an individual’s highest rate. Retained earnings are taxed only once so that a greater portion of its buying power is available for investing, which increases
1 The weighted average number of shares for an annual statement is calculated as follows: Suppose there were 100,000 shares at the beginning
shareholder equity. A company whose stock is closely held by a small number of wealthy investors tends to pay lower dividends in order to reduce the income taxes of its stockholders.
If dividends are cut to redeploy earnings that will benefit shareholders over the long run, investors should be informed of the reason for the change and how the retained funds will be used. Otherwise, cut-ting a stock’s dividends may send a negative signal to shareholders and potential investors that a company’s near-term prospects are not good.
Dividend policies are also affected by a company’s financial structure. A firm with a strong cash posi-tion and liquidity is likely to pay high dividends, whereas a firm with a heavy debt load must retain more of its earnings in order to service its debt.
Changing a Worksheet’s Title
The default names of worksheets in a new folder are Sheet1, Sheet2, etc. These are easily changed to names that are more descriptive and that make it easier to navigate through the sheets in a folder.
Change the sheet name of the income statement from the default name of “Sheet1” to “Income Stmnt.” To do this, double-click on the Sheet tab with the left button of the mouse, type the new name, and press Enter. An alternate method is to click the right mouse button on the Sheet tab, select “Rename” from the menu, type the new name, and press Enter. (You will later change the titles of the other work-sheets from Sheet2 to “Balance Sheet” and from Sheet3 to “Cash Flow Stmnt.”)
Showing the Formulas in Cells
To show the formulas in cells, such as the entry in Cell B6 of Figure 1-1, click on “Options” on the Tools pull-down menu. This will open the options dialog box shown in Figure 1-5. Click on the Formulas box
F i g u r e 1 - 5
under Window options on the left side. This changes the view of the spreadsheet to that shown in Figure 1-6. Figure 1.6 shows the actual entries in each cell. Note, for example, that the entry in Cell B4 is the data value 2575000, NOT 2575.
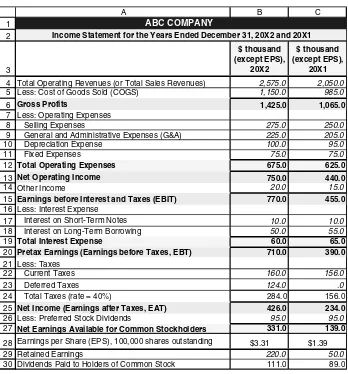
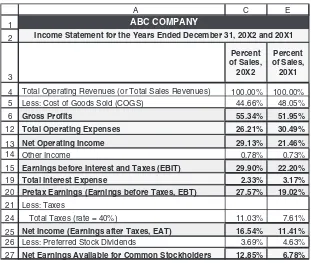
Comparison of Last Year to Preceding Year
An important part of any analysis of how well a firm is doing is to compare results for several years. The income statements in annual reports therefore show values not only for the current year but also for at least the preceding year. Some annual reports show income statements for as many as 10 years, including the current and preceding years.
Figure 1-7 shows the income statement of Figure 1-1 with results added for the prior fiscal year.
F i g u r e 1 - 6
Income Statement with Formulas for Calculated Values
1
Total Operating Revenues (or Total Sales Revenues) 2575000
Less: Cost of Goods Sold (COGS) 1150000
Gross Profit =B4-B5
Less: Operating Expenses
Selling Expenses 275000
General and Administrative Expenses (G&A) 225000
Depreciation Expense 100000
Fixed Expenses 75000
Total Operating Expenses =SUM(B8:B11)
Net Operating Income =B6-B12
Other Income 20000
Earnings before Interest and Taxes (EBIT) =B13+B14 Less: Interest Expense
Interest on Short-Term Notes 10000
Interest on Long-Term Borrowing 50000
=B17+B18 Total Interest Expense
Pretax Earnings (Earnings before Taxes, EBT) =B15-B19 Less: Taxes
Current Taxes 160000
Deferred Taxes =B24-B22
=0.4*B20 Net Income (Earnings after Taxes, EAT) =B20-B24
Less: Preferred Stock Dividends 95000
Net Earnings Available for Common Stockholders =B25-B26
Earnings per Share (EPS), 100,000 shares outstanding =B27/100000
Retained Earnings 220000
Dividends Paid to Holders of Common Stock =B27-B29
ABC COMPANY
Income Statement for the Year Ended December 31, 20X2
Figure 1-7 is easily prepared by copying Cells B4:B30 to C4:C30 and editing only the data entries in Column C. In the process of copying Cells B4:B30 to C4:C30, the formula =B4-B5 in Cell B6 automati-cally changes to =C4-C5 in Cell C6, the formula =SUM (B8: B11) in Cell B12 changes to =SUM (C8:
C11) in Cell C12, and so forth for the cell entries of all other calculated values. Therefore, as new data
values are entered for the preceding year, new calculated values are made automatically.
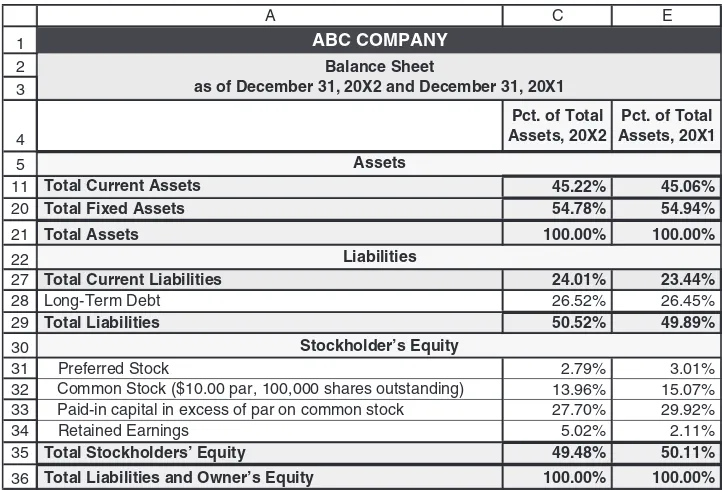
The Balance Sheet
Balance sheets summarize a firm’s assets, liabilities, and equity at a specific point in time. Assets are
any-thing a firm owns, both tangible and intangible, that has monetary value. Liabilities are the firm’s debts,
1
Total Operating Revenues (or Total Sales Revenues) 2,575.0 2,050.0 Less: Cost of Goods Sold (COGS) 1,150.0 985.0
Gross Profits 1,425.0 1,065.0
Less: Operating Expenses
Selling Expenses 275.0 250.0
General and Administrative Expenses (G&A) 225.0 205.0
Depreciation Expense 100.0 95.0
Fixed Expenses 75.0 75.0
Total Operating Expenses 675.0 625.0
Net Operating Income 750.0 440.0
Other Income 20.0 15.0
Earnings before Interest and Taxes (EBIT) 770.0 455.0
Less: Interest Expense
Interest on Short-Term Notes 10.0 10.0
Interest on Long-Term Borrowing 50.0 55.0 65.0 60.0
Total Interest Expense
Pretax Earnings (Earnings before Taxes, EBT) 710.0 390.0
Less: Taxes
Current Taxes 160.0 156.0
Deferred Taxes 124.0 .0
284.0 156.0 Total Taxes (rate = 40%)
Net Income (Earnings after Taxes, EAT) 426.0 234.0
Less: Preferred Stock Dividends 95.0 95.0 Net Earnings Available for Common Stockholders 331.0 139.0
Earnings per Share (EPS), 100,000 shares outstanding $3.31 $1.39
Retained Earnings 220.0 50.0
89.0 Dividends Paid to Holders of Common Stock
ABC COMPANY
Income Statement for the Years Ended December 31, 20X2 and 20X1
111.0
F i g u r e 1 - 7