A paper for International Conference on Regional Development, Environment and Infrastructures Institute of Technology Bandung (ITB), Bandung, Indonesia, June 18 – 19, 2009
Assessment of Regional Disaster Resilience by using Social
Vulnerability Index
Authors:
Pungky Utami (MSc Alumni, University of Bristol, e-mail: [email protected]) Saut Sagala (PhD Student, Kyoto University, e-mail: [email protected])
Aria Mariany (Centre for Disaster Mitigation, ITB, e-mail: [email protected])
Abstract
The occurrence of recent natural disasters in Indonesia highlights the needs to achieve regional disaster resilience. Regional disaster resilience measures how quick and strong a region or a system can recover to its normal situation prior to occurrence of disasters. An immediate recovery time implies higher resilience and at the same time represents lower vulnerability. In addition, recovery also needs to address critical infrastructures involved in re-building a region after a disaster. However, within a region not all sub-regions have the same capability to deal with and to recover from disaster impacts. Such differences could be due to different level of vulnerability and existence of preparedness, resources and facilities to mitigate. To assess the differences of disaster resilience level within a region, this paper proposes the use of social vulnerability index (SoVI). Taking four regencies affected by Mt. Merapi as the study area (Sleman, Magelang, Boyolali and Klaten regencies), this study argues the importance of SoVI in determining regional preparedness. Having a SoVI, ones can prioritize what sort of preparedness activities that can be carried out prior to an occurrence of a disaster. The advantages of SoVI approach are due to the extensive use of complex indicators, quantitative measurements and transformability into spatial use. Thus, SoVI is highly relevant with regional development and thus needs to be taken into account for a disaster prone region. In this study we performed a number of dynamic indicators used to develop a SoVI. The final results illustrate and map various levels of social vulnerability index among the sub-regions. Recommendation related with methodology and improvement of regional disaster resilience is presented in this paper.
Keywords: disaster resilience; Merapi; region; social vulnerability index
1. Introduction
understand the capacities of the regions to cope with the disaster and external disturbances (Adger et al., 2005). Ronan and Johnston pointed out that “resilience is linked to how well a community (a city or a region) can bounce back after a major disaster”. Thus, the concept of resilience is often linked with the concept of vulnerability on the one hand and preparedness or capacity to recover on the other hand (Klein et al., 2003).
The current rapid demographical and social change such as population growth and economic instability may aggravate the people’s susceptibility to the impacts of disasters, resulting in possible greater losses of lives and properties. With regards to disaster research in general, Cutter et al (2003) emphasized that although substantial efforts have been put into the complex work of characterising and mapping of physical vulnerability, it appears that the social aspects of vulnerability as a component of potential risk have not been much explored yet in as much detail.
This paper examines the regional disaster resilience based on the social vulnerability index which was developed by Cutter et al (2003). To provide a brief discussion on social vulnerability we first discuss the literature on this issue. Furthermore, we discuss the case of Mt. Merapi where the concept of social vulnerability is applied.
2. Concept of Social Vulnerability Index and Regional Disaster Resilience
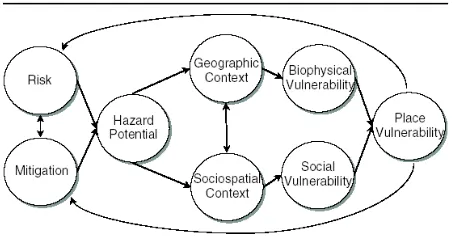
Due to difficulties in quantifying the social vulnerability, Cutter et al (2003) proposed the construction of Social Vulnerability Index (SoVI) as a basis for local officials, emergency managers, and planners to add to their action plan on disaster response in order to allocate the necessary resources in the events of disasters to the right targets at the right location (Cutter et al., 2003; UCHSC, 2004; Boruff et al., 2005; Boruff and Cutter, 2007).
According to the model, the place vulnerability is “the interaction of both social and biophysical vulnerability“ and it may “reduce or enhance both risk and mitigation” (Cutter, 1996, p.533). Thus, this study adopts the term “place vulnerability” in assessing the relationship between the social vulnerability of Merapi proximal community and the biophysical vulnerability, represented by the volcanic hazard map. However, due to the absence of other social vulnerability measures, such as capacity and mitigation initiatives, cultural aspect, and community perception, as well as the smooth gradient in the present volcanic hazard zonation, the vulnerability of neighbouring communities measured in this study do not present absolute values and therefore, is termed as “relative vulnerability.”
The term social vulnerability represents partly “social inequalities” and partly “place inequalities” resulting from the characteristics of communities and the built environment (Cutter et al., 2003). Social vulnerability may include (but is not limited to) the socioeconomic status of individuals or groups of people, demographic characteristics, perception and attitude towards hazards and risks, social networks, access to capital and resources, physically weak individuals, cultural beliefs, access to basic infrastructure services, and access to political power and representation (Cutter et al., 2003; Wisner et al., 2004).
Cutter et al (2003) synthesized forty-two socioeconomic and built environment variables as observed through research literature and took the county level in the United States as their unit of analysis. The variables were then reduced, by using principal component analysis, to eleven independent factors that represented the social vulnerability of the people explaining 76.4% of the variance among all counties.
It is in the context of both social inequalities and place inequalities where the regional disaster resilience lies. In this framework, disasters should not only be seen with more emphasis on the occurrence of a hazard (physical vulnerability) but also how prepared or resourceful a region or a sub-region may cope with. Therefore, in a regional disaster resilience concept, it is important to measure the preparedness of the sub-regions within a region in dealing with (natural) disasters. To measure this we refer to the concept of social vulnerability index proposed by Cutter et al (2003) as this index has capacity to differentiate and provide a comparison among areas in relation to natural disaster issues.
3. Study area
hazard map, fifty-five village districts that are within the hazard zones of pyroclastic flows are taken as care study for this research.
4. Methodology
Initially, the analysis used indicators and variables that have been proposed in previous studies on social vulnerability [Cutter, Boruff, and Shirley (2003); Boruff and Cutter (2007); and others]
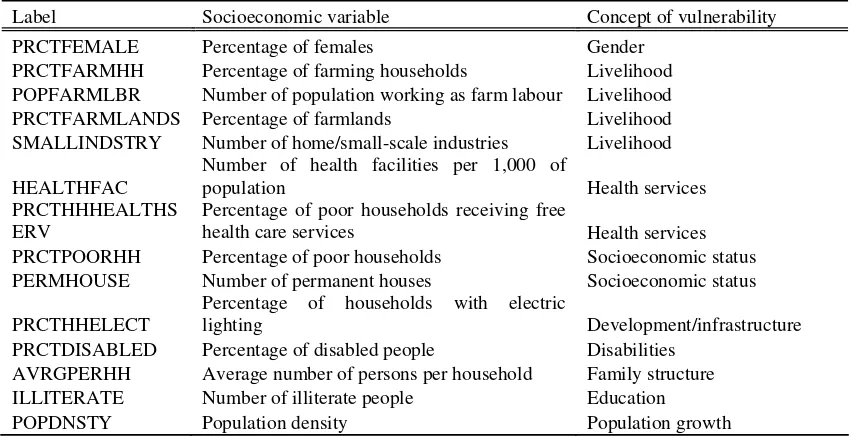
After observing the spurious correlation and examining its relevance to the case study, there were 14 socioeconomic variables (Table 1) available for further analysis, collected from Village Potential Statistics (PODES) 2006 and primary survey of local volcanological agency in 2007.
The unit analysis in this study was at village level. Therefore all indicators in this research were then calculated at the village level. To obtain the SoVI, two steps of analyses were carried out. The first step was variable reduction and then followed by the calculation of social and place vulnerability index as explained in the following section.
4.1 Variable reduction
The analysis uses Principle Component Analysis (PCA) to reduce correlated variables into several uncorrelated appropriate components using varimax rotation and the eigenvalues greater than 1. Five components with eigenvalues greater than 1 were extracted, then used to measure the social vulnerability of each district. Furthermore, the resulting components are examined on what they broadly present and how the may influence social vulnerability.
Table 1 Socioeconomic variables and its vulnerability concept
Label Socioeconomic variable Concept of vulnerability
PRCTFEMALE Percentage of females Gender
PRCTFARMHH Percentage of farming households Livelihood POPFARMLBR Number of population working as farm labour Livelihood PRCTFARMLANDS Percentage of farmlands Livelihood SMALLINDSTRY Number of home/small-scale industries Livelihood
HEALTHFAC
Number of health facilities per 1,000 of
population Health services
PRCTHHHEALTHS ERV
Percentage of poor households receiving free
health care services Health services PRCTPOORHH Percentage of poor households Socioeconomic status PERMHOUSE Number of permanent houses Socioeconomic status
PRCTHHELECT
Percentage of households with electric
lighting Development/infrastructure PRCTDISABLED Percentage of disabled people Disabilities
4.2 Calculation of social and place vulnerability index
Following are the derived components which are used to construct the social vulnerability index for each village districts.
Table 2 Component score and loadings used to construct the social vulnerability index
Component
Scaling method
Percentage explained variance
Component 1: Access to services and welfare Inverse 17.75
Component 2: Livelihood Absolute 11.4
Component 3: Socioeconomic dependence None 10.62 Component 4: Health services and special needs population None 9.52 Component 5: Population growth None 8.86 Source: Adapted from Boruff et al (2005)
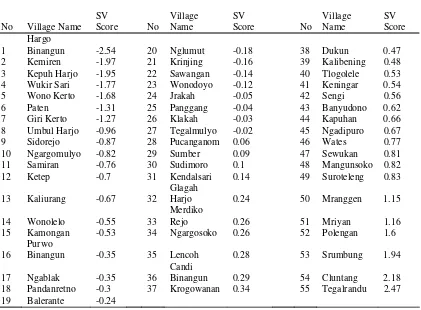
The components’ score needs rescaling in order to ensure that negative values representing low social vulnerability and vice versa. Upon rescaling the components’ values, the total components’ score is summed to create the Social Vulnerability Index (SoVI) score. The score is classified into five levels ranging from the value < -1.5 indicating low social vulnerability to the value > +1.5 indicating high social vulnerability.
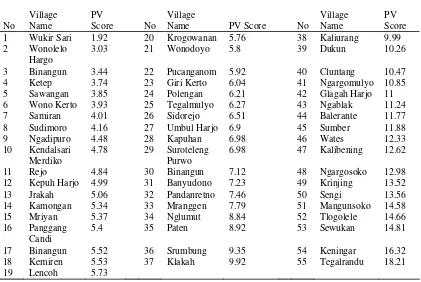
Table 3 Ranking of SoVI in Merapi proximal village districts
No Village Name
Binangun 0.29 54 Cluntang 2.18
18 Pandanretno -0.3 37 Krogowanan 0.34 55 Tegalrandu 2.47
The inspection of the raw data of each village district is made in order to verify the result and it is found that most socially vulnerable village districts have substantial differences in the statistical data compared to other village districts. The highly socially vulnerable village districts in general have significant figures on population density, percentage of farming households, percentage of poor households, and average number of persons per household. However, it is essential to note that although percentage of disabled people is the second most important contributor to social vulnerability, the raw data show that there is little variation among village districts, with none of them demonstrates extreme figures.
Upon the construction of social vulnerability index, we later developed the place vulnerability index through the multiplication of the social vulnerability score with the weighted average of each hazard zone and the portion of the overlapped areas. Each hazard zone is given a value from 1 to 4, assigned to non-hazard zone, hazard zone I, hazard zone II, and hazard zone III, respectively. The hazard zone is weighted from 1 to 4 respectively indicating higher hazard values while the portion of the overlapped areas is derived from the affected areas per total area. The place vulnerability score is normalized to avoid zero value vulnerability by adding each village district’s social vulnerability score with the absolute value of the minimum score minus 1. Therefore, the minimum total vulnerability score will be +1 ranging to the upper end. Place vulnerability was calculated based on the relationship between normalized social vulnerability index with the portion of village district and the values of hazard zone (Eq. 1).
j j n j
j i
i NSoVI a h
PVIndex
∑
=
=
=
1 (Eq.1)
where:
PVIi = place vulnerability index of village district i
NSoVIi = normalized social vulnerability index of village district i n = number of hazard zone category (including non-hazard zone) aj = portion of village district i lies within hazard zone j (0≤aj ≤1)
hj = hazard value of hazard zone j
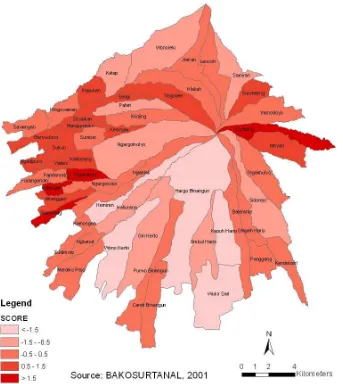
Figure 2. Relative social vulnerability index of Merapi proximal village districts (Utami, 2009)
Table 4. Ranking of place vulnerability in Merapi proximal village districts
Binangun 7.12 48 Ngargosoko 12.98 12 Kepuh Harjo 4.99 31 Banyudono 7.23 49 Krinjing 13.52
The place vulnerability map (Figure 3) shows the comparison of the relative place vulnerability score of the village district within each hazard zone. From the visualisation for every hazard zone, it is obvious that there is not much difference between the place vulnerability and the social vulnerability map due to lack of spatial details in the volcanic hazard map. For example, in panel III the majority of the village districts have average score of place vulnerability despite their adjacent distance to the summit of the volcano. In Panel II, there are more vulnerable areas although the risk is lower than in the summit. In addition, the visualisation of place vulnerability in Panel I is different from the other two zones as this study does not include the entire areas within hazard zone I. In general, despite the effort of assigning a weight to each hazard zone when calculating the place vulnerability index, it is apparent that the smooth gradient of hazard zonation fails to represent a definite measure of the place vulnerability.
5. Result
The findings show that the vast majority of village districts lie within Merapi hazard zones II and III show extremely low to average levels of relative social vulnerability representing 70.9% of fifty-five village districts in total. About 29.1% have average to extremely high level of relative social vulnerability are randomly distributed around the flanks, but mostly is leading toward the southwestern part of the volcano.
Four village districts, i.e. Polengan, Srumbung, Cluntang, and Tegalrandu are more socially vulnerable compared to other cases. The underlying reasons for each village district are different, but the combination of several variables has made them socially vulnerable. Polengan, Srumbung, and Tegalrandu village districts are located in the southwestern part of Merapi flanks, while Cluntang is located separately on the eastern flank. The least socially vulnerable village districts are evenly distributed on the western flanks and the rest of the village districts with moderate scores are geographically widespread. It is imperative to note that the social vulnerability scores of the village districts derived from the present study are relative to the situation where current data are used. Moreover, this term is used given the lack of baseline data contributing to social vulnerability, such as perception to volcanic hazards and hazard knowledge of the neighbouring communities available for this study.
Based on the rank of the scores, Tegalrandu village district is identified as the most socially and physically vulnerable, followed by Keningar. Geographically, Tegalrandu is located within the first danger zone while Keningar is located within the forbidden zone. In addition, approximately twelve out of fifty-five village districts are considered socially and physically vulnerable and the distribution of relative place vulnerability scores in all village districts appears to follow similar pattern of the hazard zonation, particularly for the pyroclastic flow hazard, toward the southwestern flanks. Three socially vulnerable village districts, i.e. Cluntang, Glagah Harjo, and Balerante are exceptionally separated from the other areas.
6. Discussion
The method developed by Cutter et al (2003) offers consistency and simplicity in measuring social vulnerability. Derived from widely used vulnerability indicators in most hazards literature and have been tested within multi-hazards perspective in the United States and the Caribbean, this method provides robust indicators representing socioeconomic characteristics of a vulnerable population. In our case in Mt. Merapi, this approach also seems to be capable in measuring the social vulnerability index. This is supported by the availability of statistical data used to construct the social vulnerability index. It is also shown by the results of maps of relative social vulnerability and place vulnerability.
to investigate the nature of variables in each component has been made to decide whether the variables indicate high or low social vulnerability. To verify the interpretation, inspection of the raw data to examine the relation between the value of each variable and its component score is necessary. The finding confirms that this method works well in ensuring that positive values indicating high social vulnerability and vice versa, as suggested by the original method. Second, the small number of cases has created few difficulties in processing the dataset since PCA requires large sample size. Earlier, the unit of analysis in this study was the sub-districts but due to a sample size problem (only eleven sub-districts), the cases were reduced to the village level, resulting in a greater number of cases (fifty-five village districts taken as the cases). In fact, the same method has been applied with a limited number of cases (below fifteen) in the case of Caribbean nations (Boruff and Cutter, 2007) but no further problems appeared (Bryan Boruff, email communication) which is confusing as far as the PCA calculation is concerned. It appears that the results are more statistically reliable when based on a large number of cases, which also influence the quality of the mapping and the precision of the index calculation.
The interesting part of the finding is that the socially vulnerable people do not necessarily reside within hazard zones II or III, taking the example of Cluntang village district, where only small parts of the area are within these hazard zones. This finding suggests that hazard is not the only (main) aspect in determining the vulnerability and resilience of a region. Other factors (existence of resources and other capacities) may be more important in the final result of social vulnerability index. This finding is similar to the ideas by Wisner et al (2004) in which the vulnerability and coping capacities of the communities that matter a lot. However, there is a possibility that the socially vulnerable population live within those two hazard zones. This explains why the areas within hazard zone III, for example, have relatively low to average place vulnerability score although their physical locations are considered very vulnerable. Due to the fact that there is a lack of spatial hazard gradient in the current volcanic hazard map, the place vulnerability map tends to have slightly different variability to the social vulnerability map. Although none of the village districts has an extreme value in both social and physical vulnerability, the result of this study confirms that the inclusion of social aspects of vulnerability incorporated with physical aspects produces spatial variability in the distribution of place vulnerability. This could later serve as a basis to augment the vulnerability assessment framework which may lead toward a more accurate and reliable vulnerability assessment.
should a volcanic eruption occurs. Based on the previous experiences in Indonesia in recent years, following the occurrence of a disaster, a rapid reconnaissance study to assess the needs of the affected communities is held by the local government officials or international organisations. In this case, the index may be useful as a preliminary guidance for the assessment, thus the assessment team can quickly identify which areas that need to be prioritised and what kind of assistance should be provided before going further to the field for a baseline survey. Last but not least, the maps, with further refinement, may be used to identify the priority for distribution of resources and can be considered in the local planning process, either for land use plan or for sector plan; determine post-disaster actions, such as the establishment of rehabilitation and relocation sites that are safe enough from the hazard impacts; and design mitigation initiatives and long-term development plan in disaster prone areas.
Yet, there are some drawbacks which need to be taken into account while carrying a similar approach. This approach depends much on the quality and availability of the data. It also depends on the unit analysis that we are dealing with. However, an observation by Sagala and Okada (in review) suggest that a study in Mt. Merapi needs to be carried out at a hamlet (dusun) level instead of village since a village may be located at several hazard zones, as we described earlier. Yet, the absence of data at a hamlet level did not allow us to carry out the analysis at that precision.
7. Conclusion
The paper has examined the regional disaster resilience in Mt. Merapi using the social vulnerability index (SoVI). The results indicate that the regional disaster resilience does not depend on mainly the distance with the volcano as the sources of hazards but also with the capacities of the villages or communities in the villages. The research findings reveal the underlying indicators and variables that put the society in a socially vulnerable situation, particularly in the relations to disaster occurrences. Furthermore, this research is able to visually illustrate the geographical variability of the socially vulnerable village districts based on their relative place vulnerability scores.
time period. 5). The current indicators that were applied in this research mainly refers to those of earlier applied at a developed or more developed nations. Further important research that needs to be carried out is on the decisions of which indicators are suitable in the context of a developing like Indonesia. This could be done by doing several scenarios and getting the scenarios which fit best with the model.
Bibliography
Adger, W.,Hughes, T., Folke, C., Carpenter,S. and Rockstrom, J. (2005). Social-ecological resilience to coastal disasters", Science, Vol 309, pp. 1036-1039
Badan Koordinasi Penanaman Modal. (2006). Available online:
http://regionalinvestment.com/sipid/id/demografipendudukjkel.php?ia=3471&is=37
Boruff, B.J., Emrich, C., and Cutter, S.L. (2005). Erosion Hazard Vulnerability of US Coastal Counties. Journal of Coastal Research, 21(5), pp. 932-942.
Boruff, B.J., Cutter, S.L. (2007). The Environmental Vulnerability of Carribean Island Nations. The Geographical Review, 97(1), pp. 24-45.
Cutter, S.L. (1996). Vulnerability to environmental hazards. Progress in Human Geography, 20(4), pp. 529-539.
Cutter, S.L., Mitchell, J.T., and Scott, M.S. (2000). Revealing the vulnerability of people and places: a case study of Georgetown County, South Carolina. Annals of the Association of American Geographers, 90(4), pp. 713-737.
Cutter, S.L., Boruff, B.J., and Shirley, W.L. (2003). Social Vulnerability to Environmental Hazards. Social Science Quarterly, 84(2), pp. 243-261.
Cutter, S.L., Emrich, C.T. (2006). Moral Hazard, Social Catastrophe: The Changing Face of Vulnerability along the Hurricane Coasts. The ANNALS of the American Academy of Political and Social Science, 604, pp. 102-112.
Klein, R., Nicholls, R. and Thomalla, F. (2003), Resilience to natural hazards: How useful is this concept?, Environmental Hazards, Vol. 5, pp. 35-45.
Sagala, S. and N. Okada, How do hazard-related factors and traditional cultural beliefs affect evacuation? A case study: Communities in Mt. Merapi, Indonesia, Disasters (in review).
The Heinz Centre for Science, Economics, and the Environment. (2002). Human Links to Coastal Disasters. Washington, D.C.: The John Heinz III Centre for Science, Economics, and the Environment.
The Panos Institute. (2002). High Stakes: the future for mountain societies. Panos Report No. 44. Panos Ltd: London.
UCHSC. (2004). Natural Hazards Risk Assessment for the State of Colorado. University of Colorado at Denver and Health Sciences Centre. Report dated Fall 2004. Available from: http://www.dola.state.co.us/dem/mitigation/coloradohazards.pdf
Utami, P. (2009). Measuring Social Vulnerability in Volcanic Hazards: The Case Study of Merapi Volcano, Indonesia. Unpublished Master thesis, Department of Earth Sciences, University of Bristol, United Kingdom.
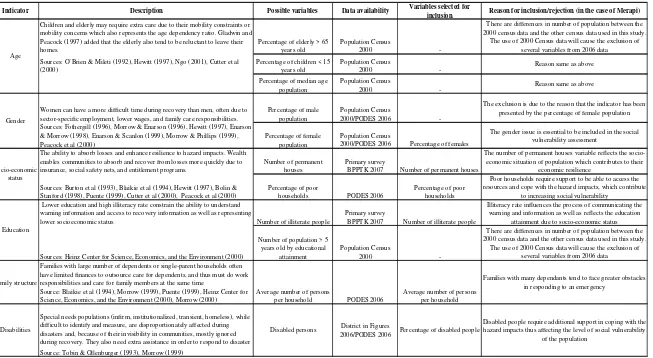
Appendix 1. Vulnerability indicators and variables used in the research
Indicator Description Possible variables Data availability Variables selected for
inclusion Reason for inclusion/rejection (in the case of Merapi)
Children and elderly may require extra care due to their mobility constraints or mobility concerns which also represents the age dependency ratio. Gladwin and Peacock (1997) added that the elderly also tend to be reluctant to leave their homes.
Percentage of elderly > 65 years old
Population Census
2000
-There are differences in number of population between the 2000 census data and the other census data used in this study.
The use of 2000 Census data will cause the exclusion of several variables from 2006 data
Sources: O’Brien & Mileti (1992), Hewitt (1997), Ngo (2001), Cutter et al (2000)
Percentage of children < 15 years old
Population Census
2000 - Reason same as above
Percentage of median age population
Population Census
2000 - Reason same as above
Women can have a more difficult time during recovery than men, often due to sector-specific employment, lower wages, and family care responsibilities.
Percentage of male population
Population Census
2000/PODES 2006
-The exclusion is due to the reason that the indicator has been presented by the percentage of female population
Sources: Fothergill (1996), Morrow & Enarson (1996), Hewitt (1997), Enarson & Morrow (1998), Enarson & Scanlon (1999), Morrow & Phillips (1999), Peacock et al (2000)
Percentage of female population
Population Census
2000/PODES 2006 Percentage of females
The gender issue is essential to be included in the social vulnerability assessment
The ability to absorb losses and enhance resilience to hazard impacts. Wealth enables communities to absorb and recover from losses more quickly due to insurance, social safety nets, and entitlement programs.
Number of permanent houses
Primary survey
BPPTK 2007 Number of permanent houses
The number of permanent houses variable reflects the socio-economic situation of population which contributes to their
economic resilience
Sources: Burton et al (1993), Blaikie et al (1994), Hewitt (1997), Bolin & Stanford (1998), Puente (1999), Cutter et al (2000), Peacock et al (2000)
Percentage of poor
households PODES 2006
Percentage of poor households
Poor households require support to be able to access the resources and cope with the hazard impacts, which contribute
to increasing social vulnerability Lower education and high illiteracy rate constrain the ability to understand
warning information and access to recovery information as well as representing
lower socioeconomic status Number of illiterate people
Primary survey
BPPTK 2007 Number of illiterate people
Illiteracy rate influences the process of communicating the warning and information as well as reflects the education
attainment due to socio-economic status
Sources: Heinz Center for Science, Economics, and the Environment (2000)
Number of population > 5 years old by educational
attainment
Population Census
2000
-There are differences in number of population between the 2000 census data and the other census data used in this study.
The use of 2000 Census data will cause the exclusion of several variables from 2006 data
Family structure
Families with large number of dependents or single-parent households often have limited finances to outsource care for dependents, and thus must do work responsibilities and care for family members at the same time Source: Blaikie et al (1994), Morrow (1999), Puente (1999), Heinz Center for Science, Economics, and the Environment (2000), Morrow (2000)
Average number of persons
per household PODES 2006
Average number of persons per household
Families with many dependants tend to face greater obstacles in responding to an emergency
Special needs populations (infirm, institutionalized, transient, homeless), while difficult to identify and measure, are disproportionately affected during disasters and, because of their invisibility in communities, mostly ignored during recovery. They also need extra assistance in order to respond to disaster Source: Tobin & Ollenburger (1993), Morrow (1999)
Age
Gender
Socio-economic status
Education
Disabled persons District in Figures 2006/PODES 2006
Disabilities Percentage of disabled people
Disabled people require additional support in coping with the hazard impacts thus affecting the level of social vulnerability
Source: Adapted from Cutter et al (2003) and The Heinz Centre for Science, Economics, and the Environment (2002).
Indicator Description Possible variables Data availability Variables selected for
inclusion Reason for inclusion/rejection (in the case of Merapi)
Health care providers, including physicians, nursing homes, and hospitals, are important post-event sources of relief. The lack of proximate medical services will lengthen immediate relief and longer-term recovery from disasters.
Number of health facilities
per 1,000 of population PODES 2006
Number of health facilities per 1,000 of population
The provision of health facilities supports the recovery process from disasters
Source: Morrow (1999), Hewitt (1997), Heinz Center for Science, Economics, and the Environment (2000)
The provision of free health care services is considered as capacity thus decreasing vulnerability
The loss of infrastructure will severely affect the communities' life due to lack of financial resources to rebuild
Source: Platt (1995), Heinz Center for Science, Economics, and the Environment (2000)
The potential loss of employment following a disaster exacerbates the number of unemployed workers in a community, contributing to a slower
recovery from the disaster. Source: Mileti (1999)
Counties experiencing rapid growth lack available quality housing, and the social services network may not have had time to adjust to increased populations.
Natality rate District in Figures
2006
-There are mix of data sources with inconsistent figures. Therefore, it is decided not to take this variable into
consideration
Source: Morrow (1999), Puente (1999), Cutter et al (2000), Heinz Center for
Science, Economics, and the Environment (2000) Mortality rate
District in Figures
2006 - Reason same as above
Migration rate District in Figures
2006 - Reason same as above
In migration District in Figures
2006 - Reason same as above
Out migration District in Figures
2006 - Reason same as above
Population density Population Census
2000/PODES 2006 Population density
High density of population will increase the level of social vulnerability
People that rent do so because they are either transient or do not have the financial resources for home ownership. They often lack access to information about financial aid during recovery. In the most extreme cases, renters lack sufficient shelter options when lodging becomes
uninhabitable or too costly to afford.
Number of population living in their own homes
Population Census
2000
-There are differences in number of population between the 2000 census data and the other census data used in this study.
The use of 2000 Census data will cause the exclusion of several variables from 2006 data
Source: Morrow (1999), Heinz Center for Science, Economics, and the Environment (2000)
Number of population living in rented homes
Population Census
2000 - Reason same as above
Some occupations which involve resource extraction, may be severely impacted by a hazard event due to indirect impact (related to employment loss)
Percentage of farming
households PODES 2006
Percentage of farming households
This variable is used to observe the households which depend on farming as their main livelihood
Sources: Hewitt (1997), Puente (1999), Heinz Center for Science, Economics, and the Environment (2000)
Number of home/small-scale
industries PODES 2006
Number of home/small-scale industries
This variable is used to observe the households which have alternative livelihood other than farming
Percentage of farmlands PODES 2006 Percentage of farmlands This variable reflects the land use of the areas which could indicate the dependency of communities in farming Number of population
working as farm labour PODES 2006
Number of population working as farm labour
The type of livelihood is one factor that determines the level of social vulnerability within a community PODES 2006 Percentage of households with
electric lighting
The provision of electric lighting for households reflects the attainment of infrastructure services