Journal of Engineering Science and Technology Review 11 (2) (2018) 8- 12
Research Article
Detection Lung Cancer Using Gray Level Co-Occurrence Matrix (GLCM) and
Back Propagation Neural Network Classification
Kusworo Adi1, Catur Edi Widodo1, Aris Puji Widodo2, Rahmat Gernowo1, Adi Pamungkas3 and Rizky Ayomi Syifa1
1Department of Physics, Faculty of Science and Mathematics, Diponegoro University 2
Department of Informatics, Faculty of Science and Mathematics, Diponegoro University 3
Electromedical Engineering Academy, Indonesia
Received 8 October 2017; Accepted 7 March 2018
___________________________________________________________________________________________
Abstract
Lung cancer prevalence is one of the highest of cancers, at 18 %. One of the first steps in lung cancer diagnosis is sampling of lung tissues or biopsy. These tissue samples are then microscopically analyzed. This procedure is taken once imaging tests indicate the presence of cancer cells in the chest. Lung cancer diagnosis using lung tissue sample microscopic analysis has some weakness. One of them is that doctor still relies on subjective visual observation. A medical specialist must do thorough observation and accurate analysis in detecting lung cancer in patients. Hence, there is need for a system that is capable for detecting lung cancer automatically from microscopic images of biopsy. This method will improve the accuracy and efficiency for lung cancer detection. The aim of this research is to design a lung cancer detection system based on analysis of microscopic image of biopsy using digital image processing. Microscopic images of biopsy are feature extracted with the Gray Level Co-Occurrence Matrix (GLCM) method and classified using back propagation neural network. This method is implemented to detection both normal and cancerous lung of biopsy samples. In the stage of training, 20 biopsy image samples were analyzed using back propagation neural network with 95% accuracy. On the other hand, 16 biopsy samples were analyzed during testing, with an accuracy of 81.25%. These results show that microscopic biopsy image processing can be implemented in a system of lung cancer detection.
Keywords:
lung cancer, image processing, biopsy, microscopic, back propagation neural network
____________________________________________________________________________________________
1.Introduction
Prevalence of lung cancer is the highest of all types of cancer, which is 18% [1]. Lung cancer examination is done in three stages, that are CT Scan analysis, sputum examination, and lung tissue sampling (biopsy). The first step is usually an X-ray imaging, this step reveals the presence of lung cancer. The next two steps are needed for confirmation, that is sputum examination to find out there are cancer cells in the lungs and the biopsy examination is intended to show the presence of cancer cells in the chest. Diagnosis of lung cancer by microscopic analysis of lung tissue has some disadvantages with visual subjective. Therefore, a system that is able to automatically overcome lung cancer in the microscopic biopsy image to improve the objectivity and efficiency of lung cancer detection.
Digital image processing techniques are able to overcome lung cancer with various methods offered. This technique has been applied to variousmedical applications such as the detection of tuberculosis bacteria in microscopic sputum images [2,3], malaria detection causing phase of plasmodium falciparum [4,5,6], detection of lung cancer objects in CT scan [ 7, 8,9], and analysis of microscopic sputum samples for lung cancer [10,11,12]. Diagnosis of lung cancer with Naïve Bayes classification has been
performed in previous research [13]. In this study was done by Gray Level Co-Occurrence Matrix (GLCM) method and the results 88.57%.
Digital image processing for tuberculosis bacteria detection on microscopic sputum images (Ziehl-Neelsen Sputum Sample) has been developed in one research using the Otsu thresholding segmentation method on the HSV channel. The identification characteristics for tuberculosis bacteria are eccentricity, compactness, and metric, whereas the identification algorithm is back propagation neural network. This research resulted in an accuracy coefficient of 0.990 [3]. The other research to detect tuberculosis bacteria was carried out using the Otsu thresholding segmentation method on the NTSC channel. The identification characteristics are eccentricity and compactness, while the identification algorithm is the Support Vector Machine (SVM). This research resulted in a highly accurate detection system for microscopic sputum images to detect tuberculosis bacteria [4].
This next research was focused on the detection of malaria causing plasmodium falciparum using a microscopic imaging technique. The detection process used the Otsu thresholding segmentation method on the RGB color channel, and the identification algorithm used was back propagation neural network with plasmodium binary characteristics as its input. This particular research yielded an accuracy of 87.5% in identifying the developmental phase of plasmodium falciparum [5]. Yet another research successfully developed a system that employs a thresholding
Engineering Science and Technology Review
www.jestr.org
J
estr
______________
*E-mail address: [email protected]
segmentation method on the HSV channel with the decision tree algorithm used. This was aimed at identifying the developmental phase of plasmodium falciparum. The characteristics used for identification here are comparisons of image area and eccentricity. This research came up with an accuracy of 87.67% [6]. More samples of research on identification of plasmodium falciparum developmental phase employed adaptive color segmentation method and artificial neural network classification. Adaptive color segmentation was carried out on the HSV channel and the classification algorithm is back propagation neural network. This system scored 87.80% and 87.14% in plasmodium falciparum developmental phase identification accuracy, during training and testing, respectively [7].
The other research on lung cancer detection from CT scan images was carried using the median filter to enhance image qualities. The segmentation process was thresholding, while both morphology operation and edge detection were used to know the area of the lung. The identification process used here has four algorithms of Sequential Minimal Optimization (SMO), J48 Decision Tree, Logit Boost, and Naive Bayes. The highest accuracy was recorded for the Logit Boost segmentation process, with an accuracy of 98% [8]. This next research was focused on de-noising and the Wiener filter to get rid of noise on the images Thresholding and watershed methods were then employed. Meanwhile, the characteristics used for identification are area, circumference, and eccentricity. On the other, the identification process made us of the Support Vector Machines (SVM). It results in a highly accurate lung cancer detection system [9].
The next research developed a Non Local Mean filter to get rid of noises. This method made use of the Otsu thresholding method. Structural and texture characteristics were then used as inputs in identifying cancer cells with the help of the Support Vector Machines (SVM) algorithm. This resulted in 95.12% accuracy [10]. Other than being applied on CT scan lung images, digital image processing has also been utilized on microscopic sputum images to detect cancer cells. A research on sputum images was then further improved with the thresholding method to separate cancer objects on images of microscopic sputum. A histogram analyses was then used as an input to identify those cancer objects. The identification process employed the Bayesian classification and mean shift algorithms that resulted in an 87% accuracy [11].
The next research developed the thresholding method to separate nuclei (Blue Dyes) from cytoplasm (Red Dyes). The identification method used for the cancer cells was gray pixel, RGB pixel, and HSV pixel classifications. This research came up with highly accurate results as well [12]. One further research developed the method of histogram equalization to enhance image quality. The segmentation process here also employed artificial neural network algorithm. This was then compared to the thresholding method. Results showed that artificial neural network is better than the thresholding method [14].
Based on the above mentioned introduction and the previous researches, this research designs a system of lung cancer detection based on analysis of microscopic lung biopsy image. This system will help improving lung cancer examination by providing an automatic and objective technique that will certainly be beneficial in aiding doctor in accurately diagnosing and treating lung cancer.
2. Theory
2.1. Image Processing
A digital image is stated as a two dimensional function f(x, y), in which x and y are pixel coordinate positions, whereas f is the amplitude at coordinate (x, y), which indicates a value of pixel intensity. A digital image can be stated as the
Image processing is a discipline concerning things related to improvements of image quality, transformation, and features. Image processing is aimed at analyzing, extracting information, giving description, or recognizing objects in an image. Data compression and reduction for the purpose of storage, transmission, and processing are also some of the aspects studied in image processing. The inputs themselves are images, while the outputs are processed images.
2.2Features Extraction
Features extraction is the stage of highlighting and reducing an image from its higher to lower dimension. Features extraction is a quantitative information selection from readily available characteristics that classify object classes. Features extraction measures quantitative characteristics of each pixel.
Object recognition requires certain parameters that characterize that particular object. These parameters include shape, color, size, and texture. Each object is extracted for its features based on certain parameters and is then assigned a certain class.
The GLCM feature extraction method is a matrix that describes the occurrence frequency of two pixels with certain intensities at distance d and angular orientation θ within an image. GLCM feature extraction is carried out in 4 angular direction, each of which with a 45° interval; 0°, 45°, 90°, 135°. Features extraction that employs texture analysis is conducted by taking grayscale characteristics of an object that differentiate it from the other objects. These extracted characteristics include contrast, correlation, energy, and homogeneity [15][16][17].
2.2.1.Contrast
2.2.2. Correlation
Correlation brings out how correlated a reference pixel to its neighbor over an image. Correlation is defined as:
Correlation=
i
∑
j
∑
ijPd( )
i,j −µxµyσxσy (3)
where µx, µy and σx,σy are the mean and standard deviations of probability matrix GLCM along row wise x and column wise y.
2.2.3. Energy
Energy value describes the degree of grayness distribution in an image. Energy is written as:
Energy=
i
∑
j
∑
p2(i,j) (4)2.2.4. Homogeneity
Homogeneity features calculate the degree of homogeneity of grayness in an image. Homogeneity value is higher in images of almost the same degree of grayness. Homogeneity is defined as:
Homogeneity=
i
∑
j
∑
1p(i,+i−j)j (5)3. Method
This research develops a system of lung cancer detection based on the analysis of microscopic biopsy images using the technique of digital image processing. The procedure for image processing include converting RGB images into grayscale, extracting texture characteristics, and classifying using back propagation neural network algorithm. A block diagram for lung cancer diagnosis system using the technique of digital image processing is given in Fig. 1.
Fig. 1. Block diagram of the microscopic biopsy image analysis system.
a. Read Image
The image of biopsy samples taken from http://www.eusatlas.ro,
http://www.pathologyoutlines.com,and http://www.siumed.edu/.
b. RGB to grayscale image conversion
Microscopic lung biopsy images that comes in RGB format is converted into grayscale using the equation: 0.2989 * R + 0.5870 * G + 0.1140 * B.
c. Texture characteristics extraction
Converted grayscale images are then analyzed for their texture using the Gray Level Co-occurrence Matrix method as to obtain texture parameters of contrast, correlation, energy, and homogeneity.
d. Back Propagation Neural Network
Images are classified into two classes of cancer and non-cancer using the artificial neural network algorithm.
4. Result and Discussion
4.1. Microscope Lung Biopsy Image
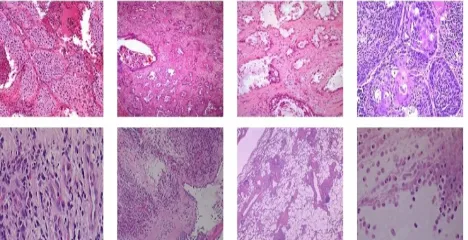
There are 38 images of microscopic lung biopsy that are categorized into cancer and non-cancer categories. Twenty (20) of those images belong to the cancer category and the remaining eighteen (18) is of non-cancer category. Some samples of microscopic lung biopsy images are shown in Fig. 2.
Fig. 2. Samples of microscopic lung biopsy images. (Above: cancer; below: non-cancer).
The process of image features extraction is carried out with texture analysis using the Gray Level Co-Occurrence Matrix (GLCM) method. This method works on the principle of calculating the probability of nearest neighbor between two pixels on certain distance and angular orientation. This approach builds co-occurrence matrices of image data, which in turn determine features as the matrix function of those images.
Co-occurrence means happening at the same time. This translates to the probability of one level of a pixel value being nearest to a value level of another pixel at certain distance (d) and angular orientation (θ). Distance is stated as pixels, while orientation is in degrees. Orientation is made up of four angular directions, each with a 45º interval. They are; 0º, 45º, 90º, and 135º, whereas the distance between two pixels is given as1 pixel.
A co-occurrence matrix is a square matrix whose number or elements is the square of pixel intensity level on an image. Each point
(
p,q)
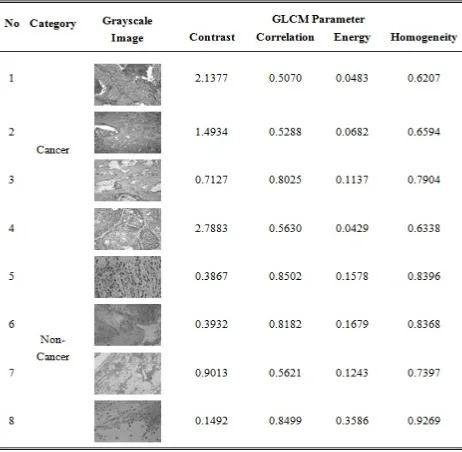
on a co-occurrence matrix containsthe probability of a pixel of value p being nearest to a neighboring pixel of value q at distance d and orientation θ. Then from that co-occurrence matrix, parameters of contrast, correlation, energy, and homogeneity are extracted as texture features. Samples of extracted microscopic lung biopsy image features are given in Table 1.
4.2. Image Classification
Table 1. Samples extracted features from microscopic lung biopsy images.
Table 2. Parameters used for back propagation artificial neural network..
Layout of the neural network architecture is shown in Fig. 3.
Fig. 3. Architecture for the back propagation neural network.
Results of microscopic lung biopsy image classification during training using the back propagation neural network is shown in Table 3.
Table 3. Training results for microscopic lung biopsy image classification using back propagation neural network.
It can be seen in Table 3 that one image class were incorrectly predicted that the accuracy of the training system is given as:
accuracy=number of correctly predicted class
number of total class ×
100%
=19
20× 100%
=95%
The artificial neural network resulted during the training stage is then used to predict image class on the testing stage. Results of artificial neural network on the testing stage are given in Table 4.
It is evident in Table 4 that five image classes were incorrectly predicted that the resulting testing system accuracy is given as:
accuracy=number of correctly predicted class
number of total class × developed artificial neural network algorithm show that this algorithm is capable of properly classifying microscopic lung biopsy images into either cancer or non-cancer class.
5. Conclusion
This research has successfully developed a system of microscopic lung biopsy image analysis to detect lung cancer. The digital image processing involves texture
features extraction using the Gray Level Co-Occurrence Matrix (GLCM) method and image classification using the back propagation neural network algorithm. Texture features are extracted based on parameters of contrast, correlation, energy, and homogeneity, whereas microscopic lung biopsy images are classified into either cancer or non-cancer class using the artificial neural network algorithm. This newly developed system is capable of classifying images with 95% accuracy on the training stage, and 81.25% accuracy on the testing stage. These two results prove that this system is http://www.pathologyoutlines.com, and http://www.siumed.edu/, the authors would like to thank to supported image sample of biopsy.
This is an Open Access article distributed under the terms of the 3. K. Adi, R. Gernowo, A. Sugiharto, A. Pamungkas, A.B. Putranto,
Autothresholding Segmentation For Tuberculosis Bacteria Identification In The Ziehl-Neelsen Sputum Sample, Proceedings The 7th International Conference on Information & Communication Technology and Systems (ICTS), 2013, pp. 9-13. 4. K. Adi, R. Gernowo, A. Sugiharto, K.S. Firdausi, A. Pamungkas,
and A.B. Putranto, Tuberculosis (TB) Identification in The Ziehl-Neelsen Sputum Sample in NTSC Channel and Support Vector Machine (SVM) Classification, International Journal of Innovative Research in Science, Engineering and Technology, Vol. 2, Issue 9, 2013.
5. K. Adi, S. Pujiyanto, R. Gernowo, A. Pamungkas, and A.B. Putranto, “Identification of Plasmodium Falciparum Phase in Red Blood Cells using Artificial Neural Networks, International Journal of Applied Engineering Research (IJAER), ISSN 0973-4562 Vol. 9, Number 23, 2014, pp. 13917-13924.
6. A.Pamungkas, K. Adi, and R. Gernowo, Identification of Plasmodium Falciparum Development Phase in Malaria Infected Red Blood Cells using Adaptive Color Segmentation and Decision Tree based Classification, International Journal of Applied Engineering Research ISSN 0973-4562 Vol. 10, Number 2, 2015, pp. 4043-4055.
7. K. Adi, S. Pujiyanto, R. Gernowo, A. Pamungkas, and A.B. Putranto, Identifying The Developmental Phase Of Plasmodium Falciparum In Malaria-Infected Red Blood Cells Using Adaptive Color Segmentation And Back Propagation Neural Network, International Journal of Applied EngineeringResearch ISSN 0973-4562 Vol. 11, Number 15, 2016, pp 8754-8759.
8. G. Vijaya, A. Suhasini, and R. Priya, Automatic Detection of Lung Cancer in CT Images, International Journal of Research in Engineering and Technology (IJRET) eISSN: 2319-1163 | PISSN: 2321-7308 Vol. 03 Special Issue 07, 2014.
9. V.A. Gajdhane and L.M. Deshpande, Detection of Lung Cancer Stages on CT scan Images by Using Various Image Processing
Techniques, IOSR Journal of Computer Engineering (IOSR-JCE), e-ISSN: 2278-0661, p-ISSN: 2278-8727, Vol. 16, Issue 5, 2014. pp. 28-35.
10. Neha and J. Shekhar, Early Detection of Lung Cancer Using Image Processing and Classification Technique, International Journal of Engineering Development and Research, ISSN: 2321-9939, Vol. 3, Issue 2, 2015, pp. 1290-1294.
11. F. Taher, N. Werghi, H. Al-Ahmad, and C. Donner, Extraction and Segmentation of Sputum Cells for Lung Cancer Early Diagnosis, Algorithms, ISSN 1999-4893, Vol. 6, 2013, pp. 512-531.
12. V. Kumar and H. Sharma, Extraction of Nuclear Region from Sputum Images through Pixel Classification for Early Lung Cancer Detection, International Journal of Computer Applications, ISSN 0975 – 8887, Vol. 72 Number 22, 2013. pp. 35-39.
13. S. Kaur and S. Kaur, Extraction of Sputum cells using Neural Network for Early Lung Cancer Detection, International Journal of Innovative Research in Computer and Communication Engineering (IJIRCE), ISSN (Online): 2320-9801, Vol. 3, Issue 8, 2015. pp. 7446-7453.
14. K. Adi, C.E, Widodo, A.P, Widodo, R. Gernowo, A. Pamungkas, and R. A. Syifa, Naïve Bayes Algorithm for Lung Cancer Diagnosis Using Image Processing Techniques, Advanced Science Letters, Volume 23, Number 3, March 2017, pp. 2296-2298(3) 15. R.C. Gonzales and R.E. Woods, Digital Image Processing, Prentice
Hall, New Jersey.
16. R.E. Haralick, K.Shanmugam, I.Dinstein, Textural Features for Image Classification, IEEE Transactionson Systems, Man and Cybernetics, Vol. SMC-3, No.6, Nov 1973
17. S. Peckinpaugh,An Improved Method for Computing Gray-Level Coocurrence Matrix Based Texture Measures, Computer Vision, Graphics, and Image Processing; Graphica l Models and Image Processing, Vol. 53, pp. 574-580, 1991