Albert Montillo · Michael Kelm
Henning Müller · Shaoting Zhang
Weidong Cai · Dimitris Metaxas (Eds.)
123
LNCS 9601
International Workshop, MCV 2015
Held in Conjunction with MICCAI 2015
Munich, Germany, October 9, 2015, Revised Selected Papers
Medical Computer
Lecture Notes in Computer Science
9601
Commenced Publication in 1973 Founding and Former Series Editors:
Gerhard Goos, Juris Hartmanis, and Jan van Leeuwen
Editorial Board
David HutchisonLancaster University, Lancaster, UK Takeo Kanade
Carnegie Mellon University, Pittsburgh, PA, USA Josef Kittler
University of Surrey, Guildford, UK Jon M. Kleinberg
Cornell University, Ithaca, NY, USA Friedemann Mattern
ETH Zurich, Zürich, Switzerland John C. Mitchell
Stanford University, Stanford, CA, USA Moni Naor
Weizmann Institute of Science, Rehovot, Israel C. Pandu Rangan
Indian Institute of Technology, Madras, India Bernhard Steffen
TU Dortmund University, Dortmund, Germany Demetri Terzopoulos
University of California, Los Angeles, CA, USA Doug Tygar
University of California, Berkeley, CA, USA Gerhard Weikum
Bjoern Menze
•Georg Langs
Albert Montillo
•Michael Kelm
Henning M
ü
ller
•Shaoting Zhang
Weidong Cai
•Dimitris Metaxas (Eds.)
Medical Computer
Vision: Algorithms
for Big Data
International Workshop, MCV 2015
Held in Conjunction with MICCAI 2015
Munich, Germany, October 9, 2015
Revised Selected Papers
TU München
State University of New Jersey Rutgers Piscataway, NJ
Library of Congress Control Number: 2016946962
LNCS Sublibrary: SL6–Image Processing, Computer Vision, Pattern Recognition, and Graphics ©Springer International Publishing Switzerland 2016
This work is subject to copyright. All rights are reserved by the Publisher, whether the whole or part of the material is concerned, specifically the rights of translation, reprinting, reuse of illustrations, recitation, broadcasting, reproduction on microfilms or in any other physical way, and transmission or information storage and retrieval, electronic adaptation, computer software, or by similar or dissimilar methodology now known or hereafter developed.
The use of general descriptive names, registered names, trademarks, service marks, etc. in this publication does not imply, even in the absence of a specific statement, that such names are exempt from the relevant protective laws and regulations and therefore free for general use.
The publisher, the authors and the editors are safe to assume that the advice and information in this book are believed to be true and accurate at the date of publication. Neither the publisher nor the authors or the editors give a warranty, express or implied, with respect to the material contained herein or for any errors or omissions that may have been made.
Printed on acid-free paper
This Springer imprint is published by Springer Nature
Preface
This book includes articles from the 2015 MICCAI (Medical Image Computing for Computer Assisted Intervention) workshop on Medical Computer Vision (MCV) that was held on October 9, 2015, in Munich, Germany. The workshop followed up on similar events in the past years held in conjunction with MICCAI and CVPR.
The workshop obtained 22 high-quality submissions that were all reviewed by at least three external reviewers. Borderline papers were further reviewed by the orga-nizers to obtain the most objective decisions for thefinal paper selection. Ten papers (45%) were accepted as oral presentations and anotherfive as posters after the authors responded to all review comments. The review process was double-blind.
In addition to the accepted oral presentations and posters, the workshop had three invited speakers. Volker Tresp, both at Siemens and Ludwig Maximilians University of Munich, Germany, presented large-scale learning in medical applications. This covered aspects of image analysis but also the inclusion of clinical data.
Pascal Fua of EPFL, Switzerland, discussed multi-scale analysis using machine-learning techniques in the delineation of curvilinear structures. Antonio Cri-minisi presented a comparison of deep learning approaches with random forests and his personal experiences in working with and comparing the two approaches.
The workshop resulted in many lively discussions and showed well the current trends and tendencies in medical computer vision and how the techniques can be used in clinical work and on large data sets.
These proceedings start with a short overview of the topics that were discussed during the workshop and the discussions that took place during the sessions, followed by the one invited and 15 accepted papers of the workshop.
We would like to thank all the reviewers who helped select high-quality papers for the workshop and the authors for submitting and presenting high-quality research, all of which made MICCAI-MCV 2015 a great success. We plan to organize a similar workshop at next year’s MICCAI conference in Athens.
December 2015 Bjoern Menze
General Co-chairs
Bjoern Menze, Switzerland Georg Langs, Austria Albert Montillo, USA Michael Kelm, Germany Henning Müller, Switzerland Shaoting Zhang, USA Weidong Cai, Australia Dimitris Metaxas, USA
Publication Chair
Henning Müller, Switzerland
International Program Committee
Allison Nobel University of Oxford, UK Cagatay Demiralp Stanford University, USA Christian Barrillot IRISA Rennes, France Daniel Rueckert Imperial College London, UK
Diana Mateus TU München, Germany
Dinggang Shen UNC Chapel Hill, USA
Ender Konukoglu Harvard Medical School, USA
Guorong Wu UNC Chapel Hill, USA
Hayit Greenspan Tel Aviv University, Israel
Hien Nguyen Siemens, USA
Horst Bischof TU Graz, Austria
Jan Margeta Inria, France
Juan Iglesias Harvard Medical School, USA
Jurgen Gall Bonn University, Germany
Kayhan Batmanghelich MIT, USA
Kilian Pohl Stanford University, USA
Le Lu NIH, USA
Lin Yang University of Florida, USA
Luping Zhou University of Wollongong, Australia Marleen de Bruijne EMC Rotterdam, The Netherlands Matthew Blaschko Ecole Centrale Paris, France
Matthias Schneider ETH Zurich, Switzerland Michael Wels Siemens Healthcare, Germany
Paul Suetens KU Leuven, Belgium
Ron Kikinis Harvard Medical School, USA Ruogu Fang Florida International University, USA Tom Vercauteren University College London, UK Vasileios Zografos TU München, Germany
Yang Song University of Sydney, Australia
Yiqiang Zhan Siemens, USA
Yefeng Zheng Siemens Corporate Research, USA
Yong Xia Northwestern Polytechnical University, China
Yong Fan University of Pennsylvania, USA
Yue Gao UNC Chapel Hill, USA
Sponsors
European Commission 7thFramework Programme, VISCERAL (318068).
over a Wide Range of Scales
(Invited Paper)
Pascal Fua and Graham Knott
EPFL, 1015 Lausanne, Switzerland
Pascal.Fua@epfl.ch, Graham.Knott@epfl.ch http://cvlab.epfl.ch/research
Abstract.We briefly review the Computer Vision techniques we have devel-oped at EPFL to automate the analysis of Correlative Light and Electron Microscopy data. They include delineating dendritic arbors from LM imagery, segmenting organelles from EM, and combining the two into a consistent representation.
Keywords: Brain Connectivity Microscopy Delineation Segmentation
Registration
Overview
If we are ever to unravel the mysteries of brain function at its most fundamental level, we will need a precise understanding of how its component neurons connect to each other. Electron Microscopes (EM) can now provide the nanometer resolution that is needed to image synapses, and therefore connections, while Light Microscopes (LM) see at the micrometer resolution required to model the 3D structure of the dendritic network. Since both the topology and the connection strength are integral parts of the brain's wiring diagram, being able to combine these two modalities is critically important.
In fact, these microscopes now routinely produce high-resolution imagery in such large quantities that the bottleneck becomes automated processing and interpretation, which is needed for such data to be exploited to its full potential.
In our work, we have therefore used correlative microscopy image stacks such as those described in Fig. 1 and we have developed approaches to automatically building the dendritic arborescence in LM stacks [5, 6], to segmenting intra-neuronal structures from EM images [1, 4], and to registering the resulting models [3]. Figure 1 depicts some of these results. In all cases, Statistical Machine Learning algorithms are key to obtaining good results. Therefore, our challenge is now to develop Domain Adaptation
techniques that will allow us to retrain them quickly and without excessive amounts of additional annotated data when new image data is acquired [2]. For additional details on this work, we refer the interested reader to the above mentioned publications.
(a) (b) (c)
Fig. 1.Correlative Microscopy. (a) Fluorescent neurons in vivo in the adult mouse brain imaged through a cranial window. (b) Image stack at the 1μm resolution acquired using a 2-photon microscope. (c) Image slice of a sub-volume at the 5 nm resolution above a reconstruction of a neuron, dendrite, and associated organelles.
(a) (b)
Fig. 2. Automated delineation and segmentation. (a) Dendrites from an LM Stack. (b) Mitochondria from an EM stack. The colors denote those that are either within a dendrite or an axon.
References
1. Becker, C., Ali, K., Knott, G., Fua, P.: Learning context cues for synapse segmentation. IEEE Trans. Med. Imaging (2013)
2. Becker, C., Christoudias, M., Fua, P.: Domain adaptation for microscopy imaging. IEEE Trans. Med. Imaging (2015)
3. Glowacki, P., Pinheiro, M., Turetken, E., Sznitman, R., Lebrecht, D., Holtmaat, A., Kybic, J., Fua, P.: Modeling evolving curvilinear structures in time-lapse imagery. In: Conference on Computer Vision and Pattern Recognition (2014)
4. Lucchi, A., Smith, K., Achanta, R., Knott, G., Fua, P.: Supervoxel-based segmentation of mitochondria in EM image stacks with learned shape features. IEEE Trans. Med. Imaging31
(2), 474–486 (2012)
5. Turetken, E., Benmansour, F., Andres, B., Pfister, H., Fua, P.: Reconstructing loopy curvi-linear structures using integer programming. In: Conference on Computer Vision and Pattern Recognition, June 2013
Contents
Workshop Overview
Overview of the 2015 Workshop on Medical Computer
Vision—Algorithms for Big Data (MCV 2015) . . . . 3 Henning Müller, Bjoern Menze, Georg Langs, Albert Montillo,
Michael Kelm, Shaoting Zhang, Weidong Cai, and Dimitris Metaxas
Predicting Disease
Information-Theoretic Clustering of Neuroimaging Metrics Related
to Cognitive Decline in the Elderly . . . 13 Madelaine Daianu, Greg Ver Steeg, Adam Mezher, Neda Jahanshad,
Talia M. Nir, Xiaoran Yan, Gautam Prasad, Kristina Lerman, Aram Galstyan, and Paul M. Thompson
Relationship Induced Multi-atlas Learning for Alzheimer’s
Disease Diagnosis . . . 24 Mingxia Liu, Daoqiang Zhang, Ehsan Adeli-Mosabbeb,
and Dinggang Shen
Atlas Exploitation and Avoidance
Hierarchical Multi-Organ Segmentation Without Registration
in 3D Abdominal CT Images . . . 37 Vasileios Zografos, Alexander Valentinitsch, Markus Rempfler,
Federico Tombari, and Bjoern Menze
Structure Specific Atlas Generation and Its Application to Pancreas
Segmentation from Contrasted Abdominal CT Volumes. . . 47 Ken’ichi Karasawa, Takayuki Kitasaka, Masahiro Oda,
Yukitaka Nimura, Yuichiro Hayashi, Michitaka Fujiwara, Kazunari Misawa, Daniel Rueckert, and Kensaku Mori
Machine Learning Based Analyses
Local Structure Prediction with Convolutional Neural Networks
Automated Segmentation of CBCT Image with Prior-Guided Sequential
Random Forest . . . 72 Li Wang, Yaozong Gao, Feng Shi, Gang Li, Ken-Chung Chen,
Zhen Tang, James J. Xia, and Dinggang Shen
Subject-Specific Estimation of Missing Cortical Thickness Maps
in Developing Infant Brains . . . 83 Yu Meng, Gang Li, Yaozong Gao, John H. Gilmore, Weili Lin,
and Dinggang Shen
Advanced Methods for Image Analysis
Calibrationless Parallel Dynamic MRI with Joint Temporal Sparsity . . . 95 Yang Yu, Zhennan Yan, Li Feng, Dimitris Metaxas, and Leon Axel
Creating a Large-Scale Silver Corpus from Multiple
Algorithmic Segmentations. . . 103 Markus Krenn, Matthias Dorfer, Oscar Alfonso Jiménez del Toro,
Henning Müller, Bjoern Menze, Marc-AndréWeber, Allan Hanbury, and Georg Langs
Psoas Major Muscle Segmentation Using Higher-Order Shape Prior . . . 116 Tsutomu Inoue, Yoshiro Kitamura, Yuanzhong Li, Wataru Ito,
and Hiroshi Ishikawa
Poster Session
Joint Feature-Sample Selection and Robust Classification for Parkinson’s
Disease Diagnosis . . . 127 Ehsan Adeli-Mosabbeb, Chong-Yaw Wee, Le An, Feng Shi,
and Dinggang Shen
Dynamic Tree-Based Large-Deformation Image Registration
for Multi-atlas Segmentation. . . 137 Pei Zhang, Guorong Wu, Yaozong Gao, Pew-Thian Yap,
and Dinggang Shen
Hippocampus Segmentation from MR Infant Brain Images
via Boundary Regression . . . 146 Yeqin Shao, Yanrong Guo, Yaozong Gao, Xin Yang, and Dinggang Shen
A Survey of Mathematical Structures for Extending 2D Neurogeometry
Efficient 4D Non-local Tensor Total-Variation for Low-Dose CT Perfusion
Deconvolution . . . 168 Ruogu Fang, Ming Ni, Junzhou Huang, Qianmu Li, and Tao Li
Author Index . . . 181
Overview of the 2015 Workshop
on Medical Computer Vision —
Algorithms for Big Data (MCV 2015)
Henning M¨uller1,2,11(B), Bjoern Menze3,4, Georg Langs5,6, Albert Montillo7,
Michael Kelm8, Shaoting Zhang9, Weidong Cai10,11, and Dimitris Metaxas12
1 University of Applied Sciences Western Switzerland (HES–SO), Sierre, Switzerland
2 University Hospitals and University of Geneva, Geneva, Switzerland 3 Technical University of Munich, Munich, Germany
4 INRIA, Sophia–antipolis, France 5 Medical University of Vienna, Vienna, Austria
6 MIT, Cambridge, MA, USA
7 GE Global Research, Niskayuna, USA 8 Siemens Healthcare, Erlangen, Germany
9 UNC Charlotte, Charlotte, USA 10 University of Sydney, Sydney, Australia
11 Harvard Medical School, Boston, USA 12 Rutgers University, New Brunswick, USA
Abstract. The 2015 workshop on medical computer vision (MCV): algorithms for big data took place in Munich, Germany, in connection with MICCAI (Medical Image Computing for Computer Assisted Inter-vention). It is the fifth MICCAI MCV workshop after those held in 2010, 2012, 2013 and 2014 with another edition held at CVPR 2012 previ-ously. This workshop aims at exploring the use of modern computer vision technology in tasks such as automatic segmentation and regis-tration, localisation of anatomical features and extraction of meaning-ful visual features. It emphasises questions of harvesting, organising and learning from large–scale medical imaging data sets and general–purpose automatic understanding of medical images. The workshop is especially interested in modern, scalable and efficient algorithms that generalise well to previously unseen images. The strong participation in the work-shop of over 80 persons shows the importance of and interest in Medical Computer Vision. This overview article describes the papers presented at the workshop as either oral presentations or posters. It also describes the three invited talks that received much attention and a very positive feedback and the general discussions that took place during workshop.
Keywords: Medical image analysis
·
Medical computer vision·
Segmentation·
Detectionc
Springer International Publishing Switzerland 2016
1
Introduction
The Medical Computer Vision workshop (MCV) took place in conjunction with MICCAI (Medical Image Computing for Computer–Assisted Interventions) on October 9, 2015 in Munich, Germany. This fifth workshop on medical com-puter vision was organised in connection with MICCAI after the workshops in 2010 [12], 2012 [10], 2013 [11] and 2014 [14] and an additional workshop at CVPR in 2012. The workshop received 22 submissions and ten papers were accepted as oral presentations and another 5 papers were accepted as posters. In addition to these scientific papers three invited speakers presented, linked to the main top-ics of the workshop, so big data and clinical data intelligence, multi–scale mod-elling and machine learning approaches for medical imaging with a comparison of decision forests with deep learning. All these approaches were also strongly represented at the main MICCAI conference. This article summaries the pre-sentations and posters of the workshop and also the main discussions that took place during the sessions and the breaks. All papers are presented in the post workshop proceedings that allowed authors to include the comments that were received during the workshop into the final versions of their texts.
2
Papers Presented at the Workshop
The oral presentations were separated into four topic areas: papers on predicting disease, atlas exploitation and avoidance, machine learning–based analysis and the last session on advanced methods for image analysis.
2.1 Predicting Disease
Daianu et al. [2] identify latent factors that explain how sets of biomarkers cluster together and how the clusters significantly predict cognitive decline in Alzheimer’s disease (AD). Meanwhile, to diagnose Alzheimer’s with higher accu-racy, Liu et al. [8] employ a multi–atlas strategy which models the relationships among the atlases and among the subjects and an ensemble AD/MCI (Mild Cognitive Impairment) classification approach.
2.2 Atlas Exploitation and Avoidance
Overview of the 2015 Workshop on Medical Computer Vision 5
2.3 Machine Learning–Based Analysis
Dvorak et al. [3] propose a convolutional neural network to form a local structure prediction approach for 3D segmentation tasks and apply it for brain tumor segmentation in MRI. Using a different machine learning strategy Wang et al. [16] develop a sequential random forest guided by voting based probability maps and apply it for the automated segmentation of cone–beam computed tomography in cases of facial deformity. Meng et al. [9] use a different random forest approach based on regression forests with added capabilities to ensure spatial smoothness and apply it to impute missing cortical thickness maps in longitudinal studies of developing infant brains.
2.4 Advanced Methods for Image Analysis
Yu et al. [17] develop an efficient image reconstruction algorithm for parallel dynamic MRI, which does not require coil sensitivity profiles and models the correlated pixel intensities across time and across coils using a joint temporal sparsity.
Krenn et al. [7] use research algorithms that were submitted in the VIS-CERAL benchmark to run them on non–annotated data sets. Label fusion of the results of challenge participants then allows to create a so–called silver cor-pus that has shown to be better than the best system in the competition and can be useful to train new algorithms. The approach uses relatively simple label fusion. Inoue et al. [5] use higher order graph cuts to segment the posts major muscle, a difficult structure in terms of structure contrast. The approach uses prior knowledge to estimate shapes.
2.5 Poster Session
The poster session took place during the lunch break and allowed all authors to also present their results in a poster, which is often the most adapted form to foster discussions among persons working on closely related topics.
In [1], Adeli et al. present an approach for the classification of Parkinson’s disease patients using MRI data. A joint feature–sample section process is used to select the most robust subset of features leading to promising results on synthetic and real databases.
Zhang et al. [18] present an approach to multi–atlas segmentation. To solve the problem of potentially large anatomical differences between pair–wise regis-trations, coarse registrations are first obtained in a tree like structure to reduce the potential misalignment and improve segmentation results.
Shay et al. [15] present a new approach for the segmentation of the hip-pocampus in MRI infant brains. A boundary regression method is used to deal with the strong differences that infant brains have compared to adult brains.
In [4], Fang et al. present and approach to 4D hemodynamic data analysis by fusing the local anatomical structure correlation and temporal blood flow continuation. The approach limits local artefacts and leads to better results than previous approaches.
3
Invited Speakers
3.1 Volker Tresp
Volker Tresp from Siemens and LMU (Ludwig Maximilians University) Munich, Germany gave a talk about structured relational learning and the role of knowl-edge graphs in the capturing and representation of clinical data for large-scale learning problems. He discussed the role of tensor factorizations in the learning with graph structured data, and the possible impact on understanding, predict-ing, and modelling clinical events, and the large amount of linked clinical data available. The talk highlighted several aspect of big data in clinical environments and thus the topic of the workshop.
3.2 Pascal Fua
Pascal Fua of the EPFL (Ecole Polytechnique Federal de Lausanne), Switzer-land presented impressive results on the use of machine learning techniques in the delineation of curvilinear structures, and reconstruction of networks such as neurons in microscopy data. Specifically he discussed approaches that overcome discontinuities and occlusions, to reconstruct a network despite imperfect data. A multi scale analysis was used.
3.3 Antonio Criminisi
Overview of the 2015 Workshop on Medical Computer Vision 7
4
Discussions at the Workshop
One of the dominating topics at the conference and also at the workshop were the applied machine learning techniques and particularly the use of convolutional neural networks in various tasks of imaging such as segmentation, detection and classification. Choosing the right techniques and tools and then optimizing them is seen as a key to success.
Many people mentioned large data sets to be analysed as important for get-ting good results but also the challenges in getget-ting large data sets. Multi-Centre studies and partly incomplete data sets were another topic discussed and where solutions would strongly help many of the existing techniques. Using data from several centers can create larger cohorts but standardization of imaging and meta data are challenges.
Where many data sets are now available get much annotated data with seg-mentations or regions of interest remains a challenge. Annotations are expensive to obtain and the tasks are often containing some subjectivity. In this context scientific challenges were highlighted as important to share data and also tools around a common objective.
5
Conclusions
Much positive feedback was given at the end of the workshop on the invited talks and the scientific presentations. The use of larger data sets and also longi-tudinal data were seen as important next steps. Quality ground truth and region annotations were other aspects mentioned to be important and the integration of image data with other clinical data sources to get more complete clinical analysis. Much work in medical computer vision is still required for the current challenges of quantitative medical image analysis and to bring at least a few of the tools into clinical practice in the foreseeable future.
Acknowledgments. This work was supported by the EU in the FP7 through the VISCERAL (318068) project.
References
1. Adeli-M, E., Wee, C.Y., An, L., Shi, F., Shen, D.: Joint feature-sample selection and robust classification for parkinson’s disease diagnosis. In: Menze, B., Langs, G., M¨uller, H., Montillo, A., Kelm, M., Zhang, S., Cai, W., Metaxas, D. (eds.) MICCAI Workshop on Medical Computer Vision. LNCS, vol. 9601, pp. 127–136. Springer, Heidelberg (2015)
3. Dvorak, P., Menze, B.: Structured prediction with convolutional neural networks for multimodal brain tumor segmentation. In: Menze, B., Langs, G., M¨uller, H., Montillo, A., Kelm, M., Zhang, S., Cai, W., Metaxas, D. (eds.) MICCAI Workshop on Medical Computer Vision. LNCS, vol. 9601, pp. 59–71. Springer, Heidelberg (2015)
4. Fang, R., Ni, M., Huang, J., Li, Q., Li, T.: A efficient 4d non-local tensor total-variation for low-dose ct perfusion deconvolution. In: Menze, B., Langs, G., M¨uller, H., Montillo, A., Kelm, M., Zhang, S., Cai, W., Metaxas, D. (eds.) MICCAI Work-shop on Medical Computer Vision. LNCS, vol. 9601, pp. 168–179. Springer, Hei-delberg (2015)
5. Inoue, T., Kitamura, Y., Li, Y., Ito, W., Ishikawa, H.: Psoas major muscle seg-mentation using higher-order shape prior. In: Menze, B., Langs, G., M¨uller, H., Montillo, A., Kelm, M., Zhang, S., Cai, W., Metaxas, D. (eds.) MICCAI Workshop on Medical Computer Vision. LNCS, vol. 9601, pp. 116–124. Springer, Heidelberg (2015)
6. Karasawa, K., Oda, M., Mori, K., Kitasaka, T.: Structure specific atlas generation and its application to pancreas segmentation from contrasted abdominal CT vol-umes. In: Menze, B., Langs, G., M¨uller, H., Montillo, A., Kelm, M., Zhang, S., Cai, W., Metaxas, D. (eds.) MICCAI Workshop on Medical Computer Vision. LNCS, vol. 9601, pp. 47–56. Springer, Heidelberg (2015)
7. Krenn, M., Dorfer, M., Jim`enez del Toro, O., Menze, B., M¨uller, H., Weber, M.A., Hanbury, A., Langs, G.: Creating a large-scale silver corpus from multiple algorith-mic segmentations. In: Menze, B., Langs, G., M¨uller, H., Montillo, A., Kelm, M., Zhang, S., Cai, W., Metaxas, D. (eds.) MICCAI Workshop on Medical Computer Vision. LNCS, vol. 9601, pp. 103–115. Springer, Heidelberg (2015)
8. Liu, M., Zhang, D., Shen, D.: Relationship induced multi-atlas learning for alzheimer’s disease diagnosis. In: Menze, B., Langs, G., M¨uller, H., Montillo, A., Kelm, M., Zhang, S., Cai, W., Metaxas, D. (eds.) MICCAI Workshop on Medical Computer Vision. LNCS, vol. 9601, pp. 24–33. Springer, Heidelberg (2015) 9. Meng, Y., Li, G., Gao, Y., Lin, W., Gilmore, J., Shen, D.: Subject-specific
estima-tion of missing cortical thickness in dynamic developing infant brains. In: Menze, B., Langs, G., M¨uller, H., Montillo, A., Kelm, M., Zhang, S., Cai, W., Metaxas, D. (eds.) MICCAI Workshop on Medical Computer Vision. LNCS, vol. 9601, pp. 83–92. Springer, Heidelberg (2015)
10. Langs, G., Lu, L., Montillo, A., Tu, Z., Criminisi, A., Menze, B.H. (eds.): MCV 2012. LNCS, vol. 7766. Springer, Heidelberg (2013)
11. Menze, H.B., Langs, G., Montillo, A., Kelm, M., M¨uller, H., Tu, Z. (eds.): MCV 2013. LNCS, vol. 8331. Springer, Heidelberg (2014)
12. Menze, B.H., Langs, G., Tu, Z., Criminisi, A. (eds.): MICCAI-MCV 2010. LNCS, vol. 6533. Springer, Heidelberg (2010)
13. Miolane, N., Pennec, X.: A survey of mathematical structures for extending 2d neurogeometry to 3d image processing. In: Menze, B., Langs, G., M¨uller, H., Mon-tillo, A., Kelm, M., Zhang, S., Cai, W., Metaxas, D. (eds.) MICCAI Workshop on Medical Computer Vision. LNCS, vol. 9601, pp. 155–167. Springer, Heidelberg (2015)
Overview of the 2015 Workshop on Medical Computer Vision 9
15. Shao, Y., Gao, Y., Yang, X., Shen, D.: Hippocampus segmentation from infant brains via boundary regression. In: Menze, B., Langs, G., M¨uller, H., Montillo, A., Kelm, M., Zhang, S., Cai, W., Metaxas, D. (eds.) MICCAI Workshop on Medical Computer Vision. LNCS, vol. 9601, pp. 146–154. Springer, Heidelberg (2015) 16. Wang, L., Gao, Y., Shi, F., Li, G., Xia, J., Shen, D.: Automated segmentation of
CBCT image with prior-guided sequential random forest. In: Menze, B., Langs, G., M¨uller, H., Montillo, A., Kelm, M., Zhang, S., Cai, W., Metaxas, D. (eds.) MICCAI Workshop on Medical Computer Vision. LNCS, vol. 9601, pp. 72–82. Springer, Heidelberg (2015)
17. Yu, Y., Yan, Z., Metaxas, D., Axel, L.: Calibrationless parallel dynamic mri with joint temporal sparsity. In: Menze, B., Langs, G., M¨uller, H., Montillo, A., Kelm, M., Zhang, S., Cai, W., Metaxas, D. (eds.) MICCAI Workshop on Medical Com-puter Vision. LNCS, vol. 9601, pp. 95–102. Springer, Heidelberg (2015)
18. Zhang, P., Wu, G., Gao, Y., Yap, P.T., Shen, D.: Dynamic tree-based large-deformation image registration for multi-atlas segmentation. In: Menze, B., Langs, G., M¨uller, H., Montillo, A., Kelm, M., Zhang, S., Cai, W., Metaxas, D. (eds.) MICCAI Workshop on Medical Computer Vision. LNCS, vol. 9601, pp. 137–145. Springer, Heidelberg (2015)
Information-Theoretic Clustering
of Neuroimaging Metrics Related to Cognitive
Decline in the Elderly
Madelaine Daianu1,2(&), Greg Ver Steeg3, Adam Mezher1, Neda Jahanshad1, Talia M. Nir1, Xiaoran Yan2, Gautam Prasad1,
Kristina Lerman3, Aram Galstyan3, and Paul M. Thompson1,2,4 1
Imaging Genetics Center, Mark and Mary Stevens Institute for Neuroimaging and Informatics, University of Southern California, Marina del Rey, CA, USA
2
Department of Neurology, UCLA School of Medicine, Los Angeles, CA, USA
3
USC Information Sciences Institute, Marina del Rey, CA, USA
4 Departments of Neurology, Psychiatry, Radiology, Engineering, Pediatrics,
and Ophthalmology, University of Southern California, Los Angeles, CA, USA
Abstract. As Alzheimer’s disease progresses, there are changes in metrics of brain atrophy and network breakdown derived from anatomical or diffusion MRI. Neuroimaging biomarkers of cognitive decline are crucial to identify, but few studies have investigated how sets of biomarkers cluster in terms of the information they provide. Here, we evaluated more than 700 frequently studied diffusion and anatomical measures in 247 elderly participants from the Alzheimer’s Disease Neuroimaging Initiative (ADNI). We used a novel
unsu-pervised machine learning technique - CorEx - to identify groups of measures with high multivariate mutual information; we computed latent factors to explain correlations among them. We visualized groups of measures discovered by CorEx in a hierarchical structure and determined how well they predict cognitive decline. Clusters of variables significantly predicted cognitive decline, including measures of cortical gray matter, and correlated measures of brain networks derived from graph theory and spectral graph theory.
Keywords: Machine learning
Diffusion weighted imaging Brain connectivitySpectral graph theoryGray matter1 Introduction
Neuroimaging offers a broad range of predictors of cognitive decline in aging and Alzheimer’s disease, and it is vital to find out how different predictors relate to each other, and what common and distinctive information each set of predictors provides. In neurodegenerative conditions such as Alzheimer’s disease, standard MRI techniques can be used to detect gray and white matter loss in the brain, andfluid space expansions that index these changes. A variant of MRI–diffusion weighted imaging (DWI)– is increasingly used to reveal white matter microstructure abnormalities not detectable with standard MRI. Despite the greater information available from DWI, we know far ©Springer International Publishing Switzerland 2016
less about the microstructural changes that accompany cortical changes, and which diffusion-derived metrics change the most with disease. Recently, DWI has been added to major neuroimaging initiatives to better understand changes in white matter integrity and connectivity.
An important question in diffusion MRI is which DWI metrics best predict cognitive decline or differentiate between healthy elderly people and patients with Alzheimer’s disease. It is also important to compare diffusion-derived measures to more standard anatomical measures of brain atrophy (such as gray matter volume measures); com-bining metrics may improve the prediction of cognitive decline. Here, we assessed a variety of DWI measures including standard ones based on the diffusion tensor – fractional anisotropy, mean, radial and axial diffusivity (FA, MD, RD and AxD). We computed these measures from 57 distinct white matter regions of interest (ROIs). We also assessed measures of brain connectivity, including network metrics (including nodal degree, efficiency, and path length, among others), and more exotic metrics from spectral graph theory–a branch of mathematics less frequently applied in the context of Alzheimer’s disease [1,2] but widely used to analyze network topology, as well as bottlenecks and informationflow in graphs and networks. Brain connectivity measures describe the level of connectedness among various pairs of brain regions (such as cortical regions); these are further detailed in theMethodssection.
We implemented a novel unsupervised Correlation Explanation method (called CorEx) [3–5] to construct a hierarchical network that quantitatively and visually characterizes relationships among a large set of variables. CorEx does this by learning low-dimensional representations that reflect correlations among variables. We esti-mated the significance of each group of DWI measures as detected by CorEx for predicting cognitive decline. To do this, we attempted to predict three widely used cognitive decline scores – (1) the Mini Mental State Examination (MMSE), (2) the Alzheimer’s disease Assessment Scale-cognitive subscale (ADAS-Cog), and (3) the global Clinical Dementia Rating Sum of Boxes scores (CDR-SOB).
2 Methods
2.1 Participants and Diffusion-Weighted Brain Imaging
DWI (128×128 matrix; voxel size: 2.7 ×2.7×2.7 mm3; scan time = 9 min). 46 separate images were acquired per subject: 5 T2-weighted images with no diffusion sensitization (b0images) and 41 diffusion-weighted images (b= 1000 s/mm2). Image preprocessing was performed as described previously in [6–8].
2.2 White Matter (WM) Tract Atlas ROI Computation
The JHU DTI atlas [9] was registered to each participant’s FA map using a mutual information-based elastic registration technique [10]. Then, using nearest neighbor interpolation, we applied the deformation fields to the JHU ‘Eve’ WM atlas labels (http://cmrm.med.jhmi.edu/cmrm/atlas/human_data/file/AtlasExplanation2.htm) to over-lay them on the individual imaging data. We calculated the average FA, MD, RD and AxD within the 52 JHU ROIs for each participant; we excluded 4 ROIs: the left and right hemisphere middle cerebellar peduncle and pontine crossing tract. These were excluded as they often fall outside of the FOV. In addition to the 52 ROIs, 5 more were computed: bilateralgenu, body andspleniumof the corpus callosum, the corpus cal-losum as a whole, and the bilateralfornix.
2.3 Cortical Measures
Cortical gray matter measures were extracted from the T1-weighted structural MRI scans using FreeSurfer software, version 5.3 (http://surfer.nmr.mgh.harvard.edu/) [11]. 34 cortical labels were extracted for each hemisphere from the Desikan-Killiany atlas [12]. Parcellations were reviewed for quality control and manually corrected for errors by a neuroanatomically trained image analyst. We extracted measures of gray matter volumes, surface area and thickness for each ROI.
2.4 ComputingNxNConnectivity Matrices
To map the brain’s fiber connections and create cortical connectivity networks, we combined whole-brain tractography from the DWIs with an automatically labeled set of brain regions from the high-resolution T1-weighted MRIs. To do this, we first per-formed tractography using Camino (http://cmic.cs.ucl.ac.uk/camino/) to recover >80,000 streamlines (below called “fibers” for simplicity) per participant, using a HARDI reconstruction scheme. During processing, we filtered out fibers less than 25 mm in length, which tend to be false positivefibers, and removed all duplicates. As described above, 68 cortical labels were automatically extracted from all aligned T1-weighted structural MRI scans using FreeSurfer, version 5.3. The resulting T1-weighted images and cortical models were linearly aligned to the space of the DWIs. The DWIs (and fiber tracts) were further elastically registered to the T1-weighted image to account for susceptibility artifacts.
For each participant, we detected the fibers connecting each pair of ROIs by considering the white matter tractography and the cortical parcellations. These were enumerated in a 68×68 connectivity matrix based on the 34 ROIs in each hemisphere;
each element of the matrix was normalized by the total number offibers detected per brain. Finally, we used the connectivity matrices to define each participant’s brain network– as a set of nodes (ROIs) and edges (fiber pathways).
2.5 DWI-Derived Metrics
Graph theory:Structural networks are usually modeled as weighted or unweighted undirected graphs, containing a set of nodes,N, and edges,E. Using the weighted and binary form of the connectivity matrices, we computed some of most commonly cited graph theory metrics. The nodal degree describes the total number of edges that connect to a node,i:ki¼P
j2N
aij, where is theaijis a connections status between nodes
iandj(aij¼1 if nodesiandjare connected and 0 otherwise); we assessed this at both
the nodal (at each of the 68 ROIs) and global levels (average across all 68 ROIs). The weighted version of the nodal degree is also called thenodal strength, which we also included in our analysis. Nodal degree and strength have previously been found to be abnormal in patients with Alzheimer’s disease, indicating a lower number of detectable fibers passing through a pair of ROIs [6,7].
We also assessed thecharacteristic path length–a measure of network integration. This is computed as the total number of edges that need to be traversed to travel from one node to the other:L¼1
network. Presumably, shorter path lengths may be advantageous for more efficient information transfer, along with high levels of clustering [13]. This leads us to the next measures – efficiency, computed as the inverse of the average path length: F¼
P
Another frequently computed network measure is modularity– a statistical eval-uation of the degree to which the network may be subdivided to separate groups of nodes, Q¼P
u2M Fuu Pv2MFuv
2
; here, M is a non-overlapping module that
Table 1. Demographic information from ADNI including age, cognitive decline scores (MMSE, ADAS-Cog, CDR-SOB) and sex. Here, AD stands for Alzheimer’s disease.
Controls SMC eMCI lMCI AD Total
N 52 29 79 40 47 247
the network is subdivided into, andFuvis the proportion of links that connects nodes in moduleu to nodes in modulesv[14].
Less frequently computed measures that we included are the networkflow coeffi -cient, defined as the number of edges of length 2 that link neighbors of a central node that pass through the node, divided by the total number of all possible edges [15]. Moreover, networkdensityis defined as the ratio of detected connections to all possible connections [13]. Finally,edge betweennessis the fraction of all shortest edges in the network that contain a given edge [16].
Spectral graph theory: We computed our spectral features based on four Laplacians, which correspond to different transformations of the connectivity matrices. Our earlier work [17] found that different random walks on networks can offer different and complementary views of their structure. Here, we used four random walk Laplacians to capture informative structural features. The first is (1) the standard normalized Laplacian, which corresponds to the unbiased random walk with uniform time delays. It is defined as LNormð Þ ¼G ðD Gð Þ A Gð ÞÞD Gð Þ
1
), where A(G) is the adjacency matrix andD Gð Þ 1is a delay factor inversely proportional to nodal degree. The second one is (2) the standard un-normalized LaplacianLU Normð Þ ¼G ðD Gð Þ A Gð ÞÞ, where
DðGÞis the diagonal degree matrix. Furthermore, to capture the internal structure of each ROI, we assume that the random walk is delayed at each node. The delay was set to be proportional to each node’s (3) gray matter volume, leading to the scaled Laplacian LVð Þ ¼G ðD Gð Þ A Gð ÞÞD Gð Þ 1T Gð Þ 1 where T(G)is the diagonal delay
matrix and Tuu¼c0 Vgraymatteru. We also computed this using (4) gray matter thickness as the delay factor. The constantc0is chosen such that the trace ofLV is equal
to that ofLNorm, so their spectra are properly normalized and comparable.
For the spectral features of each Laplacian, we calculated their top 12 eigenvalues as well as the total generalized volume. The number 12 is based on the community structure observed in each participant’s network to reveal global organizational prop-erties. In addition, we also used two spectral features based on the top 12 eigenvalues which may be useful for understanding network topology. One of them counts the number of 0 eigenvalues, and this indicates the number of disconnected components (ROIs) in the graph; the second is the sum of the eigenvalues describing the over-all strength of community structures. Overover-all, these spectral graph theory measures describe levels of white matter connectedness between cortical areas of the brain.
2.6 Correlation Explanation (CorEx) for High-Dimensional Data
The newly developed method, CorEx, was used to identify the hierarchical structure in >700 widely used metrics extracted from DWIs and anatomical images, including the measures we have described already. CorEx goes beyond the study of pairwise, linear correlations by providing a principled information-theoretic method to decompose multivariate dependencies in high-dimensional data (http://www.github.com/ gregversteeg/CorEx).
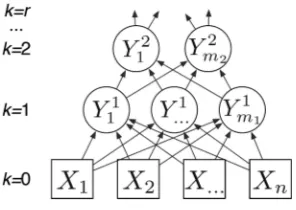
Let X¼ ðX1;. . .XnÞ denote random variables in an arbitrary domain (Fig.1). These could represent different experimental modalities or heterogeneous data types.
We assume that an observation is drawn from some unknown joint distribution pxðX¼xÞ, abbreviated px. We measure the relationships among the variables by a
multivariate mutual information measure historically called “total correlation” (TC), although in modern terms it would be better described as measure of total dependence. TC is defined as:
TC Xð Þ ¼DKL p xð Þjj
Y
ip xð Þi
¼X
iH Xð Þi HðXÞ
Here,Hdenotes the Shannon entropy andDKLis the Kullback-Leibler divergence.
This quantity can be interpreted as the distance between the true data distribution and the expected distribution if all the variables were independent. This distance is zero if and only if the observed variables actually are independent. The total correlation among a group of variables,X, after conditioning on some other variable,Y, can be defined in terms of standard conditional entropies as TC Xð jYÞ ¼P
i
H Xð ijYÞ
H Xð jYÞ: We can measure the extent to which Y “explains”the correlations in X by looking at how much the total correlation is reduced after conditioning onY:
TC Xð ;YÞ ¼TC Xð Þ TC Xð jYÞ ¼XiI Xð i;YÞ IðX;YÞ
Here,TCðXjYÞis zero andTCðX;YÞmaximized if and only if the distribution ofX’s conditioned onY factorizes. This is the case if Y includes information about all the common causes of theXi’s (in which case we say thatYexplains all the correlations inX).
The principle behind CorEx is to search for latent factors,Y1;. . .;Ym, that maxi-mizeTCðX;YÞ: max8j;pðyjjxÞTCðX;YÞ. This optimization searches over all functions of xfor themrepresentatives (shown as circular nodes in the middle row of Fig.1) that are most informative about the data. Directly optimizing this objective is intractable for largem, so we optimize a lower boundTCLðX;YÞwith two useful properties. First, we
are able to optimize this lower bound efficiently (linear in the number of variables). Second, if we construct a hierarchy of representations in whichY1explains correlations
inX, andY2 explains correlations inY1, etc., then to bound the information inX, we
Fig. 1. The bottom row of variables (Xi’s) represents measured quantities. Variables in higher
just add the contribution from each layer: TCðXÞ TCLðX;Y1Þ þTCLðY1;Y2Þ þ .
For a more detailed discussion of bounds and optimization procedure, please refer to [3,4].
The concrete result of this optimization is that each factor, Yi, is some learned function of the inputs that depends on some subset of the input variables. This dependence structure can be used to visualize hierarchical clusters. Also, since eachYi
is a (nonlinear) function of the inputs, we can check whether this new factor has any predictive value.
2.7 Significance of Each CorEx Variable for Predicting Cognitive Decline Because latent factors learned by CorEx are optimized to capture common information among several variables, these factors are robust to noise in the observations. To determine if any of these factors were also predictive of cognitive decline (as measured by MMSE, ADAS-Cog and CDR-SOB scores separately), we ran a random effects regression in all 247 participants across the probabilities associated with each latent factor; we co-varied for age, sex, brain volume and diagnostic group and used scanning site as a random effects variable. We corrected for multiple comparison testing using the False Discovery Rate (FDR) (q< 0.05).
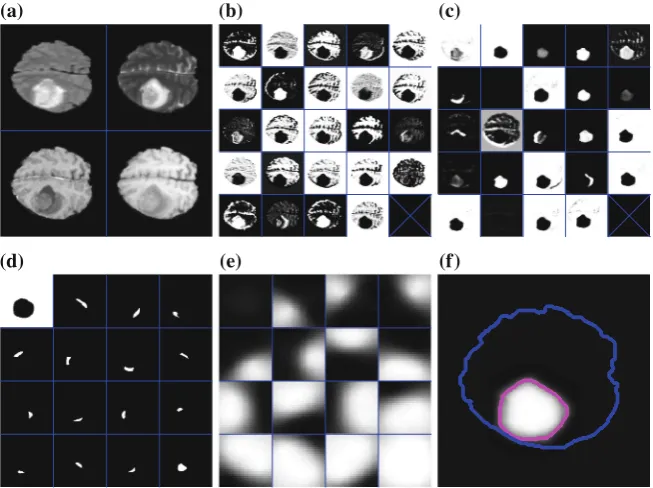
3 Results
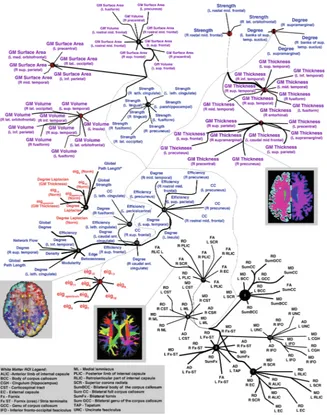
Figure2 shows a tree graph for the hierarchical structure of the top 100 latent factors for the neuroimaging derived measures in predicting cognitive decline. Measures are labeled with text, color-coded based on the measurement type, as indicated in the key. Other nodes in the graph represent latent factors discovered by CorEx, with factors at the first level of the hierarchy (k= 1 in Fig. 1) labeled with numbers 0…19. Links reflect learned functional relationships between variables and the thickness of an edge reflects the mutual information. The size of a latent factor node is based on the amount of multivariate mutual information among its children nodes. As expected, CorEx grouped measures within each category (gray matter, graph theory, spectral graph theory and white matter ROIs) more closely together and found strong correlations among them (thicker edge width indicates stronger correlation). Within each group of variables, latent factors 6, 7, 9, 14, 16 and 18 were associated with decline in MMSE scores (FDR criticalP= 0.014); latent factors 6, 7, 9, 11, 14, 16 and 18 were associated with decline in ADAS-Cog scores (FDR critical P = 9.0×10⁻³) and finally, latent
factors 7, 9, 11, 14 and 18 were associated with decline in CDR-SOB scores (FDR criticalP= 7.1 ×10⁻³).
Gray matter thickness measures (latent factor groups 7 and 14) were the best predictors of cognitive decline (most significant/smallest observedp-values) across all imaging derived metrics. These most predictive and highly correlated measures were among areas known to be prevalent to Alzheimer’s disease, such as the bilateral precuneus, entorhinal, inferior parietal and temporal lobes. The next most predictive measures of cognitive decline were gray matter volume (latent factor group 9),
followed by graph theory nodal measures strength and nodal degree (latent factor groups 18 and 11). A set of eigenvalues from spectral graph theory, computed on the binary Laplacian matrices, were next most indicative of cognitive decline (latent factor group 16); these measures are sensitive to detecting network interconnectedness alterations in the connectome. Finally, gray matter surface area measures were least predictive of cognitive decline (latent factor group 6).
The group of white matter ROIs, described as functions of standard DTI metrics FA, MD, RD and AD, formed biologically meaningful patterns as discovered by CorEx. However, these measures were not significantly associated with cognitive decline.
4 Discussion
In this work, we show how a novel information-theoretic machine learning technique, CorEx, can reveal relationships among a diverse set of diffusion and anatomical derived measures from neuroimaging data. Measures of gray matter thickness were best pre-dictors of cognitive decline, followed by gray matter volume, graph theory measures (strength and degree), spectral graph theory metrics andfinally, gray matter surface area. We found that each structure discovered by CorEx is biologically meaningful and corresponds to anatomical and functional subdivisions in the brain, while the strongest correlations, also associated with cognitive decline, were among regions of the brain know to be prevalent to disease [6,7,18].
The hierarchical representation in Fig.2reveals several key observations about the data structure. First, as expected– the unsupervised algorithm identified highly cor-related clusters among variables of the same type. Second, it determined that all neuroimaging-derived measures were correlated, although to a lesser extent than seen for the within group correlations. For instance, measures of gray matter thickness were clustered together with brain connectivity measures of strength and nodal degree. This might indicate that cortical thickness and white matter connectivity metrics contain shared information on the cognitive decline seen in Alzheimer’s disease patients. Furthermore, spectral graph theory measures, also known as algebraic graph theory measures, were clustered with graph theory measures. This is expected as both groups of measures were computed using weighted or binary forms of the connectivity matrices. Spectral graph theory measures are less frequently applied in the context of disease, however, they were recently used to study connectivity patterns in Alzheimer’s disease [1,2] and found to be indicative of white matter breakdown in patients.
The relationship between cortical atrophy and white matter connectivity breakdown is not well understood, yet it is critically important. Methods like CorEx, designed to identify groups of measures with high multivariate mutual information, might take us a
Fig. 2. Graph of latent factors for neuroimaging measures constructed by CorEx. Colors denote variable types (purple= gray matter (GM) thickness, volume and surface area; blue= graph theory measures;red= spectral graph theory measures; black= white matter ROI measures). Numbers in red mark latent factors that were significantly associated with cognitive decline;eig=
eigenvalue; Norm =normalized; CC=clustering coefficient; L =left hemisphere; R= right hemisphere.(Colorfigure online)
few steps further in discovering the most descriptive metrics of neurodegenerative breakdown in the aging and diseased human brain.
Acknowledgments. Algorithm development and image analysis for this study was funded, in part, by grants to PT from the NIBIB (R01 EB008281, R01 EB008432) and by the NIA, NIBIB, NIMH, the National Library of Medicine, and the National Center for Research Resources (AG016570, AG040060, EB01651, MH097268, LM05639, RR019771 to PT). Data collection and sharing for this project was funded by ADNI (NIH Grant U01 AG024904). ADNI is funded by the National Institute on Aging, the National Institute of Biomedical Imaging and Bioengineering, and through contributions from the following: Abbott; Alzheimer’s Association;
Alzheimer’s Drug Discovery Foundation; Amorfix Life Sciences Ltd.; AstraZeneca; Bayer
HealthCare; BioClinica, Inc.; Biogen Idec Inc.; Bristol-Myers Squibb Company; Eisai Inc.; Elan Pharmaceuticals Inc.; Eli Lilly and Company; F. Hoffmann-La Roche Ltd and its affiliated company Genentech, Inc.; GE Healthcare; Innogenetics, N.V.; IXICO Ltd.; Janssen Alzheimer Immunotherapy Research & Development, LLC.; Johnson & Johnson Pharmaceutical Research & Development LLC.; Medpace, Inc.; Merck & Co., Inc.; Meso Scale Diagnostics, LLC.; Novartis Pharmaceuticals Corporation; Pfizer Inc.; Servier; Synarc Inc.; and Takeda Pharma-ceutical Company. The Canadian Institutes of Health Research is providing funds to support ADNI clinical sites in Canada. Private sector contributions are facilitated by the Foundation for the National Institutes of Health. The grantee organization is the Northern California Institute for Research and Education, and the study is coordinated by the Alzheimer’s Disease Cooperative
Study at the University of California, San Diego. ADNI data are disseminated by the Laboratory for Neuro Imaging at the University of Southern California. This research was also supported by NIH grants P30 AG010129 and K01 AG030514 from the National Institute of General Medical Sciences; and by a Consortium grant (U54 EB020403) from the NIH Institutes contributing to the Big Data to Knowledge (BD2 K) Initiative, including the NIBIB and NCI.
References
1. Daianu, M., Jahanshad, N., Nir, T.M., Leonardo, C.D., Clifford, J.R.J., Weiner, M.W., Bernstein, M.A., Thompson, P.M.: Algebraic connectivity of brain networks shows patterns of segregation leading to reduced network robustness in Alzheimer’s disease. In: O’Donnell, L.,
Nedjati-Gilani, G., Rathi, Y., Reisert, M., Schneider, T. (eds.) Medical Image Computing and Computer Assisted Intervention (MICCAI), Computational Diffusion MRI, pp. 55–64.
Springer, Switzerland (2014)
2. Daianu, M., Mezher, A., Jahanshad, N., Hibar, D.P., Nir, T.M., Jack, C.R., Weiner, M.W., Bernstein, M.A., Thompson, P.M.: Spectral graph theory and graph energy metrics show evidence for the Alzheimer’s disease disconnection syndrome in APOE-4 gene carriers. In:
IEEE International Symposium of Biomedical Imaging (ISBI), pp. 458–461 (2015)
3. Ver Steeg, G., Galstyan, A.: Maximally informative hierarchical representations of high-dimensional data. In: Artificial Intelligence and Statistics Conference (2014) 4. Ver Steeg, G., Galstyan, A.: Discovering structure in high-dimensional data through
5. Madsen, S.K., Ver Steeg, G., Daianu, M., Mezher, A., Jahanshad, N., Nir, T.M., Hua, X., Gutman, B.A., Galstyan, A., Thompson, P.M.: Relative value of diverse brain MRI and blood-based biomarkers for predicting cognitive decline in the elderly. In: The International Society for Optics and Photonics (SPIE), Medical Imaging 2016: Image Processing (2015, in Press)
6. Daianu, M., Jahanshad, N., Nir, T.M., Jack Jr., C.R., Weiner, M.W., Bernstein, M.A., Thompson, P.M., Alzheimer’s Disease Neuroimaging, I.: Rich club analysis in the
Alzheimer’s disease connectome reveals a relatively undisturbed structural core network.
Hum. Brain Mapp.36, 3087–3103 (2015)
7. Daianu, M., Jahanshad, N., Nir, T.M., Toga, A.W., Jack Jr., C.R., Weine, M.W., Thompson, P.M., Alzheimer’s Disease Neuroimaging, I.: Breakdown of brain connectivity between
normal aging and Alzheimer’s disease: a structural k-core network analysis. Brain
Connectivity3, 407–422 (2013)
8. Daianu, M., Dennis, E.L., Jahanshad, N., Nir, T.M., Toga, A.W., Jack, C.R., Weiner, M.W., Thompson, P.M.: Alzheimer’s disease disrupts rich club organization in brain connectivity
networks. In: IEEE International Symposium of Biomedical Imaging (ISBI), pp. 266–269
(2013)
9. Mori, S., Oishi, K., Jiang, H., Jiang, L., Li, X., Akhter, K., Hua, K., Faria, A.V., Mahmood, A., Woods, R., Toga, A.W., Pike, G.B., Neto, P.R., Evans, A., Zhang, J., Huang, H., Miller, M.I., van Zijl, P., Mazziotta, J.: Stereotaxic white matter atlas based on diffusion tensor imaging in an ICBM template. NeuroImage40, 570–582 (2008)
10. Leow, A., Huang, S.-C., Geng, A., Becker, J., Davis, S., Toga, A.W., Thompson, P.: Inverse consistent mapping in 3D deformable image registration: its construction and statistical properties. In: Christensen, G.E., Sonka, M. (eds.) IPMI 2005. LNCS, vol. 3565, pp. 493–
503. Springer, Heidelberg (2005)
11. Fischl, B.: Automatically parcellating the human cerebral cortex. Cereb. Cortex14, 11–22
(2004)
12. Desikan, R.S., Segonne, F., Fischl, B., Quinn, B.T., Dickerson, B.C., Blacker, D., Buckner, R.L., Dale, A.M., Maguire, R.P., Hyman, B.T., Albert, M.S., Killiany, R.J.: An automated labeling system for subdividing the human cerebral cortex on MRI scans into gyral based regions of interest. NeuroImage31, 968–980 (2006)
13. Sporns, O.: The human connectome: a complex network. Ann. N. Y. Acad. Sci.1224, 109–
125 (2011)
14. Rubinov, M., Sporns, O.: Complex network measures of brain connectivity: uses and interpretations. NeuroImage52, 1059–1069 (2010)
15. Honey, C.J., Kotter, R., Breakspear, M., Sporns, O.: Network structure of cerebral cortex shapes functional connectivity on multiple time scales. Proc. Natl. Acad. Sci. U.S.A.104, 10240–10245 (2007)
16. Brandes, U.: A faster algorithm for betweenness centrality. J. Math. Sociol.25, 163–177
(2001)
17. Ghosh, R., Lerman, K., Teng, S.H., Yan, X.: The interplay between dynamics and networks: centrality, communities, and cheeger inequality. Soc. Inf. Netw. (2014)
18. Roussotte, F.F., Daianu, M., Jahanshad, N., Leonardo, C.D., Thompson, P.M.: Neuroimaging and genetic risk for Alzheimer’s disease and addiction-related degenerative brain disorders. Brain Imaging Behav.8, 217–233 (2014)
for Alzheimer’s Disease Diagnosis
Mingxia Liu1,2, Daoqiang Zhang2, Ehsan Adeli-Mosabbeb1,
and Dinggang Shen1(B)
1 Department of Radiology and BRIC, University of North Carolina at Chapel Hill,
Chapel Hill, NC 27599, USA
2 School of Computer Science and Technology,
Nanjing University of Aeronautics and Astronautics, Nanjing 210016, China
Abstract. Multi-atlas based methods using magnetic resonance imag-ing (MRI) have been recently proposed for automatic diagnosis of Alzheimer’s disease (AD) and its prodromal stage, i.e., mild cognitive impairment (MCI). However, most existing multi-atlas based methods simply average or concatenate features generated from multiple atlases, which ignores the important underlying structure information of atlas data. In this paper, we propose a novel relationship induced multi-atlas learning (RIML) method for AD/MCI classification. Specifically, we first register each brain image onto multiple selected atlases separately, through which multiple sets of feature representations can be extracted. To exploit the structure information of data, we develop a relationship induced sparse feature selection method, by employing two regulariza-tion terms to model the relaregulariza-tionships among atlases and among subjects. Finally, we learn a classifier based on selected features in each atlas space, followed by an ensemble classification strategy to combine multiple classi-fiers for making a final decision. Experimental results on the Alzheimer’s Disease Neuroimaging Initiative (ADNI) database demonstrate that our method achieves significant performance improvement for AD/MCI clas-sification, compared with several state-of-the-art methods.
1
Introduction
Brain morphometric pattern analysis using magnetic resonance imaging (MRI) is one of the most popular approaches for automatic diagnosis of Alzheimer’s disease (AD) and its early stage, i.e., mild cognitive impairment (MCI). In these methods, all subjects are spatially normalized onto a common space (i.e., a pre-defined atlas), through which the same brain region across different subjects can be compared [1]. However, due to the potential bias associated with the use of a specific atlas, feature representations extracted from a single atlas may not be sufficient to reveal the underlying complicated differences between populations of disease-affected patients and normal controls (NC).
Recently, several studies [2–4] have shown that multi-atlas based methods usually achieve more accurate diagnosis results than single-atlas based ones.
c
Springer International Publishing Switzerland 2016
Relationship Induced Multi-atlas Learning for Alzheimer’s Disease Diagnosis 25
In multi-atlas based methods, one brain image is non-linearly registered onto multiple atlases, and thus multiple feature representations can be generated for this image. Using multiple atlases could reduce errors due to misregistration, which is helpful for improving subsequent learning performance. However, most of existing multi-atlas based methods simply average or concatenate multiple sets of features generated from multiple atlases, which do not take advantage of the underlying structure information [5,6] of multi-atlas data. In fact, there exists some important structure information, e.g., the relationships among atlases and among subjects. Intuitively, modeling such relationships can bring more prior information into the learning process, which can further boost the learning per-formance. However, to the best of our knowledge, previous multi-atlas based methods seldome utilize such relationship information in their models.
In this paper, we propose a relationship induced multi-atlas learning (RIML) method for AD/MCI classification. We first non-linearly register each brain image onto multiple selected atlases, and then extract multiple sets of feature representations for each subject from those atlas spaces. Next, we develop a novel relationship induced sparse feature selection model, by considering the relation-ships among multiple atlases and among different subjects. Finally, we develop an ensemble classification method to better make use of feature representations generated from multiple atlases. Experimental results on the ADNI database demonstrate the efficacy of our method.
2
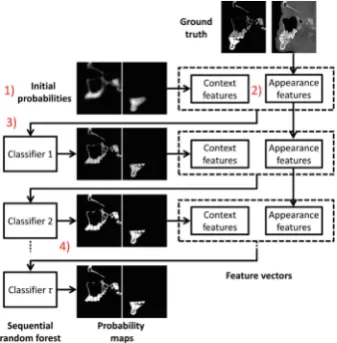
Proposed Method
Figure1 illustrates the overview of our proposed method, which includes three major steps: (1) feature extraction, (2) relationship induced sparse feature selec-tion, and (3) ensemble classification. In the first step, brain images are non-linearly registered onto multiple selected atlases separately, and then multiple sets of volumetric features are extracted for each subject in each atlas space. Afterwards, our proposed relationship induced sparse feature selection method is used to select the most discriminative features by considering the underlying structure information in multi-atlas data. Finally, multiple SVM classifiers are constructed based on multiple sets of selected features, followed by an ensemble classification strategy to combine the outputs of multiple classifiers.
2.1 Feature Extraction
Fig. 1.The overview of our proposed RIML method.
in our feature set, because GM is mostly affected by AD and is widely used in the literature [3,10]. Finally, all brain images are affine-aligned by FLIRT [11].
To obtain multiple atlases, we adopt the affinity propagation (AP) clustering algorithm [12] to partition the whole population of AD and NC images intoK
Relationship Induced Multi-atlas Learning for Alzheimer’s Disease Diagnosis 27
region. Such voxel selection process is important in helping eliminate irrelevant and noisy features, confirmed by several previous studies [4,15,17]. Finally, the top 1500 most discriminative ROI features are selected in each atlas space in this study. By using K atlases, one subject is represented byK sets of feature vectors, where each feature vector is of 1500 dimensions.
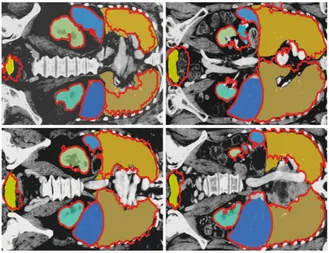
Fig. 2.Selected atlases achieved by the AP clustering algorithm.
2.2 Relationship Induced Sparse Feature Selection
Since multiple atlases are used in this study, feature representations for each sub-ject are high-dimensional, while the number of subsub-jects is usually very limited. In such a case, features could be noisy or redundant, which could degrate the performances of subsequent classifiers [5,18–20]. To this end, we propose a rela-tionship induced sparse feature selection algorithm to find the most informative features in multi-atlas data. Assume we have K learning tasks (corresponding to K atlases). DenoteXk = [xk
1,xk2,· · ·,xkn,· · ·,xkN]⊤ ∈RN×D as the training data for the kth learning task with N training subjects, where xkn represents the column feature vector for the nth training subject in the kth atlas space. Let y = [y1, y2,· · · , yn,· · · , yN]⊤ ∈ RN represent the column response vector for the training data, whereyn ∈ {−1,1} is the class label for the nth subject. Denote W = [w1,w2,· · ·,wk,· · · ,wK] ∈ RD×K as the weight matrix for K
tasks, wherewk∈RD is a column weight vector for thekth task, andw
d∈RK that will be used below as the dth row of W. To encourage the sparsity ofW,
and to select the most informative features in each atlas space, we propose the following multi-task sparse feature learning model:
min W
K
k=1
y−Xkwk2+λ1W1,1 (1)
where the first term is the empirical loss on the training data, and W1,1 =
D
d=1|wd| is the sum ofℓ1-norm of the rows ofW to ensure that only a small subset of features will be selected in each task.
Fig. 3.Illustration of the relationship between two atlases (left panel), and the rela-tionship between two subjects in the same atlas space (right panel).
xk2
n in thek2th atlas space, respectively. After being mapped to the label space,
they should be close to each other (i.e., f(xk1
n ) should be similar to f(xkn2)), since they represent the same subject. Similarly, as shown in the right panel of Fig.3, if two subjectsxkn1 andx
k
n2 in the k
th atlas space are very similar, their
estimated label information should be also similar, i.e., the distance between
f(xk
n1) andf(x k
n2) should be small. To achieve these goals, we first introduce a novel atlas-relationship induced regularization termP as follows:
P = represents thenthsubject with multiple sets of features generated fromK atlas spaces, and Ln ∈ RK×K is a diagonal matrix with diagonal elements equal to K−1 and all the other elements as −1. By using (2), we can model the relationships among multiple atlases explicitly.
We then also propose a subject-relationship induced regularizerQas follows:
Q=
where Xk denotes the data matrix in the kth learning task, and Sk
n1n2 repre-sents the similarity between thenth1 subject and thenth2 subject in thekth atlas
space. Here,Sk
n2are neighbors, and 0 otherwise. Therefore,Sk={Sk
n1n2} N
n1,n2=1∈R
Relationship Induced Multi-atlas Learning for Alzheimer’s Disease Diagnosis 29
By incorporating two relationship induced regularization terms defined in (2) and (3) into (1), our proposed relationship induced sparse feature selection model can be finally formulated as follows:
min
whereλ1,λ2 andλ3 are positive constants to balance the relative contributions of those four terms in (4), and their values can be determined via inner cross-validation on training data. In (4), the second term is used to find the most discriminative features, and the last two terms are to capture the relationships among atlases and among subjects. Since the objective function in (4) is convex but non-smooth because of the non-smooth term l1,1-norm, we adopt a smooth
approximation algorithm [21] to solve the proposed problem.
2.3 Ensemble Classification
To better make use of feature representations generated from multiple atlases, we further propose using an ensemble classification approach. Particularly, after feature selection using our relationship induced sparse feature selection algorithm, we obtain K feature subsets from theK different atlases. Based on these selected features, we then construct K SVM classifiers separately, with each classifier corresponding to a specific atlas space. Next, we adopt the major-ity voting strategy, which is a simple and effective classifier fusion method, to combine the outputs of K SVM classifiers for making a final decision. In this way, the class label of a new test subject can be determined by majority voting for the outputs of thoseK classifiers.
3
Experiments
3.1 Subjects and Experimental Settings
by using a specific feature selection algorithm, and then constructK SVM classi-fiers, followed by an ensemble classification process (see Fig.1).
In the experiments, we use a 10-fold cross-validation strategy to evaluate the performance of different methods, and record the average results among those 10 folds. The regularization parameters in (4) and that for LASSO are chosen from {10−10,10−9,· · ·,100}, and the p-value in t-test method is chosen from
{0.05,0.08,0.10,0.12,0.15} via inner cross-validation on the training data. We use the linear SVM with default parameters as classifier, and evaluate the per-formance of different methods via four criteria, including classification accuracy (ACC), sensitivity (SEN), specificity (SPE), and the area under the receiver operating characteristic curve (AUC).
3.2 Results and Analysis
First, we report the results achieved by four single-atlas based methods and nine multi-atlas based methods in Table1. For the single-atlas based methods, the averaged results using K individual atlases are provided. From Table1, we can observe three main points: First, multi-atlas based methods generally achieve better performances than single-atlas based methods (i.e., PC sa, COM-PARE sa, t-test sa, and LASSO sa). For instance, in AD vs. NC classifica-tion, the best accuracy achieved by single-atlas based methods is only 84.32 % (by LASSO sa), which is usually lower than those of multi-atlas based methods. Second, when using multiple atlases, our proposed ensemble strategy (i.e., PC en, COMPARE ens, t-test ens, and LASSO ens) usually outperforms their coun-terparts using feature concatenation strategy (i.e., PC con, COMPARE con,
t-test con, and LASSO con). Third, in most cases, our RIML method achieves better results than the compared methods. Also, our method
Then, we compare the results achieved by RIML with several state-of-the-art multi-atlas based methods using MRI data from ADNI, with results shown in Table2. From Table2, it is obvious that our RIML method generally outperforms the other three methods in both AD vs. NC classification and pMCI vs. sMCI
Table 1.Comparison of RIML with different methods in two classification tasks.
Method AD vs. NC pMCI vs. sMCI
ACC (%) SEN (%) SPE (%) AUC (%) ACC (%) SEN (%) SPE (%) AUC (%) Single-atlas PC sa 84.00 79.53 87.45 76.92 68.49 67.80 69.10 62.85
COMPARE sa 84.18 75.33 89.17 78.70 70.06 68.08 72.02 63.56
t-test sa 76.27 68.50 83.01 74.96 61.99 64.93 73.11 65.16 LASSO sa 84.32 81.66 86.36 84.02 72.06 72.04 72.02 72.03 PC con 84.01 81.56 89.23 81.91 72.78 74.62 70.91 72.45 COMPARE con 84.93 80.11 87.03 79.07 73.35 75.76 70.83 74.05
t-test con 81.87 70.77 90.71 81.78 61.60 64.32 75.01 71.63 LASSO con 86.62 84.78 89.80 87.29 71.49 76.06 66.67 71.36 Multi-atlas PC ens 85.59 82.44 89.93 91.51 73.92 73.38 72.32 76.29 COMPARE ens 86.61 85.44 89.23 90.85 75.56 75.75 73.48 76.58

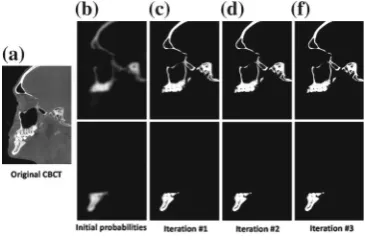
![Fig. 5. 3D surfaces obtained by different methods: (a) majority voting (MV), (b) patch-basedsparse representation (SR) [2], (c) sequential random forest without prior [16], (d) the proposedsequential random forest with prior, and (e) ground truth.](https://thumb-ap.123doks.com/thumbv2/123dok/3858508.1841798/85.439.162.293.60.134/surfaces-obtained-different-majority-basedsparse-representation-sequential-proposedsequential.webp)
