1 23
!
"#$##%#&##!
1 23
O R I G I N A L A R T I C L E
How metabolomics can contribute to bio-processes: a proof
of concept study for biomarkers discovery in the context
of nitrogen-starved microalgae grown in photobioreactors
Fre´de´rique Courant•Arnaud Martzolff•Graziella Rabin •Jean-Philippe Antignac• Bruno Le Bizec•Patrick Giraudeau•Illa Tea•Serge Akoka• Aure´lie Couzinet• Guillaume Cogne•Dominique Grizeau• Olivier Gonc¸alves
Received: 20 December 2012 / Accepted: 8 April 2013
!Springer Science+Business Media New York 2013
Abstract Microalgae appear to be one of the most promising sustainable resources as alternative crops for the production of renewable transport fuel. The exploitation of this bioresource requires, however, a fine monitoring of the culture conditions, for example by using more relevant control variables than usual macroscopic indicators (bio-mass or pigment estimation). In this proof of concept study, we propose to search potential biomarkers of progressive nitrogen regime culture conditions using an untargeted metabolomic approach based on LC-HRMS combined to a non-invasive analysis based on FTIR spectroscopy. One
microalgae model was investigated i.e. Chlamydomonas
reinhardtii to characterize the effect of progressive
nitrogen regime in batch culture conditions on its metab-olome. FTIR allowed assessing the intracellular macro-metabolic perturbations, highlighting the over-accumulation of carbohydrates. LC-HRMS complemented the macro-molecular information by revealing the dependence of microalgae metabotypes on nitrogen regime conditions tested for cells culture. Patterns of significantly modulated metabolites were also detected during those slight con-trasted nitrogen regimes and interesting features were structurally elucidated. This included metabolites belong-ing to the pantothenate, branched chain and aromatic amino acids pathways. In the last step of this proof of concept study, amino acid targets proposed by metabolo-mic investigations were assessed on nitrogen-limited con-tinuous culture on photobioreactors. This was performed to test the validity of proposed targets in real small-scale
industrial production conditions. Results were very
encouraging and suggested the possibility of using poten-tially relevant metabolites as intracellular biomarkers only (tryptophan) or as both intra and extracellular biomarkers (e.g. 2-methylbutyric acid and ketoleucine).
Keywords LC-HRMS! FTIR spectroscopy!
Nitrogen progressive regime!Chlamydomonas reinhardtii!
Biofuel!Photobioreactors
Abbreviations
ATR Attenuated total reflectance
BCAAs Branched-chain amino acids
CE Capillary electrophoresis
FTIR Fourier transform infrared spectroscopy
GC Gas chromatography
HC Hierarchical clustering
HPLC High performance liquid chromatography
HTS-XT High throughput screening eXTension
Electronic supplementary material The online version of this article (doi:10.1007/s11306-013-0532-y) contains supplementary material, which is available to authorized users.
F. Courant!J.-P. Antignac!B. Le Bizec
Laboratoire d’E´ tude des Re´sidus et Contaminants dans les Aliments LABERCA, LUNAM Universite´, Oniris, 44307 Nantes, France
A. Martzolff!G. Rabin!G. Cogne!D. Grizeau!
O. Gonc¸alves (&)
LUNAM Universite´, Universite´ de Nantes, CNRS, GEPEA, UMR 6144, Baˆt. CRTT, 37 bd de l’Universite´, BP 406, 44602 Saint-Nazaire Cedex, France
e-mail: [email protected]
P. Giraudeau!I. Tea!S. Akoka
LUNAM Universite´, Universite´ de Nantes, CNRS, Chimie et Interdisciplinarite´ : Synthe`se, Analyse, Mode´lisation CEISAM, UMR 6230, 2 rue de la Houssinie`re, BP 92208, 44322 Nantes Cedex 03, France
A. Couzinet
LC-HRMS Liquid chromatography—high resolution mass spectrometry
MS Mass spectrometry
NMR Nuclear magnetic resonance
PLS-DA Partial least square-discriminant analysis
RSD Relative standard deviation
TAP Tris acetate phosphate
TIC Total ionic current
1 Introduction
Microalgae are often cited as ‘‘green gold mines’’ for generating renewable energy since they literally present almost all the characteristics of the perfect sustainable
alternative crop (Larkum et al.2012; Ratha and Prasanna
2012). However mastering such organisms for the purpose
of industrial biofuel production still represents a tremen-dous challenge with both scientific and industrial
bottle-necks (Lam and Lee 2012). When dealing with biomass
production in closed photobioreactors, the fine monitoring of culture conditions appears to be one of the major problems to be solved, since the accumulation of energetic molecules depends on the operational growth conditions of microalgae and especially on nutrient supplementation
(Gonzalez-Fernandez and Ballesteros 2012; Wang et al.
2012). Indeed mineral starvation—especially nitrogen
regime—is often exploited for the accumulation of lipids or carbohydrates, with culture monitoring solely performed with macroscopic indicators such as biomass evolution or
pigment quantification (Breuer et al.2012).
However those macroscopic indicators cannot reflect all the complexity of the phenotype expressed by algae culti-vated in nitrogen regime conditions, since it results from multilevel interactions including genetic, transcriptomic,
proteomic or metabolic factors (Jamers et al.2009).
Under-standing this complex biological process should ideally be performed by integrating information associated to all those ‘‘omics’’. Dealing with such an approach is however not straightforward since large biases exist when attempts are made to acquire or interpret experimental high-throughput
data (Martinez-Gomez et al. 2012). One strategy could
consist in focusing on the modulation of intracellular small molecules, thus assessing the end-result of this complex biological process. This approach should highlight pertinent biomarkers or patterns of biomarkers characteristic of mic-roalgae cultured under nitrogen regime.
With regards to the metabolome, the monitored signals correspond to chemical substances (metabolites) accessible to the analysis, which are final products formed after the complex transcription, translation, and regulation
mechanisms. Metabolomics enables the differential
assessment of the levels of a broad range of endogenous and exogenous metabolites and has been shown to have a great impact on the investigation of the physiological sta-tus, discovering biomarkers and identifying related
path-ways (Wang et al.2010). From an analytical point of view,
metabolomics deals with the comprehensive analysis of metabolites present in a biological sample by the combined use of a fingerprint technology and multivariate statistical analyses. The most widely used technique for metabolomic purposes remains nuclear magnetic resonance (NMR)
(Nicholson et al. 2002; Nicholson et al.1999).
Non-inva-sive approaches such as vibrational spectroscopy are also exploited, not for metabolome description purpose, but more as rapid and complementary explanatory techniques allowing the biochemical profiling of cultures at a cellular
level (Winder et al. 2011; Wu et al.2011). Fourier
trans-form infra-red (FTIR) spectroscopy demonstrated its ability to highlight reproducible biochemical differences when comparing the effect of various treatments, and even to estimate the in vivo content of modulated molecules without cellular preparation or metabolite extraction
(Alvarez-Ordonez et al.2011; Goff et al.2009). However,
despite its advantages, FTIR lacks ability in characterizing hydrosoluble compounds. Mass spectrometry (MS)-based methods, on the other hand, have recently proved to be valuable for metabolomic studies, especially thanks to recent technological advances. Furthermore, they present some incomparable advantages over NMR and IR in terms
of sensitivity (Antignac et al. 2011; Theodoridis et al.
2008).
In the present study, both FTIR and MS were exploited. The first one was used with the objective to obtain a fast and simple method for evaluating and monitoring culture conditions by providing information on the macromolecu-lar content of cells. The second one, which is more sensi-tive and has powerful resolution, was exploited to provide detailed information on metabolites. The objective of our proof-of-concept study is to evaluate the potential of the metabolomic approach to assess modulated metabolite signatures characteristic of microalgae cells cultivated under limited nitrogen culture conditions. Candidate bio-markers or patterns of biobio-markers should be in the near future exploited as control indicators for the fine monitor-ing of photobioreactors utilized to grow microalgae under nitrogen regime. The choice of culture conditions pro-gressively limited in nitrogen and not fully depleted was motivated by the final applicative objective of this study. Indeed, for industrial applications continuous cultures are often chosen for high productivity reasons, therefore imposing to perform nutrient limitation in order to work
with living cells (Van Vooren et al.2012). Performing our
would have stopped growing biomass and provided data too far from industrial operational conditions. Results and perspectives emerging from this proof-of-concept study are described and discussed in this manuscript.
2 Materials and methods
2.1 Chemicals and reagents
All chemicals and reagents were obtained from Sigma-Aldrich (Taufkirchen, Germany) in the highest quality available (analytical grade).
2.2 Microalgae culture conditions
2.2.1 Batch cultures
Wild-typeChlamydomonas reinhardtii 137AH cells from
the culture collection of the French Alternative Energies and Atomic Energy Commission (CEA Cadarache, France) were conserved on solid (agar 1,75 %) standard
tris–ace-tate-phosphate (TAP) medium (Gorman and Levine1965)
at 16"C and replicated every month. From the latter, liquid
precultures were performed in flasks containing TAP
medium and nursed at 25"C under constant agitation
of 135 rpm and illumination of approximately
100lmol m-2s-1 in an incubator (New Brunswick
Innova# 44). Precultures were replicated every 4 days to
keep cells in mid-log phase. After five replications and
having reached a cell density of about 4–7.106cells mL-1
(corresponding to a late logarithmic growth state), cells
were harvested by centrifugation (4,5009g, 5 min, 20"C
in a Sorvall#RC-6 Plus centrifuge) and the cell pellet was
resuspended in fresh TAP medium. Resuspended cells were then used to inoculate batch cultures fed with the same fresh medium for reference culture conditions R or with medium progressively depleted with nitrogen i.e.
NH4Cl 0.2 g L
-1
for culture conditions N- and NH4Cl
0.1 g L-1
for culture conditions N–. Standard culture conditions were then applied until a homogenous cell
density of 4–6.106cells mL-1 and a typical observable
phenotype (i.e. pigment discoloration) were observed for
limitation experiments (Wegener et al.2010).
2.2.2 Continuous cultures in photobioreactor
Microalgae cells coming from preculture flask (2.2.1) were
harvested by centrifugation (4,5009g, 5 min, 20"C in a
Sorvall# RC-6 Plus centrifuge) and the cell pellet was
resuspended in fresh medium (Hutner et al. 1950) where
nitrogen is only the growth limiting substrate solely. Resuspended cells were then inoculated in a torus-shaped
photobioreactor operating in chemostat mode. The culture volume was kept constant by feeding the culture with the
same fresh medium using a dosing pump (Stepdos#pump
03/RC, KNF Neuberger) at constant flow rate, and by harvesting the culture using a peristaltic pump
(Master-flex#LS Easy-Load II) at the same flow rate. Steady-state
conditions were achieved by maintaining constant dilution
rate (0.0077, 0.0079 or 0.0104 h-1) and light intensity (200
or 400lmol m-2s-1). pH was kept constant at 7.5±0.1
by CO2 injection using an on–off controlled mass flow
controller (EL-FLOW F-201CV-020-RAD-33-Z,
Bronk-horst#) at a constant flow rate of 3 mL min-1
.
Tempera-ture was kept constant at 25±1"C. Mixing was
performed by a marine impeller under a constant stirring speed (300 rpm). In order to prevent any metabolic shift
toward photorespiratory pathways, nitrogen (N2) as inert
gas allowed to strip oxygen from the culture broth at a
constant flow rate of 10 mL min-1
using a mass flow
controller (EL-FLOW F-201C-RAD-33-V, Bronkhorst#).
A septum on the top of the photobioreactor enabled daily manual sampling for analysis. On-line data acquisition used a data processing system (DAQ 6023E-National
Instruments#) that enabled automated data acquisition and
process control. The software was written with the
Lab-View Virtual Instruments programming techniques
(National Instruments#).
2.3 Microalgae cells sampling for analytical data acquisition
2.3.1 Cell sampling for FTIR analysis
For the acquisition of FTIR spectra, a 1 mL sample of fresh culture was taken from each replicate flask or automatically sampled via the PBR sampling device. Cells were
centri-fuged (4,5009g, 5 min, 20"C in a Mikro R22 centrifuge)
and washed with 2 mL physiological water. The washing centrifugation protocol was repeated three times. Depend-ing on the number of cells per milliliter, pellets were
resuspended in about 100lL of physiological water.
Vol-umes of 1lL (approximately 105–106cells) were
depos-ited on a 384 well silicon microplate and oven-dried for 5 min at 40"C.
Solid microalgal pellet residues or liquid organic extracts coming from solvent extraction test experiments were directly dried for approximately 15 min on the dia-mond crystal of the ATR accessory of the FTIR spec-trometer using an infrared lamp (220 V, 50 Hz, 100 W).
2.3.2 Cell sampling for LC-HRMS analysis
identical to those analyzed with FTIR spectroscopy. It consisted in a fast filtration step coupled to a manual rapid quenching step in liquid nitrogen. Homogeneous
microal-gae samples of 1 mL of fresh culture (106–107cells mL-1)
were deposited on polyamide filters (Sartorius#,
25007-47N, 0.2lm) placed on a vacuum sintered glass
filtration unit. In order to remove extracellular salts, filters were subsequently rinsed with 3 mL of rinsing solution
(NH4Cl 1 g L
quickly quenched in liquid nitrogen (-196 "C) and stored
at-80"C for further analysis (Bolten et al.2007).
2.4 Metabolite extraction of sampled microalgae cells
Hydrosoluble compounds extraction was performed using (hydro)-alcoholic solvent mixtures on sampled microalgae cells. For this proof of concept, two combinations were used solely, 100 % methanol and hot ethanol–water mix
(75–25 v/v) (El Rammouz et al.2010).
Filters resulting from rapid sampling and quenching
methods (Sect.2.3.2) were plunged into methanol. Samples
were vortexed for 3 min, centrifuged (4,5009g, 5 min,
20"C in a Sorvall#RC-6 Plus centrifuge) and the organic
extract was finally removed and filtered on glasswool
(glasswool was systematically heated at 460"C during 6 h
to avoid further contamination). The solvent extraction-centrifugation-filtration operation was repeated until the maximum impoverishment of microalgal cell pellets was monitored with ATR-FTIR analysis. The organic phases were pooled and evaporated under dry analytical nitrogen stream (Nitrogen evaporator—Organomation Associates Inc., USA) before analysis.
For the hot ethanol–water extraction, the filters resulting
from rapid sampling and quenching methods (Sect.2.3.2)
were plunged into 5 mL of boiling mixture (90–95"C).
The tubes were strongly shaked for 3 s and then extracted for 30 s, 1 min, 1 min 30 s and 2 min in a water bath
maintaining the extraction temperature at 90–95"C. The
extraction process was then quenched by plunging tubes for 3 min in ethanol–water (75–25 v/v) maintained at
-80"C. The filter was removed, the tube was centrifuged
(4,5009g, 5 min, 20 "C in a Sorvall# RC-6 Plus
centri-fuge) and the organic extract was filtered on glasswool
(glasswool was systematically heated at 460"C during 6 h
to avoid further contamination). The organic phase was evaporated under dry analytical nitrogen stream (Nitrogen evaporator—Organomation Associates Inc., USA) before analysis.
Twenty microliters of a mixture of internal standards
(triamcinolone and ponasterone A at 1 ng/lL) were added
to each sample to allow the monitoring of the instrument analytical variability during the fingerprinting process.
2.5 Analytics
2.5.1 HTSXT-FTIR spectra
Infrared spectra were recorded in transmission mode directly on a silicon 384 well microplate loaded with dried microalgae samples. The Bruker tensor 27 FTIR spec-trometer equipped with the HTS-XT plate reader module, with a deuterated triglycine sulphate detector RT-DLaTGS and the OpusLab v 7.0.122 software (Bruker Optics, Ger-many) was set up with the following parameters. The
spectral resolution was fixed to 1 cm-1, the number of
scans to 32, the selected spectral range between 4,000 and
400 cm-1
, and the microplate reader pinhole aperture was set up to 3 mm. The diameter of the IR beam was therefore sufficient for the detection of all dried cells within the spot diameter of around 3 mm. Background spectra were col-lected using the same instrument settings as those employed for the samples. Spectra were recorded for five replicates per sample.
2.5.2 ATR-FTIR spectra
Infrared spectra were recorded in reflection mode directly on the diamond crystal of the ATR accessory loaded with dried microalgae or extract samples. The Bruker tensor 27 FTIR spectrometer equipped with the ATR platinum module, with a deuterated triglycine sulphate detector RT-DLaTGS and the OpusLab v 7.0.122 software (Bruker Optics, Germany) was set up with the following
parame-ters. The spectral resolution was fixed to 1 cm-1, the
number of scans to 32, the selected spectral range between
4,000 and 400 cm-1
. Background spectra were collected using the same instrument settings as those employed for the samples and was performed against air. Spectra were recorded for 3 replicates per sample.
2.5.3 LC-HRMS metabolic fingerprints
LC-HRMS experiments were performed on an Agilent 1200 HPLC system including an autosampler and a binary pump coupled to a Finnigan LTQ-OrbitrapTM hybrid mass spectrometer (Thermo Fisher Scientific, Bremen, Ger-many) fitted with an electrospray source operated in the
negative ion mode. 10lL of each sample were injected on
a Hypersil-Gold column (100 mm 92.1 mm91.9lm
operating in negative mode. The electrospray voltage was
set to-4 kV, and the capillary voltage and tube lens offset
were set to-20 and-90 V, respectively. The sheath and
auxiliary gas flows (both nitrogen) were set to 55 and 6 arbitrary units (a.u.), respectively, and the drying gas
temperature was set to 325"C. Mass spectra were recorded
from 65 Th up to 1,000 Th at a resolution of 30,000 (FWHM at m/z 400). Mass spectra were acquired in the centroid mode.
2.6 Data analysis
2.6.1 FTIR spectra preprocessing
The spectra were recorded to the background spectra and
baseline corrected—CO2, H2O, ATR (when needed)—and
smoothed. A second derivative calculation was also per-formed on the corrected spectra. All these treatments were achieved using integrated functions of OpusLab v 7.0.122 software (Bruker Optics, Germany).
2.6.2 Multivariate analysis of FTIR spectra
Preprocessed spectra or preprocessed second derivative spectra were exported as text files for file format modifi-cation on Microsoft Excel v14.0.0 or statistical treatment on R 2.15.2. Second derivative spectra were systematically used to improve the infrared band resolution and thus enhance the discrimination of vibrators contributing to the shape of raw FTIR spectra. Since one vibrator is associated to one molecule family, maximum chemical information should be extracted from second derivative FTIR spectra
(Mecozzi et al. 2011). Spectral data were centered and
reduced to minimize the unit range influence before sta-tistical analysis.
2.6.3 Metabolomic LC-HRMS fingerprint preprocessing
Following their acquisition, metabolomic fingerprints were deconvoluted to allow the conversion of the three-dimensional raw data (m/z, retention time, ion current) to time- and mass-aligned chromatographic peaks with
associated peak areas. Xcalibur#
software (Thermo Fisher Scientific) was used to convert the original Xcalibur data files (*.raw) to a more exchangeable format (*.cdf). Data processing was then performed using the open-source
XCMS software (Smith et al. 2006). XCMS parameters
for the R language were implemented in an automated script. The interval of m/z value for peak picking was set to 0.1, the signal to noise ratio threshold was set to 6, the group bandwidth was set to 15 and the minimum fraction was set to 0.75.
2.6.4 Statistical analysis of LC-HRMS data
A non-parametric analysis of variance, the Kruskal–Wallis test, was performed on all signals [(m/z, rt) features)] generated by the XCMS treatment of the LC-HRMS data to determine if the nitrogen regime was a parameter signifi-cantly affecting the metabolome of microalgae cells. A
non-parametric Mann–WhitneyUtest was then performed
on the structurally identified metabolites which presented a
significant Kruskal–Wallispvalue (p\0.05) to determine
more finely the effect of the progressive nitrogen regime.
The Kruskal–Wallis test and the Mann–Whitney U test
were carried out using Statistica Data Miner v 7.1 (Stat-Soft, Maisons-Alfort, France).
In order to visualize the patterns of (m/z, rt) features
presenting a Kruskal–Wallispvalue lower than 0.05 across
the three nitrogen regimes, a hierarchical cluster analysis (HC) was performed using the web server analysis pipeline Metaboanalyst 2.0, dedicated to metabolomic data
exploi-tation (Xia et al. 2012). A blue/red colored heat map was
then plotted to summarize the data.
A partial least square—discriminant analysis was per-formed on all the signals stemming from the XCMS analysis of the LC-HRMS data. PLS-DA was conducted on
SIMCA-P?# software (version 12, Umetrics Inc., Umea˚,
Sweden). Prior to analysis, data were log10 [1?
x]-transformed and Pareto scaled.
2.7 Metabolite identification
Compounds identification was performed on the basis of an internal data bank created for LC-ESI-LTQ-Orbitrap acquisitions and using ACD/Labs software (Courant et al.
2012).
2.8 Targeted analytical biochemistry
2.8.1 Total carbohydrate and starch concentration determination
The total carbohydrates content was determined by the
phenol–sulphuric acid method (DuBois et al. 1956).
2–10 mL of culture were sampled and centrifuged
(12,0009g, 5 min, 20"C). The cell pellet was resuspended
in de-ionized water so that carbohydrates concentration
was comprised between 0.02 and 0.1 g L-1. 0.5 mL of
phenol (50 g L-1) and 2.5 mL of fuming sulphuric acid
(98 %) were added to 0.5 mL of resuspended culture. After 10 min of incubation, tubes were mixed (vortex, 10 s) and
then incubated in water bath (35"C, 30 min). Sample
Starch determination was performed using a method
slightly modified from that of Klein and Betz (1978). 2 mL
aliquots of cell suspension were sampled and centrifuged
(12,0009g, 5 min, 20"C). The cell pellets were suspended
in 1.5 mL of methanol, incubated (45 min, 44"C) and then
centrifuged again. The pellets were rinsed with 1 mL of sodium acetate buffer (100 mM, pH 4.5), resuspended in 500 mL of sodium acetate buffer, and autoclaved (60 min, 135"C) for starch solubilization. Starch assays were
per-formed with a commercial kit (starch assay kit SA-20, Sigma-Aldrich) based on an enzymatic method following the supplier’s recommendations.
2.8.2 Protein concentration and amino acids profiling
Total proteins content was quantified with the Lowry and
colleagues method (Lowry et al. 1951) using the Folin
phenol reagent.
Amino acids profiling was performed as follows. 1 L of culture was centrifuged (Sorvall centrifuge RC-6 Plus,
5,0009g, 10 min, 4"C). The cell pellet was washed with
de-ionized water and centrifuged again. Then, the cell pellet was freeze-dried (RP2 V Se´rail freeze dryer, 24 h). Amino acids, except tryptophan were quantified using an amino acid analyser. Cysteine and methionine were
oxi-dized at 0"C with a mixture of performic acid and phenol.
Amino acids, except tryptophan, were hydrolyzed for 23 h with hypochlorous acid, pH was adjusted to 2.20. Amino acids were separated using ionic chromatography and quantified after ninhydrin reaction by spectrophotometry (570 nm, except for proline, 440 nm). Tryptophan Tryp-tophan was hydrolyzed with saturated barium hydroxide
solution at 110"C for 20 h. After hydrolysis, the internal
standard was added and samples were quantified by HPLC equipped with a fluorimetric detector.
3 Results and discussion
3.1 First objective of this proof of concept study: estimating the quality of the metabolomic protocol
3.1.1 Qualitatively, the number of detected features increased with the tested solvent polarity
and appeared to be heat shock dependent for the hot water–ethanol mix
The enrichment of hydro-alcoholic extract features was assayed with both FTIR and HRMS techniques. The sec-ond derivative FTIR signatures of organic extracts were qualitatively interpreted hypothesizing that one wave number was characteristic of one chemical family feature
(Mecozzi et al.2011). LC-HRMS profiles were interpreted
assuming that one feature corresponded to one mass-retention time ([m/z; rt]) couple extracted from raw TIC by XCMS software. It appeared that very few detected fea-tures were shared between the tested extracts whatever the technique considered (methanol or hot water–ethanol mix). This suggested the complementarity of the tested extraction
approaches on C. reinhardtiicells (data not shown). The
methanol and hot water–ethanol mix approaches exhibited an increasing number of LC-HRMS detected features with the increasing polarity of the tested solvent. The hot water– ethanol mix presented the highest number of detected features (846 for methanol compared to 1,681 for hydro-alcoholic for a time of contact of 1 min), except when exceeding 1 min of contact time, where a clear decrease was monitored (data not shown).
3.1.2 The repeatability of the extraction protocol was assayed quantitatively for the approach exhibiting the highest number of detected features i.e. the hot water–ethanol mix
The repeatability of the extraction protocol was determined in order to ensure that the monitored metabolite level change was associated to the tested stimulus and not to technical sources. Five replicates of one sample were extracted following the chosen protocol (i.e. hot water– ethanol mix for four contact times) and injected on the LC-HRMS system. As these replicates were identical, the different signals (metabolites) constituting the fingerprints and extracted through the solvent protocol should lead to the same intensity across the replicates, with low
vari-ability (i.e. RSD\40 %). 65 % of the ions constituting
the global fingerprints were found to present relative standard deviations (RSD) lower than 40 % for two contact times, i.e. 30 s and 1 min, and superior to this threshold value starting from 1 min 30 s. Such results allowed con-sidering the hot water–ethanol mix data obtained for 30 s and 1 min contact times as satisfactory since the calculated RSD took into account the variability of the extraction protocol and of the fingerprinting process.
3.1.3 The LC-HRMS fingerprint acquisition appeared to be of good quality and therefore interpretable
detected across the different samples (n =15) were found
acceptable (RSD=29 % for Triamcinolone and
RSD=31 % for Ponasterone A) and suggested a good
quality of the whole fingerprint acquisition.
3.2 Second objective of this proof of concept study: evaluating the effect of the progressive nitrogen
regime onChlamydomonas reinhardtiiobservable
metabolome
3.2.1 The progressive nitrogen regime provoked a carbohydrate accumulation
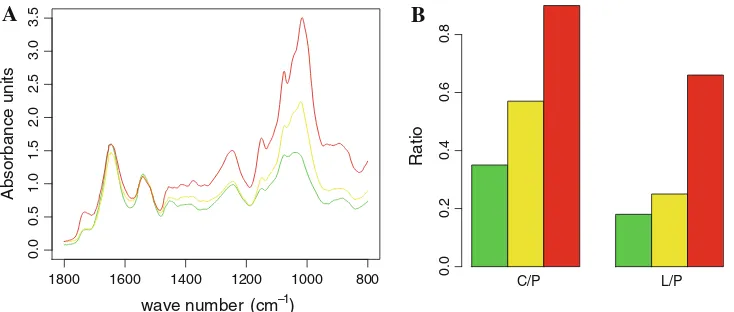
Raw FTIR spectra of fresh cells indicated an immediate effect of such a limitation on the relative abundance of
microalgae carbon storage molecules (Fig.1). A
signifi-cant increase of the relative amount of carbohydrate as a function of the nitrogen limitation was first observed. This finding was then accompanied by an increase of relative lipid content, but in a less marked manner. Such macro-molecular observations were consistent with the data
ini-tially obtained by Ball et al. (1990) and described for
nitrogen limitation (Dean et al. 2010) or deprivation
protocol (James et al. 2011). FTIR observations were
moreover reinforced by Longowrth’s recent results
(Longworth et al. 2012). Indeed, during their nitrogen
starvation protocol, kinetic results also indicated that the accumulation of carbohydrate was systematically followed by an increase of neutral lipids. In order to complement the FTIR macromolecular observations, LC-HRMS met-abolic profiles assessed on similar cell samples were analyzed.
3.2.2 Metabolic fingerprints were nitrogen regime dependent
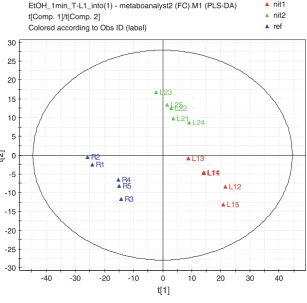
The PLS-DA analysis of LC-HRMS metabolic signatures of nitrogen-deprived microalgae cells suggested a major
effect of the nitrogen regime (Fig.2). Indeed, the score plot
on the first component (accounting for 39.5 % of the initial information) indicated a clear separation of metabolic signatures arising from reference nitrogen cultured cells and those coming from the two tested nitrogen regimes. On the second component (accounting for 16.9 % of initial
information), a clear discrimination was performed
between metabolic signatures obtained with the two kinds of nitrogen regime.
3.2.3 The pattern of regulated features were clearly detected according to the nitrogen regime
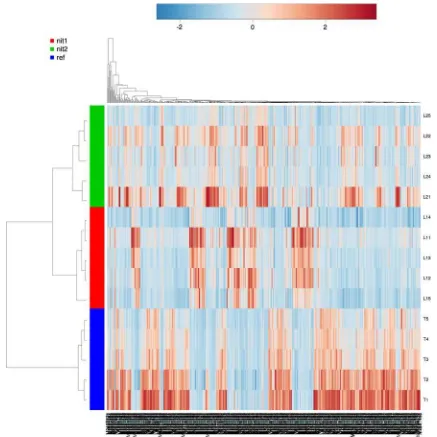
Among the 1,681 [m/z, rt] detected features on the LC-HRMS metabolic fingerprints, 560 presented a Kruskal–
Wallis p value lower than 0.05 across the three nitrogen
regimes, suggesting significant effect of such regime on our observable fraction of the metabolome. Double hierarchical clustering was performed on these data and the results were summarized on a heatmap in order to visualize if metab-olite patterns could be detected according to the nitrogen
regime (Fig.3). Sample clustering results in rows
high-lighted the effect of the nitrogen regime on metabolic signatures since three distinct groups could be established (one group per nitrogen regime). Feature clustering results in columns highlighted several ion patterns presenting different behaviors. Some features were whether up or down regulated when increasing the nitrogen regime
B
1800 1600 1400 1200 1000 800 0.0 C/P L/P
0.2
0.4
0.6
0.8
Ratio
Fig. 1 FTIR spectra of Chlamydomonas reinhardtii entire cells cultured under progressive nitrogen limited conditions. Raw infrared spectra (left panel) illustrated global changes in the macromolecular composition of microalgae when comparing the reference culture conditions R (green) to limitations N- (yellow) and N– (red). The evolution (right panel) of lipid (1,740 cm-1): amide I (1,655 cm-1)
‘‘L/P’’ and carbohydrate (1,150 cm-1
stringency. Others patterns presented intermediate regula-tion schemes where sudden up regularegula-tion was followed by down regulation and inversely.
3.2.4 A biological interpretation was attempted on the identified LC-HRMS features, suggesting interesting potential biomarkers
In order to complete the observed tendencies, features selected using the Kruskal–Wallis test were investigated for annotation and subsequent biological interpretation attempts. Interesting biomarkers were confirmed
experi-mentally (Table1).
(i) Over-accumulation of carbohydrates and lipids could be assessed through a regulation of the branched-chain amino acids (BCAAs) and the pantothenate pathways. Increasing relative amounts of carbohydrate and lipids observed with FTIR were also suggested with LC-HRMS annotated data, highlighting the regulation of metabolites involved in the leucine biodegradation and the
pantothe-nate biosynthesis pathways (Table1). Indeed, leucine and
pantothenic acid were found to be significantly down reg-ulated whatever the nitrogen regime. The regulation of detected metabolites involved in the catabolism of leucine was however not clearly established for both tested
nitrogen regimes in this proof of concept study. This was the case of ketoleucine, found to be down regulated nificantly in the N- regime and 2-methylbutyric acid, sig-nificantly up regulated in the N– regime. For those two metabolites, absence of significant regulation observed for N– or N- regime respectively precludes further interpreta-tions about the distinction of both nitrogen regimes. Nev-ertheless, our data could suggest an original pathway for microalgae CoenzymeA biosynthesis, inferring a relation-ship between branched-chain amino acids and the
panto-thenate pathway as depicted by Chassagnole et al. (2002)
(Fig.4a). The monitored consumption of leucine could be
here partially explained by the detection of its direct deg-radation intermediate (ketoleucine) and the presence of an alternative end product of its catabolism i.e. the
2-meth-ylbutyric acid (Ganesan et al. 2006). Those observations
suggested an original alternative pathway for microalgae leucine biodegradation, but were not informative enough to elucidate the connectivity of the leucine pathway to the pantothenate pathway. Indeed, the carbon flux arising from leucine degradation could be directed toward the ketois-ovalerate node, or toward another metabolite common to both the pantothenate and the leucine pathway. Concerning the down regulation of pantothenate vitamin, it could be straightforwardly explained by an increasing mobilization
-30
EtOH_1min_T-L1_into(1) - metaboanalyst2 (FC).M1 (PLS-DA) t[Comp. 1]/t[Comp. 2]
Colored according to Obs ID (label)
nit1
SIMCA-P+ 12 - 2012-10-04 09:13:18 (UTC+1) Fig. 2 PLS-DA score plot of
LC-HRMS metabolic signatures ofChlamydomonas reinhardtii
cells grown on nitrogen regime R (blue triangle: ref), N- (red triangle: nit1) and N– (green triangle: nit2). Replicates are indicated withsuffix numbers 1,
2,3,4and5. The model presented the following characteristics R2(Y)=0,989 and Q2=0,869 and was validated using 200
of this precursor for coenzyme A synthesis, the latter mobilized itself to biosynthesize carbohydrates and fats
(Smith et al.2007).
(ii) The hydrophobic amino acid metabolism was also impacted. LC-HRMS suggested complementary informa-tion that was not highlighted with the FTIR approach. Particular attention was paid to the regulation of several aromatic heterocyclic compounds that were significantly down regulated (tryptophan) and up regulated (indole acetic acid) for both nitrogen regimes, and significantly up regulated (phenyl pyruvic acid) for nitrogen regime N–
(Table1). Tryptophan regulation was not surprising, since
it was already observed under salt acclimation for Oryza
sativa(Sanchez et al.2008) or low nitrogen growth regime for Arabidopsis thaliana (Kusano et al. 2011). In 2005,
Bolling and Fiehn (2005) also performed a nitrogen
star-vation experiment on C. reinhardtii cells but rather
observed a positive modulation of this amino acid. Dif-ference of experimental protocol could mainly explain this opposition with our results. Recent proteomic results
experiments (Longworth et al. 2012) indicated that the
limitation in nitrogen affected the metabolism of
Fig. 3 Heatmap displaying the 560 LC-HRMS features selected according to the Kruskall Wallisp value results. Pearson distance measurements and Ward clustering algorithm were used for calcu-lations. Samples with nitrogen regimes R (blue: ref), N- (red: nit1) and N– (green: nit2) are disposed inrowsand replicates are indicated
(min) (ppm) N- vs R R N– vs R R
L-Tryptophan 3.13 0.10 203.0826 -0.22 0.01 0.008 0.02 0.008 Essential amino
acid
Essential amino acid metabolism
Phenyl pyruvic acid/phenyl pyruvate
5.26 0.14 163.0400 -0.29 0.54 0.310 5.06 0.032 Phenylpyruvic acid
derivatives
Intermediate or catabolic byproduct of phenylalanine metabolism
Indoleacetic acid/ indoleacetate
8.52 0.07 174.0564 1.74 2.13 0.008 9.87 0.008 Aromatic
heteropolycyclic compounds
Tryptophan Metabolism (growth hormone plant)
L-Leucine 0.97 0.03 130.0874 0.17 0.06 0.008 0.06 0.008 Essential amino
acid
Essential amino acid metabolism
N-acetyl-valine 6.61 0.03 158.0824 0.88 0.22 0.008 0.24 0.008 Amino acids and
derivatives
Valine is involved in carbohydrate metabolism.
Ketoleucine (KLeu)
3.01 0.12 129.0557 0.24 0.36 0.032 1.90 0.151 Branched fatty
acids
Component of Leucine catabolic pathway
2-Methylbutyric acid (2-MBA)
7.48 0.03 101.0609 0.85 1.44 0.690 3.59 0.008 Branched fatty
acids
Component of leucine catabolic pathway
Pantothenic acid/ pantothenate
2.26 0.47 218.1033 -0.32 0.40 0.016 0.47 0.032 Essential vitamins Pantothenic acid is needed to form coenzyme-A (CoA), and is thus critical
in the metabolism and synthesis of carbohydrates, proteins, and fats
Uridine 0.91 -0.04 243.0621 -0.85 0.12 0.008 0.03 0.008 Pyrimidine
nucleosides
Pyrimidine metabolism
Guanosine 1.10 0.28 282.0842 -0.52 0.50 0.016 0.31 0.008 Purine nucleosides Ribonucleosides metabolism
Guanosine-5-monophosphate
1.05 0.37 362.0506 -0.35 0.34 0.008 0.50 0.056 Purine nucleosides Purine metabolism
Adenosine 1.27 0.06 266.0903 3.11 0.26 0.008 0.27 0.008 Purine nucleosides Important biological roles in addition to being components of DNA and
RNA. For instance, adenosine plays an important role in energy transfer—as adenosine triphosphate (ATP) and adenosine diphosphate (ADP)
5-Deoxy-5-methyladenosine
5.95 -0.02 296.0822 -0.36 0.16 0.008 0.19 0.008 Purine nucleosides Purine metabolism
Nitrogen regime most discriminant features selected a through Kruskal–Wallis or Mann–Whitney test performed between the three culture conditions were annotated using commercial standards. First four columns correspond to experimental annotation parameters, following ones to statistical indicators and last ones to annotation, chemical taxonomy, and biological function of identified features
Rnormal condition culture
Nnitrogen depleted culture
Bold values indicate an up-regulation for the nitrogen depleted regime
Italicized values indicate a down-regulation for the nitrogen depleted regime a
RTretention time
b d
(Observed mass-theoretical mass)/theoretical mass9106
c pvalue of Mann–Whitney test
F.
Courant
et
Author's
personal
hydrophobic amino acids. Indeed, the shikimate pathway, the biosynthetic pathway by which the aromatic amino
acids, phenylalanine, tyrosine and tryptophan were
assembled, was found to be impacted in their proteomic experiments, thus supporting the regulation observed in our experiment for tryptophan and a catabolic byproduct of phenylalanine (Phenyl pyruvic acid). The fact that coherent pathways were identified with two independent omics experiments suggests the biological relevance of such a reversible trigger.
(iii) The auxin signaling pathway could be assessed in our proof of principle study. Surprisingly, indole acetic acid (also called auxin) was detected among the most positively impacted LC-HRMS features during this pro-gressive nitrogen regime. This phytohormone, described to be mainly implicated in superior plant growth during its whole development, has also been detected in microbial organisms, fungi, animals and algae lineage (Lau et al.
2009). The auxin function remains however unclear in
microalgae even if known precursors were identified in
other organisms [5-hydroxy-tryptamine for O. sativa for
example (Sanchez et al.2008)]. In our case, no tryptamine
derivatives were detected among the most impacted fea-tures. Nevertheless, the opposite progressive regulation of both auxin (accumulation) and its distant precursor tryp-tophan (reduction) remained the strongest evidence sug-gesting the existence of an auxin-like signaling pathway in
microalgae as already proposed by De Smet et al. (2011),
Lau et al. (2011). According to the observed regulation
pattern, it was reasonable to hypothesize that the progres-sive nitrogen regime induced a stress response regulatory loop where the reduction of tryptophan levels could be due to its constant mobilization as a precursor to biosynthesize auxin phytohormone. It could also be the consequence of a metabolic switch involving an unknown regulatory path-way that would be tryptophan independent and able to activate the biosynthesis of auxin phytohormone from an indole derivative for example as suggested by Soeno et al.
(2010) (Fig.4b).
(iv) The nucleoside metabolisms were found to be impacted. Nucleoside compounds were found to be down regulated during our nitrogen limitation protocol. Adeno-sine, adenosine derivative, guanosine and guanosine derivative were triggered in response to a low level of
available nitrogen (Table1). This finding was quite
sur-prising, since those metabolites are not known to be directly involved in nitrogen sensing in microalgae. Nev-ertheless, the fact that those metabolites—and moreover their regulation—were highlighted by independent experi-ments with different techniques—i.e. ours and Lee do and
colleagues’s investigations (Lee do et al. 2012)—,
rein-force the novelty of such metabolites as being implicated in
nitrogen induced signaling pathway and the pertinence of the discovered biomarkers in this proof of concept.
3.3 Last objective of this proof of concept study: evaluating the biomarkers suggested
by the untargeted metabolomic investigation for nitrogen limited microalgae growing in photobioreactor
3.3.1 Chlamydomonas reinhardtii cells were grown in photobioreactors under two continuous regimes providing reference and nitrogen limited culture conditions
The non-targeted metabolomic investigation performed on C. reinhardtii cells grown in nitrogen-limited batch cul-tures condition proposed several biomarkers involved in
carbon storage molecules, amino-acids, nucleosides
metabolism or putative algae hormone signaling pathway. The last objective of this proof of concept study consisted in assessing the preliminary verification of the metabolo-mic proposed targets in real small-scale industrial pro-duction conditions. For that purpose, a continuous culture
was performed to grow C. reinhardtii cells in nutrient
optimized and highly controlled environment (photobiore-actor) providing a reference culture in chemostat mode. By modifying the dilution rate of the growing medium, it was possible to obtain a nitrogen-modified chemostat mode thus providing a nitrogen-limited continuous culture assay (Table S1). Biochemical analyses were performed on both C. reinhardtii cultures, targeting carbon storage molecule and proteins preferentially. Total carbohydrates, starch and total protein analyses were performed to confirm the accumulation of energetic macromolecules and the direct effect of nitrogen starvation on protein content. Amino-acids profiling was moreover accomplished to assess the pertinence of amino-acids biomarkers suggested by untar-geted-metabolomics.
3.3.2 Targeted biochemical analysis of macromolecules confirmed FTIR analysis
3.3.3 Amino-acids analysis confirmed partially biomarkers proposed by untargeted metabolomics
Comparison of aminograms results of nitrogen limited regime versus optimized nitrogen regime provided new insights about the biomarkers proposed by the untargeted
metabolomic study (Table2). Small or almost
non-signif-icant regulations were monitored for phenylalanine or leucine, bringing therefore uncertainty about the degree of pertinence of those metabolites as potentially useful bio-markers in real small-scale industrial production condi-tions. Nevertheless, attention will be particularly paid on two metabolites associated to the BCCAs catabolism pathway that regulations were not confirmed in our proof of concept (2-methylbutyric acid and ketoleucine). Indeed, if their regulations were to be confirmed in continuous cultures, those potential biomarkers should be of great interest for online monitoring, since they were found to be not only intracellular metabolites but also extracellular
compound as described by Ganesan et al. (2006). This last
point, that could not be investigated in the context of a proof of concept study, will be explored in the close future,
for the discovery of original valuable biomarkers. It should
also bring new insights for C. reinhardtii’s capability of
secreting novel molecules (Baba et al.2011).
Cysteine was found to be significantly up-regulated in our experimental continuous cultures conditions. This was quite surprising since such an up-regulation was only observed for phosphate starvation in previous metabolomic
studies (Bolling and Fiehn (2005)), and down regulation
normally attributed to sulfur deprivation (Carfagna et al.
2011). However, recent work of Awasthi et al. (2012) or
Girault et al. (2008) bring an element of explanation by
suggesting a mobilization of sulfur amino acid for the biosynthesis of cysteine rich proteins involved in stress mechanism (lipid transfer).
Finally, as suggested by the metabolomic investigation of our proof of concept, tryptophan down regulation was confirmed in photobioreactor conditions, reinforcing the relevancy of this metabolite as a potential biomarker of nitrogen limited regime. Moreover, this result indirectly raised the question of the relevancy of the auxin function in microalgae that should be investigated more accurately in the next future.
Indole-3-acetic acid Indole-3-acetic acid conjugate Indole
Fig. 4 Maps of putative impacted pathways suggested by metabolo-mics investigations. MS detected metabolites are highlighted inbold
on the pathways. Relative level of biomarkers are indicated with
arrows, first one accounting for N- regime and second one for N– regime. Green arrow corresponds to down regulation (regime compared to standard) and red arrow to up regulation (regime compared to standard).White question markindicates that observed regulation presented a p value above 0.05 threshold. Indirect
connections between metabolites are indicated withdashed arrows.
apantothenate pathway as depicted by Chassagnole et al. (2002). 2
-MBA stands for 2-methylbutyric acid, Kleu for ketoleucine. Putative connections between the leucine pathway and the pantothenate pathway are indicated withred dashed arrowswithred question mark
4 Conclusion
The emerging field of metabolomics, in which a large number of small molecule metabolites are detected quan-titatively, promises an immense application potential for different areas. In this proof of principle study, it was applied in the field of microalgae engineering processes for detection of crucial disturbances in the concentration of key biomarkers, triggered by nitrogen-limited culture conditions. Our aim was to assess whether an untargeted metabolomic approach could evidence some original can-didate biomarkers and to validate them in the framework of real small-scale industrial production conditions.
FTIR and LC-HRMS techniques were both investigated and demonstrated useful and complementary information to this purpose. They both converged to similar observa-tions, suggesting an increase of carbon storage molecule (carbohydrates, and in a less marked manner lipids). Moreover MS allowed detecting a modulation of their common precursor biosynthesis pathway (pantothenate
biosynthesis pathway) in connection to the BCAAs catab-olism. MS analyses also showed changes in levels of metabolites from the auxin pathway and hinted at a pos-sible alternative route to auxin production.
Those results were partially confirmed or denied on continuous cultures performed in photobioreactors and thus allowed to think that certain of these biomarkers of interest could be used as intracellular indicators for a better mon-itoring of the carbon storage molecule production by microalgae grown under nitrogen regime (e.g. tryptophan). Moreover, it highlighted the possibility of using potentially relevant metabolites as both intra and extracellular bio-markers (e.g. 2-methylbutyric acid and ketoleucine). This last opportunity will be explored in the near future since it could open the route of finding biomarkers directly usable for online monitoring of photobioreactors. This proof-of-concept study demonstrated that an untargeted metabolo-mic approach promises a great potential in the field of bioprocesses since it was able to drive the targeted chem-ical analysis of a very constraining experimental protocol
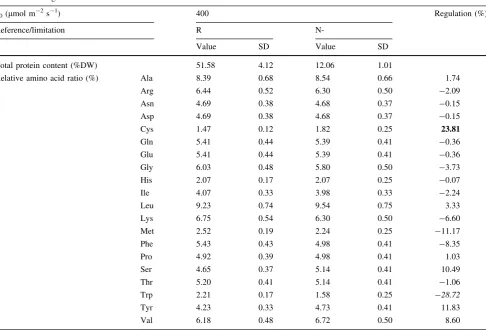
Table 2 Aminogram results
q0(lmol m-2s-1) 400 Regulation (%)
Reference/limitation R
N-Value SD Value SD
Total protein content (%DW) 51.58 4.12 12.06 1.01
Relative amino acid ratio (%) Ala 8.39 0.68 8.54 0.66 1.74
Arg 6.44 0.52 6.30 0.50 -2.09
Asn 4.69 0.38 4.68 0.37 -0.15
Asp 4.69 0.38 4.68 0.37 -0.15
Cys 1.47 0.12 1.82 0.25 23.81
Gln 5.41 0.44 5.39 0.41 -0.36
Glu 5.41 0.44 5.39 0.41 -0.36
Gly 6.03 0.48 5.80 0.50 -3.73
His 2.07 0.17 2.07 0.25 -0.07
Ile 4.07 0.33 3.98 0.33 -2.24
Leu 9.23 0.74 9.54 0.75 3.33
Lys 6.75 0.54 6.30 0.50 -6.60
Met 2.52 0.19 2.24 0.25 -11.17
Phe 5.43 0.43 4.98 0.41 -8.35
Pro 4.92 0.39 4.98 0.41 1.03
Ser 4.65 0.37 5.14 0.41 10.49
Thr 5.20 0.41 5.14 0.41 -1.06
Trp 2.21 0.17 1.58 0.25 -28.72
Tyr 4.23 0.33 4.73 0.41 11.83
Val 6.18 0.48 6.72 0.50 8.60
The first column corresponds to the list of quantified amino acids. The following fourth to the quantification results and the associated standard deviation (SD) for nitrogen non-limited culture (R) and nitrogen limited culture (N-). The last column correspond to the regulation that was calculated according to the formula:ðN#Þ#ðRÞ
ðRÞ %100. The most impacted amino acids were highlighted according to their up- (bold) or
consisting of performing continuous limited cultures in photobioreactors.
Acknowledgments The authors wish to acknowledge CORSAIRE metabolomics analytical facilities from BIOGENOUEST network (http://www.biogenouest.org/). Part of this work has been funded by the French National Research Agency project ALGOMICS (ANR-08-BIOE-002).
References
Alvarez-Ordonez, A., Mouwen, D. J., Lopez, M., & Prieto, M. (2011). Fourier transform infrared spectroscopy as a tool to characterize molecular composition and stress response in foodborne path-ogenic bacteria. [Research Support, Non-U.S. Gov’t Review].
Journal of Microbiol Methods, 84(3), 369–378.
Antignac, J. P., Courant, F., Pinel, G., Monteau, F., & Le Bizec, B. (2011). Mass spectrometric based metabolomic in the field of chemical risk: State of the art, pitfalls, and future trends.Trends in Analytical Chemistry, 30, 292–301.
Awasthi, M., Batra, J., & Kateriya, S. (2012). Disulphide bridges of phospholipase C ofChlamydomonas reinhardtiimodulates lipid interaction and dimer stability. PLoS One, 7(6), e39258. doi: 10.1371/journal.pone.0039258.
Baba, M., Suzuki, I., & Shiraiwa, Y. (2011). Proteomic analysis of high-CO(2)-inducible extracellular proteins in the unicellular green algaChlamydomonas reinhardtii. Plant and Cell Physi-ology, 52(8), 1302–1314. doi:10.1093/pcp/pcr078.
Ball, S. G., Dirick, L., Decq, A., Martiat, J. C., & Matagne, R. F. (1990). Physiology of starch storage in the monocellular alga
Chlamydomonas reinhardtii. Plant Science, 66(1), 1–9. doi: 10.1016/0168-9452(90)90162-h.
Bolling, C., & Fiehn, O. (2005). Metabolite profiling of Chlamydo-monas reinhardtiiunder nutrient deprivation.Plant Physiology, 139(4), 1995–2005.
Bolten, C. J., Kiefer, P., Letisse, F., Portais, J. C., & Wittmann, C. (2007). Sampling for metabolome analysis of microorganisms.Analytical Chemistry, 79(10), 3843–3849. doi:10.1021/ac0623888.
Breuer, G., Lamers, P. P., Martens, D. E., Draaisma, R. B., & Wijffels, R. H. (2012). The impact of nitrogen starvation on the dynamics of triacylglycerol accumulation in nine microalgae strains.Bioresource Technology, 124, 217–226. doi:10.1016/j.biortech.2012.08.003. Carfagna, S., Salbitani, G., Vona, V., & Esposito, S. (2011). Changes
in cysteine and O-acetyl-L-serine levels in the microalga
Chlorella sorokiniana in response to the S-nutritional status.
Journal of Plant Physiology, 168(18), 2188–2195. doi: 10.1016/j.jplph.2011.07.012.
Chassagnole, C., Letisse, F., Diano, A., & Lindley, N. D. (2002). Carbon flux analysis in a pantothenate overproducing Coryne-bacterium glutamicum strain. Molecular Biology Reports, 29(1–2), 129–134.
Courant, F., Royer, A. L., Chereau, S., Morvan, M. L., Monteau, F., Antignac, J. P., et al. (2012). Implementation of a semi-automated strategy for the annotation of metabolomic finger-prints generated by liquid chromatography-high resolution mass spectrometry from biological samples. Analyst, 137(21), 4958–4967. doi:10.1039/c2an35865d.
De Smet, I., Voss, U., Lau, S., Wilson, M., Shao, N., Timme, R. E., et al. (2011). Unraveling the evolution of auxin signaling.Plant Physiology, 155(1), 209–221.
Dean, A. P., Sigee, D. C., Estrada, B., & Pittman, J. K. (2010). Using FTIR spectroscopy for rapid determination of lipid accumulation
in response to nitrogen limitation in freshwater microalgae. [Research Support, Non-U.S. Gov’t].Bioresource Technology, 101(12), 4499–4507. doi:10.1016/j.biortech.2010.01.065. DuBois, G. K., Hamilton, J. K., Rebers, P. A., & Smith, F. (1956).
Colorimetric Method for Determination of Sugars and Related Substances.Analytical Chemistry, 28(3), 350–356.
El Rammouz, R., Letisse, F., Durand, S., Portais, J. C., Moussa, Z. W., & Fernandez, X. (2010). Analysis of skeletal muscle metabolome: Evaluation of extraction methods for targeted metabolite quantification using liquid chromatography tandem mass spectrometry.Analytical Biochemistry, 398(2), 169–177. Ganesan, B., Dobrowolski, P., & Weimer, B. C. (2006). Identification
of the leucine-to-2-methylbutyric acid catabolic pathway of
Lactococcus lactis. Applied and Environment Microbiology, 72(6), 4264–4273. doi:10.1128/AEM.00448-06.
Girault, T., Francois, J., Rogniaux, H., Pascal, S., Delrot, S., Coutos-Thevenot, P., et al. (2008). Exogenous application of a lipid transfer protein-jasmonic acid complex induces protection of grapevine towards infection by Botrytis cinerea.Plant Physiol-ogy and Biochemistry, 46(2), 140–149. doi:10.1016/j.plaphy. 2007.10.005.
Goff, K. L., Quaroni, L., & Wilson, K. E. (2009). Measurement of metabolite formation in single living cells ofChlamydomonas reinhardtiiusing synchrotron Fourier-Transform Infrared spec-tromicroscopy. [Research Support, Non-U.S. Gov’t]. Analyst, 134(11), 2216–2219. doi:10.1039/b915810c.
Gonzalez-Fernandez, C., & Ballesteros, M. (2012). Linking micro-algae and cyanobacteria culture conditions and key-enzymes for carbohydrate accumulation. Biotechnology Advances, 30(6), 1655–1661. doi:10.1016/j.biotechadv.2012.07.003.
Gorman, D. S., & Levine, R. P. (1965). Cytochrome f and plastocyanin: Their sequence in the photosynthetic electron transport chain ofChlamydomonas reinhardi.Proceedings of the National Academy of Sciences of the United States of America, 54(6), 1665–1669.
Hutner, S. H., Provasoli, L., Schatz, A., & Haskins, C. P. (1950). Some Approaches to the Study of the Role of Metals in the Metabolism of Microorganisms.Proceedings of the American Philosophical Society, 94(2), 152–170.
Jamers, A., Blust, R., & De Coen, W. (2009). Omics in algae: Paving the way for a systems biological understanding of algal stress phenomena?Aquatic Toxicology, 92(3), 114–121.
James, G. O., Hocart, C. H., Hillier, W., Chen, H., Kordbacheh, F., Price, G. D., et al. (2011). Fatty acid profiling of Chlamydo-monas reinhardtii under nitrogen deprivation. Bioresource Technology, 102(3), 3343–3351.
Klein, U., & Betz, A. (1978). Some approaches to the study of the role of metals in the metabolism of microorganisms.Plant Physiol-ogy, 61(6), 953–956.
Kusano, M., Fukushima, A., Redestig, H., & Saito, K. (2011). Metabolomic approaches toward understanding nitrogen metab-olism in plants. Journal of Experimental Botany, 62(4), 1439–1453.
Lam, M. K., & Lee, K. T. (2012). Microalgae biofuels: A critical review of issues, problems and the way forward.Biotechnology Advances, 30(3), 673–690.
Larkum, A. W., Ross, I. L., Kruse, O., & Hankamer, B. (2012). Selection, breeding and engineering of microalgae for bioenergy and biofuel production. Trends in Biotechnology, 30(4), 198–205.
Lau, S., De Smet, I., Kolb, M., Meinhardt, H., & Jurgens, G. (2011). Auxin triggers a genetic switch. Nature Cell Biology, 13(5), 611–615.
Lee do, Y., Park, J. J., Barupal, D. K., & Fiehn, O. (2012). System response of metabolic networks inChlamydomonas reinhardtii
to total available ammonium. Molecular and Cellular Proteo-mics, 11(10), 973–988. doi:10.1074/mcp.M111.016733. Longworth, J., Noirel, J., Pandhal, J., Wright, P. C., & Vaidyanathan,
S. (2012). HILIC- and SCX-based quantitative proteomics of
Chlamydomonas reinhardtiiduring nitrogen starvation induced lipid and carbohydrate accumulation. Journal of Proteome Research,. doi:10.1021/pr300692t.
Lowry, O., Rosenbrough, N., Farr, A., & Randall, R. (1951). Protein measurement with the Folin phenol reagent.Journal of Biolog-ical Chemistry, 193(1), 265–275.
Martinez-Gomez, P., Sanchez-Perez, R., & Rubio, M. (2012). Clari-fying omics concepts, challenges, and opportunities for Prunus breeding in the postgenomic era.OMICS: A Journal of Integrative Biology, 16(5), 268–283. doi:10.1089/omi.2011.0133.
Martzolff, A., Cahoreau, E., Cogne, G., Peyriga, L., Portais, J. C., Dechandol, E., et al. (2012). Photobioreactor design for isotopic non-stationary (13) C-metabolic flux analysis (INST (13) C-MFA) under photoautotrophic conditions.Biotechnology and Bioengineering, 109(12), 3030–3040. doi:10.1002/bit.24575. Mecozzi, M., Pietroletti, M., & Tornambe, A. (2011). Molecular and
structural characteristics in toxic algae cultures of Ostreopsis ovata and Ostreopsis spp. evidenced by FTIR and FTNIR spectroscopy. [Research Support, Non-U.S. Gov’t]. Spectrochi-mica Acta Part A: Molecular and Biomolecular Spectroscopy, 78(5), 1572–1580. doi:10.1016/j.saa.2011.02.002.
Nicholson, J., Connelly, J., Lindon, J., & Holmes, E. (2002). Metabonomics: A platform for studying drug toxicity and gene function.Nature Reviews Drug Discovery, 1(2), 153–161. Nicholson, J., Lindon, J., & Holmes, E. (1999). ‘Metabonomics’:
Understanding the metabolic responses of living systems to pathophysiological stimuli via multivaraiate statistical analysis of biological NMR spectroscopic data. Xenobiotica, 29(11), 1181–1189.
Ratha, S. K., & Prasanna, R. (2012). Bioprospecting microalgae as potential sources of ‘‘green energy’’–challenges and perspectives (review). Prikladnaia Biokhimiia i Mikrobiologiia, 48(2), 133–149.
Sanchez, D. H., Siahpoosh, M. R., Roessner, U., Udvardi, M., & Kopka, J. (2008). Plant metabolomics reveals conserved and divergent metabolic responses to salinity. Physiologia Planta-rum, 132(2), 209–219.
Smith, A. G., Croft, M. T., Moulin, M., & Webb, M. E. (2007). Plants need their vitamins too.Current Opinion in Plant Biology, 10(3), 266–275.
Smith, C. A., Want, E. J., O’Maille, G., Abagyan, R., & Siuzdak, G. (2006). XCMS: Processing mass spectrometry data for metab-olite profiling using nonlinear peak alignment, matching, and identification. Analytical Chemistry, 78(3), 779–787. doi: 10.1021/ac051437y.
Soeno, K., Goda, H., Ishii, T., Ogura, T., Tachikawa, T., Sasaki, E., et al. (2010). Auxin biosynthesis inhibitors, identified by a genomics-based approach, provide insights into auxin biosyn-thesis.Plant and Cell Physiology, 51(4), 524–536.
Theodoridis, G., Gika, H., & Wilson, I. (2008). LC-MS-based methodology for global metabolite profiling in metabonomics/ metabolomics.Trends in Analytical Chemistry, 27, 251–260. Van Vooren, G., Le Grand, F., Legrand, J., Cuine, S., Peltier, G., &
Pruvost, J. (2012). Investigation of fatty acids accumulation in
Nannochloropsis oculatafor biodiesel application.Bioresource Technology, 124, 421–432. doi:10.1016/j.biortech.2012.08.009. Wang, J. H., Byun, J., & Pennathur, S. (2010). Analytical approaches
to metabolomics and applications to systems biology.Seminars in Nephrology, 30(5), 500–511.
Wang, B., Lan, C. Q., & Horsman, M. (2012). Closed photobioreactors for production of microalgal biomasses.Biotechnology Advances, 30(4), 904–912. doi:10.1016/j.biotechadv.2012.01.019.
Wegener, K. M., Singh, A. K., Jacobs, J. M., Elvitigala, T., Welsh, E. A., Keren, N., et al. (2010). Global proteomics reveal an atypical strategy for carbon/nitrogen assimilation by a cyanobacterium under diverse environmental perturbations. Molecular and Cellular Proteomics, 9(12), 2678–2689.
Winder, C. L., Cornmell, R., Schuler, S., Jarvis, R. M., Stephens, G. M., & Goodacre, R. (2011). Metabolic fingerprinting as a tool to monitor whole-cell biotransformations.Analytical and Bioanalyt-ical Chemistry, 399(1), 387–401. doi:10.1007/s00216-010-4342-z. Wu, H., Volponi, J. V., Oliver, A. E., Parikh, A. N., Simmons, B. A., & Singh, S. (2011). In vivo lipidomics using single-cell Raman spectroscopy.Proceedings of the National Academy of Sciences of the United States of America, 108(9), 3809–3814.