SELF-STUDY Course SS1978
Principles of Epidemiology
in Public Health Practice
Third Edition
An Introduction
to Applied Epidemiology and Biostatistics
October 2006 Updated May 2012
U.S. DEPARTMENT OF HEALTH AND HUMAN SERVICES Centers for Disease Control and Prevention (CDC)
CONTENTS
Acknowledgments...v Introduction ... viii
Lesson One: Introduction to Epidemiology
Lesson Introduction ... 1-1 Lesson Objectives ... 1-1 Major Sections
Definition of Epidemiology ... 1-2 Historical Evolution of Epidemiology ... 1-7 Uses ... 1-12 Core Epidemiologic Functions ... 1-15 The Epidemiologic Approach ... 1-21 Descriptive Epidemiology ... 1-31 Analytic Epidemiology ... 1-46 Concepts of Disease Occurrence ... 1-52 Natural History and Spectrum of Disease ... 1-59 Chain of Infection ... 1-62 Epidemic Disease Occurrence ... 1-72 Summary ... 1-80 Exercise Answers ... 1-81 Self-Assessment Quiz ... 1-85 Answers to Self-Assessment Quiz ... 1-90 References ... 1-93
Lesson Two: Summarizing Data
Lesson Introduction ... 2-1 Lesson Objectives ... 2-1 Major Sections
Lesson Three: Measures of Risk
Lesson Introduction ... 3-1 Lesson Objectives ... 3-1 Major Sections
Frequency Measures ... 3-2 Morbidity Frequency Measures ... 3-10 Mortality Frequency Measures ... 3-20 Natality (Birth) Measures ... 3-38 Measures of Association ... 3-39 Measures of Public Health Impact ... 3-48 Summary ... 3-51 Exercise Answers ... 3-52 Self-Assessment Quiz ... 3-56 Answers to Self-Assessment Quiz ... 3-62 References ... 3-65
Lesson Four: Displaying Public Health Data
Lesson Introduction ... 4-1 Lesson Objectives ... 4-1 Major Sections
Introduction to Tables and Graphs ... 4-2 Tables ... 4-3 Graphs ... 4-22 Other Data Displays ... 4-42 Using Computer Technology ... 4-63 Summary ... 4-66 Exercise Answers ... 4-72 Self-Assessment Quiz ... 4-79 Answers to Self-Assessment Quiz ... 4-84 References ... 4-87
Lesson Five: Public Health Surveillance
Lesson Introduction ... 5-1 Lesson Objectives ... 5-1 Major Sections:
Appendix B. CDC Fact Sheet on Chlamydia ... 5-45 Appendix C. Examples of Surveillance ... 5-48 Appendix D. Major Health Data Systems in the United States ... 5-52 Appendix E. Limitations of Notifiable Disease Surveillance and
Recommendations for Improvement... 5-53 Exercise Answers ... 5-57 Self-Assessment Quiz ... 5-63 Answers to Self-Assessment Quiz ... 5-68 References ... 5-73
Lesson Six: Investigating an Outbreak
Lesson Introduction ... 6-1 Lesson Objectives ... 6-1 Major Sections:
Introduction to Investigating an Outbreak ... 6-2 Steps of an Outbreak Investigation ... 6-8 Summary ... 6-57 Exercise Answers ... 6-59 Self-Assessment Quiz ... 6-64 Answers to Self-Assessment Quiz ... 6-71 References ... 6-75
ACKNOWLEDGMENTS
Developed by
U.S. Department of Health and Human Services Centers for Disease Control and Prevention (CDC) Office of Workforce and Career Development (OWCD) Career Development Division (CDD)
Atlanta, Georgia 30333
T echnical Cont ent
Richard C. Dicker, MD, MSc, Lead Author, CDC/OWCD/CDD (retired) Fátima Coronado, MD, MPH, CDC/OWCD/CDD
Denise Koo, MD, MPH, CDC/OWCD/CDD Roy Gibson Parrish, II, MD
Development T eam
Sonya D. Arundar, MS, CDC (contractor) Ron Teske, MS, CDC (contractor)
Susan Baker Toal, MPH, Public Health Consultant Nancy M. Hunt, MPH, CDC (ORISE Fellow) Susan D. Welch, MEd, Georgia Poison Center Cassie Edwards, CDC (contractor)
Planning Commit t ee
Christopher K. Allen, RPh, MPH, CDC W. Randolph Daley, DVM, MPH, CDC Patricia Drehobl, RN, MPH
Sharon Hall, RN, PhD, CDC Dennis Jarvis, MPH, CHES, CDC Denise Koo, MD, MPH, CDC
Graphics/ Illust rat ions
Sonya D. Arundar, MS, CDC (contractor) Lee Oakley, CDC (retired)
Jim Walters, CDC
T echnical Reviewers
Tomas Aragon, MD, DrPH, San Francisco Department of Public Health Diane Bennett, MD, MPH, CDC
Danae Bixler, MD, MPH, West Virginia Bureau for Public Health R. Elliot Churchill, MS, MA, CDC (retired)
Roxanne Ereth, MPH, Arizona Department of Health Services
Nancy C. Gathany, MEd, CDC
Marjorie A.Getz, MPHIL, Bradley University, Illinois
John Mosely Hayes, DrPH, MBA, MSPH, Tribal Epidemiology Center United South and Eastern Tribes, Inc., Tennessee
Richard Hopkins, MD, MSPH, Florida Department of Health John M. Horan, MD, MPH, Georgia Division of Public Health
Christina M. Bruton Kwon, MSPH, Science Applications International Corporation, Atlanta
Edmond F. Maes, PhD, CDC
Sharon McDonnell, MD, MPH, Darmouth Medical School
William S. Paul, MD, MPH, Chicago Department of Public Health
James Ransom, MPH, National Association of County and City Health Officials Lynn Steele, MS, CDC
Donna Stroup, PhD, MSc, American Cancer Society Douglas A. Thoroughman, PhD, MS CDC
Kirsten T. Weiser, MD, Darmouth Hitchcock Medical School Celia Woodfill, PhD, California Department of Health Services
Field Test Participants
Sean Altekruse, DVM, MPH, PhD, U.S. Public Health Service Gwen A. Barnett, MPH, CHES, CDC
Jason Bell, MD, MPH
Lisa Benaise, MD, Med Immune, Inc., Maryland
Amy Binggeli, DrPH, RD, CHES, CLE, Imperial County Public Health Department, California
Kim M. Blindauer, DVM, MPH, Agency for Toxic Substances and Disease Registry R. Bong, RN, BSN, Federal Bureau of Prisons
Johnna L. Burton, BS, CHES, Tennessee Department of Health Catherine C. Chow, MD, MPH, Hawaii Department of Health Janet Cliatt, MT, CLS(NCA), National Institutes of Health
Catherine Dentinger, FNP, MS, New York City Department of Health and Mental Hygiene
Veronica Gordon, BSN, MS, Indian Health Service, New Mexico Susan E. Gorman, PharmD, DABAT, CDC
Deborah Gould, PhD, CDC Juliana Grant, MD, MPH, CDC Lori Evans Hall, PharmD, CDC
Nazmul Hassan, MS, Food and Drug Administration
Daniel L. Holcomb, BS, Agency for Toxic Substances and Disease Registry Asim A. Jani, MD, MPH FACP, CDC
Charletta L. Lewis, BSN, Wellpinit Indian Health Service, Washington Sheila F. Mahoney, CNM, MPH, National Institutes of Health
Cassandra Martin, MPH, CHES, Georgia Department of Human Resources
Gayle L. Miller, DVM, Jefferson County Department of Health and Environment, Colorado
Long S. Nguyen, MPH, CHES, NIH
Paras M. Patel, RPh, Food and Drug Administration Rossanne M. Philen, MD, MS, CDC
Alyson Richmond, MPH, CHES, CDC (contractor)
Glenna A. Schindler, MPH, RN, CHES, Healthcare Services Group, Missouri Sandra K. Schumacher, MD, MPH, CDC
Julie R. Sinclair, MA, DVM, MPH, CDC
INTRODUCTION
This course was developed by the Centers for Disease Control and Prevention (CDC) as a self-study course. Continuing education is available for certified public health educators, nurses, physicians, pharmacists, veterinarians, and public health professionals. CE credit is available only through the CDC/ATSDR Training and Continuing Education Online system at http://www.cdc.gov/TCEOnline.
To receive CE credit, you must register for the course (SS1978) and complete the evaluation and examination online. You must achieve a score of 70% or higher to pass the examination. If you do not pass the first time, you can take the exam a second time. For more information about continuing education, call 1-800-41-TRAIN
(1-800-418-7246) or by e-mail at [email protected].
Course Design
This course covers basic epidemiology principles, concepts, and procedures useful in the surveillance and investigation of health-related states or events. It is designed for federal, state, and local government health professionals and private sector health professionals who are responsible for disease surveillance or investigation. A basic understanding of the practices of public health and biostatistics is recommended.
Course Materials
The course materials consist of six lessons. Each lesson presents instructional text interspersed with relevant exercises that apply and test knowledge and skills gained.
Lesson One: Int roduct ion t o Epidemiology
Key features and applications of descriptive and analytic epidemiology
Lesson T wo: Summarizing Dat a
Calculation and interpretation of mean, median, mode, ranges, variance, standard deviation, and confidence interval
Lesson T hree: Measures of Risk
Calculation and interpretation of ratios, proportions, incidence rates, mortality rates, prevalence, and years of potential life lost
Lesson Four: Displaying Public Healt h Dat a
Preparation and application of tables, graphs, and charts such as arithmetic-scale line, histograms, pie chart, and box plot
Lesson Five: Public Healt h Surveillance
Lesson Six: Invest igat ing an Out break
Steps of an outbreak investigation
A Glossary that defines the major terms used in the course is also provided at the end of Lesson Six.
Supplementary Materials
In addition to the course materials, students may want to use the following:
• A calculator with square root and logarithmic functions for some of the exercises. • A copy of Heymann, DL, ed. Control of Communicable Diseases Manual, 18th
edition, 2004, for reference. Available from the American Public Health Association (202) 777-2742.
Obj ectives
Students who successfully complete this course should be able to correctly:
• Describe key features and applications of descriptive and analytic epidemiology. • Calculate and interpret ratios, proportions, incidence rates, mortality rates, prevalence,
and years of potential life lost.
• Calculate and interpret mean, median, mode, ranges, variance, standard deviation, and
confidence interval.
• Prepare and apply tables, graphs, and charts such as arithmetic-scale line, scatter
diagram, pie chart, and box plot.
• Describe the processes, uses, and evaluation of public health surveillance. • Describe the steps of an outbreak investigation.
General Instructions
Self-study courses are “self-paced.” We recommend that a lesson be completed within two weeks. To get the most out of this course, establish a regular time and method of study. Research has shown that these factors greatly influence learning ability. Each lesson in the course consists of reading, exercises, and a self-assessment quiz.
Reading Assignments
Complete the assigned reading before attempting to answer the self-assessment questions. Read thoroughly and re-read for understanding as necessary. A casual reading may result in missing useful information which supports main themes. Assignments are designed to cover one or two major subject areas. However, as you progress, it is often necessary to combine previous learning to accomplish new skills. A review of previous lessons may be necessary. Frequent visits to the Glossary may also be useful.
Exercises
the exercises can be found at the end of each lesson. Your answers to these exercises are valuable study guides for the final examination.
Self-Assessment Quizzes
After completing the reading assignment, answer the self-assessment quizzes before continuing to the next lesson. Answers to the quizzes can be found at the end of the lesson. After passing all six lesson quizzes, you should be prepared for the final examination.
• Self-assessment quizzes are open book.
• Unless otherwise noted, choose ALL CORRECT answers. • Do not guess at the answer.
• You should score at least 70% correct before continuing to the next lesson.
Tips for Answering Questions • Carefully read the question.
Note that it may ask, “Which is CORRECT?” as well as “Which is NOT CORRECT?” or “Which is the EXCEPTION?”
• Read all the choices given.
One choice may be a correct statement, but another choice may be more nearly correct or complete for the question that is asked.
Final Examination and Course Evaluation
The final examination and course evaluation are available only on-line. The final requirement for the course is an open-book examination. We recommend that you thoroughly review the questions included with each lesson before completing the exam.
Continuing Education
To receive continuing education for completing the self-study course, go to the CDC/ATSDR Training and Continuing Education Online at http://www.cdc.gov/TECOnline and register as a participant. You will need to register for the course (SS1978) and complete the
course evaluation and exam online. You will have to answer at least 70% of the exam questions correctly to obtain continuing education credits/contact hours and a certificate. For more information about continuing education, please call 1-800-41 TRAIN (1-800-418-7246) or go to www.cdc.gov/TCEOnline.
Continuing Education Accreditation Statements
Origination Date: November 4, 2011 Expiration Date: November 4, 2013
CDC, our planners, and our content experts wish to disclose they have no financial interests or other relationships with the manufacturers of commercial products, suppliers of commercial services, or commercial supporters. Planners have reviewed content to ensure there is no bias.
Content will not include any discussion of the unlabeled use of a product or a product under investigational use.
CDC does not accept commercial support.
Cont inuing Medical Educat ion f or Physicians (CME):
The Centers for Disease Control and Prevention is accredited by the Accreditation Council for Continuing Medical Education (ACCME®) to provide continuing medical
education for physicians.
The Centers for Disease Control and Prevention designates this enduring activity for a
maximum of 17 AMA PRA Category 1 Credits™. Physicians should only claim credit commensurate with the extent of their participation in the activity.
Cont inuing Educat ion Designat ed f or Non-Physicians:
Non-physicians will receive a certificate of participation.
Cont inuing Medical Educat ion f or Nurses (CNE):
The Centers for Disease Control and Prevention is accredited as a provider of Continuing Nursing Education by the American Nurses Credentialing Center's Commission on Accreditation.
This activity provides 17 contact hours.
Cont inuing Educat ion f or Cert if ied Healt h Educat ors (CECH):
Commission for Health Education Credentialing, Inc. This program is designed for Certified Health Education Specialists (CHES) to receive up to 17 Category I CECH in
health education. CDC provider number GA0082.
Cont inuing Educat ion f or Pharmacist s (CPE):
The Centers for Disease Control and Prevention is accredited by the Accreditation Council for Pharmacy Education as a provider of continuing pharmacy education.
This program is a designated event for pharmacists to receive 1.7Contact Hours in pharmacy education. The Universal Activity Number is 0387-0000-11-098-H04-P.
Course Category: This activity has been designated as Knowledge-Based. Cost: There is no fee related to the web-based version of the activity. There is a fee charged for the version ordered from the Public Health Foundation.
IACET Cont inuing Educat ion Unit s (CEU):
The CDC has been approved as an Authorized Provider by the International Association for Continuing Education and Training (IACET), 1760 Old Meadow Road, Suite 500, McLean, VA 22102.The CDC is authorized by IACET to offer 1.7 ANSI/IACET CEU's for this program.
Cont inuing Educat ion f or Vet erinarians (AAVSB/ RACE):
This program was reviewed and approved by the AAVSB RACE program for 20 hours of continuing education in jurisdictions which recognize AAVSB RACE approval. Please contact the AAVSB RACE program if you have any comments/concerns regarding this program’s validity or relevancy to the veterinary profession.
Course Evaluation
Even if you are not interested in continuing education, we still encourage you to complete the course evaluation. To do this, go to http://www.cdc.gov/TCEOnline and register as a participant. You will then need to register for the course (SS1978) and complete the course evaluation online. There is no cost to obtain continuing education online. Your comments are valuable to us and will help to revise the self-study course in the future.
Ordering Information
A hard-copy of the text can be obtained from the Public Health Foundation. Specify Item No. SS1978 when ordering.
• Online at: http://bookstore.phf.org • By phone:
INTRODUCTION TO EPIDEMIOLOGY
Recently, a news story described an inner-city neighborhood’s concern about the rise in the number of children with asthma. Another story reported the revised recommendations for who should receive influenza vaccine this year. A third story discussed the extensive disease-monitoring strategies being implemented in a city recently affected by a massive hurricane. A fourth story described a finding published in a leading medical journal of an association in workers exposed to a particular chemical and an increased risk of cancer. Each of these news stories included interviews with public health officials or researchers who called themselves epidemiologists. Well, who are these epidemiologists, and what do they do? What is epidemiology? This lesson is intended to answer those questions by describing what epidemiology is, how it has evolved and how it is used today, and what some of the key methods and concepts are. The focus is on epidemiology in public health practice, that is, the kind of epidemiology that is done at health departments.
Objectives
After studying this lesson and answering the questions in the exercises, you will be able to:
• Define epidemiology
• Summarize the historical evolution of epidemiology
• Name some of the key uses of epidemiology
• Identify the core epidemiology functions
• Describe primary applications of epidemiology in public health practice
• Specify the elements of a case definition and state the effect of changing the value of any of the elements
• List the key features and uses of descriptive epidemiology
• List the key features and uses of analytic epidemiology
• List the three components of the epidemiologic triad
• Describe the different modes of transmission of communicable disease in a population
Major Sections
Definition of Epidemiology ... 1-2 Historical Evolution of Epidemiology ... 1-7 Uses ... 1-12 Core Epidemiologic Functions ... 1-15 The Epidemiologic Approach ... 1-21 Descriptive Epidemiology ... 1-31 Analytic Epidemiology ... 1-46 Concepts of Disease Occurrence ... 1-52 Natural History and Spectrum of Disease ... 1-59 Chain of Infection ... 1-62 Epidemic Disease Occurrence ... 1-72 Summary ... 1-80
Definition of Epidemiology
The word epidemiology comes from the Greek words epi, meaning on or upon, demos, meaning people, and logos, meaning the study of. In other words, the word epidemiology has its roots in the study of what befalls a population. Many definitions have been proposed, but the following definition captures the underlying principles and public health spirit of epidemiology:
Epidemiology is the study of the distribution and
determinants of health-related states or events in specified populations, and the application of this study to the control of health problems.1
Key terms in this definition reflect some of the important principles of epidemiology.
Students of journalism are taught that a good news story, whether it be about a bank robbery, dramatic rescue, or presidential candidate’s speech, must include the 5 W’s: what, who, where, when and why (sometimes cited as why/how). The 5 W’s are the essential components of a news story because if any of the five are missing, the story is incomplete.
The same is true in characterizing epidemiologic events, whether it be an outbreak of norovirus among cruise ship passengers or the use of mammograms to detect early breast cancer. The difference is that epidemiologists tend to use synonyms for the 5 W’s: diagnosis or health event (what), person (who), place (where), time (when), and causes, risk factors, and modes of transmission (why/how).
Study
Epidemiology is a scientific discipline with sound methods of scientific inquiry at its foundation. Epidemiology is data-driven and relies on a systematic and unbiased approach to the collection, analysis, and interpretation of data. Basic epidemiologic methods tend to rely on careful observation and use of valid comparison groups to assess whether what was observed, such as the number of cases of disease in a particular area during a particular time period or the frequency of an exposure among persons with disease, differs from what might be expected. However,
epidemiology also draws on methods from other scientific fields, including biostatistics and informatics, with biologic, economic, social, and behavioral sciences.
In fact, epidemiology is often described as the basic science of public health, and for good reason. First, epidemiology is a quantitative discipline that relies on a working knowledge of probability, statistics, and sound research methods. Second,
epidemiology is a method of causal reasoning based on developing and testing hypotheses grounded in such scientific fields as
biology, behavioral sciences, physics, and ergonomics to explain health-related behaviors, states, and events. However,
epidemiology is not just a research activity but an integral
Distribution
Epidemiology is concerned with the frequency and pattern of
health events in a population:
Frequency refers not only to the number of health events
such as the number of cases of meningitis or diabetes in a population, but also to the relationship of that number to the size of the population. The resulting rate allows epidemiologists to compare disease occurrence across different populations.
Pattern refers to the occurrence of health-related events by
time, place, and person. Time patterns may be annual, seasonal, weekly, daily, hourly, weekday versus weekend, or any other breakdown of time that may influence disease or injury occurrence. Place patterns include geographic variation, urban/rural differences, and location of work sites or schools. Personal characteristics include
demographic factors which may be related to risk of illness, injury, or disability such as age, sex, marital status, and socioeconomic status, as well as behaviors and
environmental exposures.
Characterizing health events by time, place, and person are activities of descriptive epidemiology,discussed in more detail
later in this lesson.
Determinant: any factor, whether event,
characteristic, or other definable entity, that brings about a change in a health condition or other defined characteristic.1
Determinants
Epidemiology is also used to search for determinants, which are
the causes and other factors that influence the occurrence of disease and other health-related events. Epidemiologists assume that illness does not occur randomly in a population, but happens only when the right accumulation of risk factors or determinants exists in an individual. To search for these determinants,
Health-related states or events
Epidemiology was originally focused exclusively on epidemics of communicable diseases3 but was subsequently expanded to address
endemic communicable diseases and non-communicable infectious diseases. By the middle of the 20th Century, additional
epidemiologic methods had been developed and applied to chronic diseases, injuries, birth defects, maternal-child health, occupational health, and environmental health. Then epidemiologists began to look at behaviors related to health and well-being, such as amount of exercise and seat belt use. Now, with the recent explosion in molecular methods, epidemiologists can make important strides in examining genetic markers of disease risk. Indeed, the term health-related states or events may be seen as anything that affects the well-being of a population. Nonetheless, many epidemiologists still use the term “disease” as shorthand for the wide range of health-related states and events that are studied.
Specified populations
Although epidemiologists and direct health-care providers (clinicians) are both concerned with occurrence and control of disease, they differ greatly in how they view “the patient.” The clinician is concerned about the health of an individual; the epidemiologist is concerned about the collective health of the people in a community or population. In other words, the clinician’s “patient” is the individual; the epidemiologist’s “patient” is the community. Therefore, the clinician and the epidemiologist have different responsibilities when faced with a person with illness. For example, when a patient with diarrheal disease presents, both are interested in establishing the correct diagnosis. However, while the clinician usually focuses on treating and caring for the individual, the epidemiologist focuses on
identifying the exposure or source that caused the illness; the number of other persons who may have been similarly exposed; the potential for further spread in the community; and interventions to prevent additional cases or recurrences.
Application
descriptive and analytic epidemiology as well as experience, epidemiologic judgment, and understanding of local conditions in “diagnosing” the health of a community and proposing
appropriate, practical, and acceptable public health interventions to control and prevent disease in the community.
Summary
Exercise 1.1
Below are four key terms taken from the definition of epidemiology, followed by a list of activities that an epidemiologist might perform. Match the term to the activity that best describes it. You should match only one term per activity.
A. Distribution B. Determinants C. Application
_____ 1. Compare food histories between persons with Staphylococcus food poisoning and those without
_____ 2. Compare frequency of brain cancer among anatomists with frequency in general
population
_____ 3. Mark on a map the residences of all children born with birth defects within 2 miles of a hazardous waste site
_____ 4. Graph the number of cases of congenital syphilis by year for the country
_____ 5. Recommend that close contacts of a child recently reported with meningococcal meningitis receive Rifampin
_____ 6. Tabulate the frequency of clinical signs, symptoms, and laboratory findings among children with chickenpox in Cincinnati, Ohio
Historical Evolution of Epidemiology
Although epidemiology as a discipline has blossomed since World War II, epidemiologic thinking has been traced from Hippocrates through John Graunt, William Farr, John Snow, and others. The contributions of some of these early and more recent thinkers are described below.5
Epidemiology’s roots are nearly 2500 years old.
Circa 400 B.C.
Hippocratesattempted to explain disease occurrence from a rational rather than a supernatural viewpoint. In his essay entitled “On Airs, Waters, and Places,” Hippocrates suggested that environmental and host factors such as behaviors might influence the development of disease.
1662
Another early contributor to epidemiology was John Graunt, a London haberdasher and councilman who published a landmark analysis of mortality data in 1662. This publication was the first to quantify patterns of birth, death, and disease occurrence, noting disparities between males and females, high infant mortality, urban/rural differences, and seasonal variations.5
1800
William Farr built upon Graunt’s work by systematically collecting and analyzing Britain’s mortality statistics. Farr, considered the father of modern vital statistics and surveillance, developed many of the basic practices used today in vital statistics and disease classification. He concentrated his efforts on collecting vital statistics, assembling and evaluating those data, and reporting to responsible health authorities and the general public.4
1854
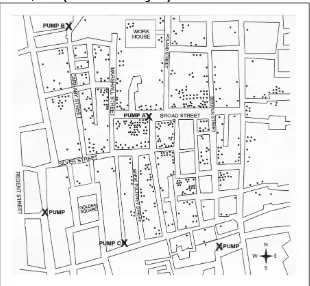
In the mid-1800s, an anesthesiologist named John Snow was conducting a series of investigations in London that warrant his being considered the “father of field epidemiology.” Twenty years before the development of the microscope, Snow conducted studies of cholera outbreaks both to discover the cause of disease and to prevent its recurrence. Because his work illustrates the classic sequence from descriptive epidemiology to hypothesis generation to hypothesis testing (analytic epidemiology) to application, two of his investigations will be described in detail.
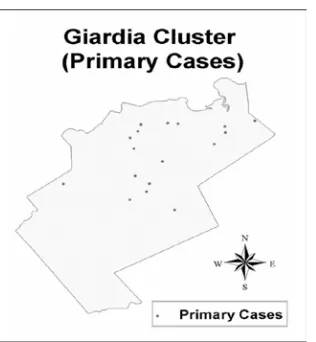
began his investigation by determining where in this area persons with cholera lived and worked. He marked each residence on a map of the area, as shown in Figure 1.1. Today, this type of map, showing the geographic distribution of cases, is called a spot map. Figure 1.1 Spot map of deaths from cholera in Golden Square area, London, 1854 (redrawn from original)
Source: Snow J. Snow on cholera. London: Humphrey Milford: Oxford University Press; 1936.
Because Snow believed that water was a source of infection for cholera, he marked the location of water pumps on his spot map, then looked for a relationship between the distribution of
malt liquor. Access to these uncontaminated rations could explain why none of the brewery’s employees contracted cholera.
To confirm that the Broad Street pump was the source of the epidemic, Snow gathered information on where persons with cholera had obtained their water. Consumption of water from the Broad Street pump was the one common factor among the cholera patients. After Snow presented his findings to municipal officials, the handle of the pump was removed and the outbreak ended. The site of the pump is now marked by a plaque mounted on the wall outside of the appropriately named John Snow Pub.
Figure 1.2 John Snow Pub, London
Source: The John Snow Society [Internet]. London: [updated 2005 Oct 14; cited 2006 Feb
6]. Available from: http://johnsnowsociety.org.
Snow’s second investigation reexamined data from the 1854 cholera outbreak in London. During a cholera epidemic a few years earlier, Snow had noted that districts with the highest death rates were serviced by two water companies: the Lambeth
Table 1.1 Mortality from Cholera in the Districts of London Supplied by the Southwark and Vauxhall and the Lambeth Companies, July 9–August 26, 1854
Districts with Water
Supplied By: (1851 Census)Population Number of Deaths from Cholera Cholera Death Rate per 1,000 Population
Southwark and Vauxhall Only 167,654 844 5.0
Lambeth Only 19,133 18 0.9
Both Companies 300,149 652 2.2
Source: Snow J. Snow on cholera. London: Humphrey Milford: Oxford University Press; 1936.
The data in Table 1.1 show that the cholera death rate was more than 5 times higher in districts served only by the Southwark and Vauxhall Company (intake downstream from London) than in those served only by the Lambeth Company (intake upstream from London). Interestingly, the mortality rate in districts supplied by both companies fell between the rates for districts served
exclusively by either company. These data were consistent with the hypothesis that water obtained from the Thames below London was a source of cholera. Alternatively, the populations supplied by the two companies may have differed on other factors that affected their risk of cholera.
To test his water supply hypothesis, Snow focused on the districts served by both companies, because the households within a district were generally comparable except for the water supply company. In these districts, Snow identified the water supply company for every house in which a death from cholera had occurred during the 7-week period. Table 1.2 shows his findings.
Table 1.2 Mortality from Cholera in London Related to the Water Supply of Individual Houses in Districts Served by Both the Southwark and Vauxhall Company and the Lambeth Company, July 9– August 26, 1854
Water Supply of
Individual House (1851 Census)Population Number of Deaths from Cholera Cholera Death Rate per 1,000 Population
Southwark and Vauxhall Only 98,862 419 4.2
Lambeth Only 154,615 80 0.5
Source: Snow J. Snow on cholera. London: Humphrey Milford: Oxford University Press; 1936.
This study, demonstrating a higher death rate from cholera among households served by the Southwark and Vauxhall Company in the mixed districts, added support to Snow’s hypothesis. It also
established the sequence of steps used by current-day
Company to avoid sources of contamination. Thus, with no knowledge of the existence of microorganisms, Snow
demonstrated through epidemiologic studies that water could serve as a vehicle for transmitting cholera and that epidemiologic
information could be used to direct prompt and appropriate public health action.
19th and 20th centuries
In the mid- and late-1800s, epidemiological methods began to be applied in the investigation of disease occurrence. At that time, most investigators focused on acute infectious diseases. In the 1930s and 1940s, epidemiologists extended their methods to noninfectious diseases. The period since World War II has seen an explosion in the development of research methods and the
theoretical underpinnings of epidemiology. Epidemiology has been applied to the entire range of health-related outcomes, behaviors, and even knowledge and attitudes. The studies by Doll and Hill linking lung cancer to smoking6and the study of cardiovascular
disease among residents of Framingham, Massachusetts7 are two examples of how pioneering researchers have applied
epidemiologic methods to chronic disease since World War II. During the 1960s and early 1970s health workers applied
epidemiologic methods to eradicate naturally occurring smallpox worldwide.8 This was an achievement in applied epidemiology of
unprecedented proportions.
In the 1980s, epidemiology was extended to the studies of injuries and violence. In the 1990s, the related fields of molecular and genetic epidemiology (expansion of epidemiology to look at specific pathways, molecules and genes that influence risk of developing disease) took root. Meanwhile, infectious diseases continued to challenge epidemiologists as new infectious agents emerged (Ebola virus, Human Immunodeficiency virus (HIV)/ Acquired Immunodeficiency Syndrome (AIDS)), were identified (Legionella, Severe Acute Respiratory Syndrome (SARS)), or changed (drug-resistant Mycobacterium tuberculosis, Avian influenza). Beginning in the 1990s and accelerating after the terrorist attacks of September 11, 2001, epidemiologists have had to consider not only natural transmission of infectious organisms but also deliberate spread through biologic warfare and
bioterrorism.
Today, public health workers throughout the world accept and use epidemiology regularly to characterize the health of their
Uses
Epidemiology and the information generated by epidemiologic methods have been used in many ways.9 Some common uses are described below.
Assessing the community’s health
Public health officials responsible for policy development,
implementation, and evaluation use epidemiologic information as a factual framework for decision making. To assess the health of a population or community, relevant sources of data must be identified and analyzed by person, place, and time (descriptive epidemiology).
• What are the actual and potential health problems in the
community?
• Where are they occurring?
• Which populations are at increased risk? • Which problems have declined over time?
• Which ones are increasing or have the potential to increase? • How do these patterns relate to the level and distribution of
public health services available?
More detailed data may need to be collected and analyzed to determine whether health services are available, accessible, effective, and efficient. For example, public health officials used epidemiologic data and methods to identify baselines, to set health goals for the nation in 2000 and 2010, and to monitor progress toward these goals.10-12
Making individual decisions
Many individuals may not realize that they use epidemiologic information to make daily decisions affecting their health. When persons decide to quit smoking, climb the stairs rather than wait for an elevator, eat a salad rather than a cheeseburger with fries for lunch, or use a condom, they may be influenced, consciously or unconsciously, by epidemiologists’ assessment of risk. Since World War II, epidemiologists have provided information related to all those decisions. In the 1950s, epidemiologists reported the increased risk of lung cancer among smokers. In the 1970s,
epidemiologists documented the role of exercise and proper diet in reducing the risk of heart disease. In the mid-1980s,
Completing the clinical picture
When investigating a disease outbreak, epidemiologists rely on health-care providers and laboratorians to establish the proper diagnosis of individual patients. But epidemiologists also
contribute to physicians’ understanding of the clinical picture and natural history of disease. For example, in late 1989, a physician saw three patients with unexplained eosinophilia (an increase in the number of a specific type of white blood cell called an eosinophil) and myalgias (severe muscle pains). Although the physician could not make a definitive diagnosis, he notified public health authorities. Within weeks, epidemiologists had identified enough other cases to characterize the spectrum and course of the illness that came to be known as eosinophilia-myalgia syndrome.13
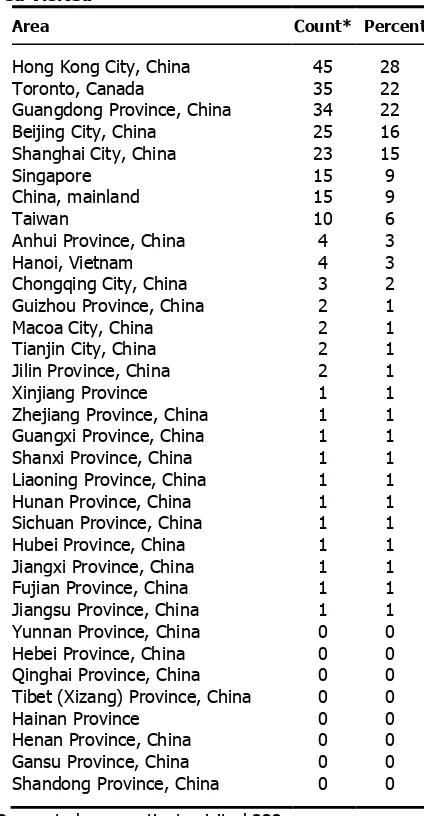
More recently, epidemiologists, clinicians, and researchers around the world have collaborated to characterize SARS, a disease caused by a new type of coronavirus that emerged in China in late 2002.14 Epidemiology has also been instrumental in characterizing
many non-acute diseases, such as the numerous conditions associated with cigarette smoking — from pulmonary and heart disease to lip, throat, and lung cancer.
Searching for causes
Much epidemiologic research is devoted to searching for causal factors that influence one’s risk of disease. Ideally, the goal is to identify a cause so that appropriate public health action might be taken. One can argue that epidemiology can never prove a causal relationship between an exposure and a disease, since much of epidemiology is based on ecologic reasoning. Nevertheless, epidemiology often provides enough information to support effective action. Examples date from the removal of the handle from the Broad St. pump following John Snow’s investigation of cholera in the Golden Square area of London in 1854,5 to the
withdrawal of a vaccine against rotavirus in 1999 after
epidemiologists found that it increased the risk of intussusception, a potentially life-threatening condition.15 Just as often,
epidemiology and laboratory science converge to provide the evidence needed to establish causation. For example,
Exercise 1.2
In August 1999, epidemiologists learned of a cluster of cases of encephalitis caused by West Nile virus infection among residents of Queens, New York. West Nile virus infection, transmitted by mosquitoes, had never before been identified in North America.
Describe how this information might be used for each of the following:
1. Assessing the community’s health
2. Making decisions about individual patients
3. Documenting the clinical picture of the illness
4. Searching for causes to prevent future outbreaks
Core Epidemiologic Functions
In the mid-1980s, five major tasks of epidemiology in public health practice were identified: public health surveillance, field investigation, analytic studies, evaluation, and linkages.17 A
sixth task, policy development, was recently added. These tasks
are described below.
Public health surveillance
Public health surveillance is the ongoing, systematic collection, analysis, interpretation, and dissemination of health data to help guide public health decision making and action. Surveillance is equivalent to monitoring the pulse of the community. The purpose of public health surveillance, which is sometimes called
“information for action,”18 is to portray the ongoing patterns of
disease occurrence and disease potential so that investigation, control, and prevention measures can be applied efficiently and effectively. This is accomplished through the systematic collection and evaluation of morbidity and mortality reports and other
relevant health information, and the dissemination of these data and their interpretation to those involved in disease control and public health decision making.
Figure 1.3. Surveillance Cycle
health program data such as immunization coverage in a community, disease registries, and health surveys.
Most often, surveillance relies on simple systems to collect a limited amount of information about each case. Although not every case of disease is reported, health officials regularly review the case reports they do receive and look for patterns among them. These practices have proven invaluable in detecting problems, evaluating programs, and guiding public health action.
While public health surveillance traditionally has focused on communicable diseases, surveillance systems now exist that target injuries, chronic diseases, genetic and birth defects, occupational and potentially environmentally-related diseases, and health
behaviors. Since September 11, 2001, a variety of systems that rely on electronic reporting have been developed, including those that report daily emergency department visits, sales of over-the-counter medicines, and worker absenteeism.19,20 Because epidemiologists are likely to be called upon to design and use these and other new surveillance systems, an epidemiologist’s core competencies must include design of data collection instruments, data management, descriptive methods and graphing, interpretation of data, and scientific writing and presentation.
Field investigation
As noted above, surveillance provides information for action. One of the first actions that results from a surveillance case report or report of a cluster is investigation by the public health department. The investigation may be as limited as a phone call to the health-care provider to confirm or clarify the circumstances of the reported case, or it may involve a field investigation requiring the coordinated efforts of dozens of people to characterize the extent of an epidemic and to identify its cause.
The objectives of such investigations also vary. Investigations often lead to the identification of additional unreported or
unrecognized ill persons who might otherwise continue to spread infection to others. For example, one of the hallmarks of
investigations of persons with sexually transmitted disease is the identification of sexual partners or contacts of patients. When interviewed, many of these contacts are found to be infected without knowing it, and are given treatment they did not realize they needed. Identification and treatment of these contacts prevents further spread.
investigation of a case of Escherichia coli O157:H7 infection usually focuses on trying to identify the vehicle, often ground beef but sometimes something more unusual such as fruit juice. By identifying the vehicle, investigators may be able to determine how many other persons might have already been exposed and how many continue to be at risk. When a commercial product turns out to be the culprit, public announcements and recalling the product may prevent many additional cases.
Occasionally, the objective of an investigation may simply be to learn more about the natural history, clinical spectrum, descriptive epidemiology, and risk factors of the disease before determining what disease intervention methods might be appropriate. Early investigations of the epidemic of SARS in 2003 were needed to establish a case definition based on the clinical presentation, and to characterize the populations at risk by time, place, and person. As more was learned about the epidemiology of the disease and communicability of the virus, appropriate recommendations regarding isolation and quarantine were issued.21
Field investigations of the type described above are sometimes referred to as “shoe leather epidemiology,” conjuring up images of dedicated, if haggard, epidemiologists beating the pavement in search of additional cases and clues regarding source and mode of transmission. This approach is commemorated in the symbol of the Epidemic Intelligence Service (EIS), CDC’s training program for disease detectives — a shoe with a hole in the sole.
Symbol of EIS
Analytic studies
Surveillance and field investigations are usually sufficient to identify causes, modes of transmission, and appropriate control and prevention measures. But sometimes analytic studies employing more rigorous methods are needed. Often the methods are used in combination — with surveillance and field investigations
providing clues or hypotheses about causes and modes of transmission, and analytic studies evaluating the credibility of those hypotheses.
frequently, descriptive studies, like case investigations, generate hypotheses that can be tested with analytic studies. While some field investigations are conducted in response to acute health problems such as outbreaks, many others are planned studies.
The hallmark of an analytic epidemiologic study is the use of a valid comparison group. Epidemiologists must be skilled in all aspects of such studies, including design, conduct, analysis, interpretation, and communication of findings.
• Design includes determining the appropriate research
strategy and study design, writing justifications and
protocols, calculating sample sizes, deciding on criteria for subject selection (e.g., developing case definitions),
choosing an appropriate comparison group, and designing questionnaires.
• Conduct involves securing appropriate clearances and
approvals, adhering to appropriate ethical principles, abstracting records, tracking down and interviewing
subjects, collecting and handling specimens, and managing the data.
• Analysis begins with describing the characteristics of the
subjects. It progresses to calculation of rates, creation of comparative tables (e.g., two-by-two tables), and
computation of measures of association (e.g., risk ratios or odds ratios), tests of significance (e.g., chi-square test), confidence intervals, and the like. Many epidemiologic studies require more advanced analytic techniques such as stratified analysis, regression, and modeling.
• Finally, interpretation involves putting the study findings
into perspective, identifying the key take-home messages, and making sound recommendations. Doing so requires that the epidemiologist be knowledgeable about the subject matter and the strengths and weaknesses of the study.
Evaluation
Epidemiologists, who are accustomed to using systematic and quantitative approaches, have come to play an important role in evaluation of public health services and other activities. Evaluation is the process of determining, as systematically and objectively as possible, the relevance, effectiveness, efficiency, and impact of activities with respect to established goals.22
• Effectiveness refers to the ability of a program to produce
the intended or expected results in the field; effectiveness differs from efficacy, which is the ability to produce results
under ideal conditions.
the intended results with a minimum expenditure of time and resources.
The evaluation itself may focus on plans (formative evaluation), operations (process evaluation), impact (summative evaluation), or outcomes — or any combination of these. Evaluation of an
immunization program, for example, might assess the efficiency of the operations, the proportion of the target population immunized, and the apparent impact of the program on the incidence of vaccine-preventable diseases. Similarly, evaluation of a
surveillance system might address operations and attributes of the system, its ability to detect cases or outbreaks, and its usefulness.23 Linkages
Epidemiologists working in public health settings rarely act in isolation. In fact, field epidemiology is often said to be a “team sport.” During an investigation an epidemiologist usually
participates as either a member or the leader of a multidisciplinary team. Other team members may be laboratorians, sanitarians, infection control personnel, nurses or other clinical staff, and, increasingly, computer information specialists. Many outbreaks cross geographical and jurisdictional lines, so co-investigators may be from local, state, or federal levels of government, academic institutions, clinical facilities, or the private sector. To promote current and future collaboration, the epidemiologists need to maintain relationships with staff of other agencies and institutions. Mechanisms for sustaining such linkages include official
memoranda of understanding, sharing of published or on-line information for public health audiences and outside partners, and informal networking that takes place at professional meetings.
Policy development
The definition of epidemiology ends with the following phrase: “...and the application of this study to the control of health
problems.” While some academically minded epidemiologists have stated that epidemiologists should stick to research and not get involved in policy development or even make recommendations,24
public health epidemiologists do not have this luxury. Indeed, epidemiologists who understand a problem and the population in which it occurs are often in a uniquely qualified position to
Exercise 1.3
Match the appropriate core function to each of the statements below.
A. Public health surveillance B. Field investigation
C. Analytic studies D. Evaluation E. Linkages
F. Policy development
_____ 1. Reviewing reports of test results for Chlamydia trachomatis from public health clinics
_____ 2. Meeting with directors of family planning clinics and college health clinics to discuss Chlamydia testing and reporting
_____ 3. Developing guidelines/criteria about which patients coming to the clinic should be screened (tested) for Chlamydia infection
_____ 4. Interviewing persons infected with Chlamydia to identify their sex partners
_____ 5. Conducting an analysis of patient flow at the public health clinic to determine waiting times for clinic patients
_____ 6. Comparing persons with symptomatic versus asymptomatic Chlamydia infection to identify predictors
The Epidemiologic Approach
As with all scientific endeavors, the practice of epidemiology relies on a systematic approach. In very simple terms, the
epidemiologist:
• Counts cases or health events, and describes them in terms
of time, place, and person;
• Divides the number of cases by an appropriate denominator
to calculate rates; and
• Compares these rates over time or for different groups of
people.
An epidemiologist: • Counts • Divides • Compares
Before counting cases, however, the epidemiologist must decide what a case is. This is done by developing a case definition. Then, using this case definition, the epidemiologist finds and collects information about the case-patients. The epidemiologist then performs descriptive epidemiology by characterizing the cases collectively according to time, place, and person. To calculate the disease rate, the epidemiologist divides the number of cases by the size of the population. Finally, to determine whether this rate is greater than what one would normally expect, and if so to identify factors contributing to this increase, the epidemiologist compares the rate from this population to the rate in an appropriate
comparison group, using analytic epidemiology techniques. These epidemiologic actions are described in more detail below.
Subsequent tasks, such as reporting the results and recommending how they can be used for public health action, are just as
important, but are beyond the scope of this lesson.
Defining a case
Before counting cases, the epidemiologist must decide what to count, that is, what to call a case. For that, the epidemiologist uses a case definition. A case definition is a set of standard criteria for
that same year. When everyone uses the same standard case definition and a difference is observed, the difference is likely to be real rather than the result of variation in how cases are
classified.
To ensure that all health departments in the United States use the same case definitions for surveillance, the Council of State and Territorial Epidemiologists (CSTE), CDC, and other interested parties have adopted standard case definitions for the notifiable infectious diseases.25 These definitions are revised as needed. In
1999, to address the need for common definitions and methods for state-level chronic disease surveillance, CSTE, the Association of State and Territorial Chronic Disease Program Directors, and CDC adopted standard definitions for 73 chronic disease indicators.29
Other case definitions, particularly those used in local outbreak investigations, are often tailored to the local situation. For example, a case definition developed for an outbreak of viral illness might require laboratory confirmation where such laboratory services are available, but likely would not if such services were not readily available.
Components of a case definition for outbreak investigations
A case definition consists of clinical criteria and, sometimes, limitations on time, place, and person. The clinical criteria usually include confirmatory laboratory tests, if available, or combinations of symptoms (subjective complaints), signs (objective physical findings), and other findings. Case definitions used during outbreak investigations are more likely to specify limits on time, place, and/or person than those used for surveillance. Contrast the case definition used for surveillance of listeriosis (see box below) with the case definition used during an investigation of a listeriosis outbreak in North Carolina in 2000.25,26
Listeriosis — Surveillance Case Definition
Clinical description
Infection caused by Listeria monocytogenes, which may produce any of several clinical syndromes, including stillbirth, listeriosis of the newborn, meningitis, bacteriemia, or localized infections
Laboratory criteria for diagnosis
Isolation of L. monocytogenes from a normally sterile site (e.g., blood or cerebrospinal fluid or, less commonly, joint, pleural, or pericardial fluid)
Case classification
Confirmed: a clinically compatible case that is laboratory confirmed
Source: Centers for Disease Control and Prevention. Case definitions for infectious conditions under public health surveillance. MMWR
Recommendations and Reports 1997:46(RR-10):49-50.
Listeriosis — Outbreak Investigation
Case definition
Clinically compatible illness with L. monocytogenes isolated • From a normally sterile site
• In a resident of Winston-Salem, North Carolina
• With onset between October 24, 2000 and January 4, 2001
Source: MacDonald P, Boggs J, Whitwam R, Beatty M, Hunter S, MacCormack N, et al. Listeria-associated birth complications linked with homemade Mexican-style cheese, North Carolina, October 2000 [abstract]. 50th Annual Epidemic Intelligence Service Conference; 2001 Apr 23-27; Atlanta, GA.
Many case definitions, such as that shown for listeriosis, require laboratory confirmation. This is not always necessary, however; in fact, some diseases have no distinctive laboratory findings.
Kawasaki Syndrome — Case Definition
Clinical description
A febrile illness of greater than or equal to 5 days’ duration, with at least four of the five following physical findings and no other more reasonable
explanation for the observed clinical findings: • Bilateral conjunctival injection
• Oral changes (erythema of lips or oropharynx, strawberry tongue, or fissuring of the lips)
• Peripheral extremity changes (edema, erythema, or generalized or periungual desquamation)
• Rash
• Cervical lymphadenopathy (at least one lymph node greater than or equal to 1.5 cm in diameter)
Laboratory criteria for diagnosis
None
Case classification
Confirmed: a case that meets the clinical case definition
Comment: If fever disappears after intravenous gamma globulin therapy is started, fever may be of less than 5 days’ duration, and the clinical case definition may still be met.
Source: Centers for Disease Control and Prevention. Case definitions for infectious conditions under public health surveillance. MMWR
Recommendations and Reports 1990:39(RR-13):18.
Criteria in case definitions
A case definition may have several sets of criteria, depending on how certain the diagnosis is. For example, during an investigation of a possible case or outbreak of measles, a person with a fever and rash might be classified as having a suspected, probable, or
A case might be classified as suspected or probable while waiting for the laboratory results to become available. Once the laboratory provides the report, the case can be reclassified as either confirmed or “not a case,” depending on the laboratory results. In the midst of a large outbreak of a disease caused by a known agent, some cases may be permanently classified as suspected or probable because officials may feel that running laboratory tests on every patient with a consistent clinical picture and a history of exposure (e.g., chickenpox) is unnecessary and even wasteful. Case definitions should not rely on laboratory culture results alone, since organisms are sometimes present without causing disease.
Measles (Rubeola) — 1996 Case Definition
Clinical description
An illness characterized by all the following:
• A generalized rash lasting greater than or equal to 3 days
• A temperature greater than or equal to 101.0°F (greater than or equal to 38.3°C)
• Cough, coryza, or conjunctivitis
Laboratory criteria for diagnosis
• Positive serologic test for measles immunoglobulin M antibody, or
• Significant rise in measles antibody level by any standard serologic assay, or • Isolation of measles virus from a clinical specimen
Case classification
Suspected: Any febrile illness accompanied by rash
Probable: A case that meets the clinical case definition, has noncontributory or no serologic or virologic testing, and is not epidemiologically linked to a confirmed case
Confirmed: A case that is laboratory confirmed or that meets the clinical case definition and is epidemiologically linked to a confirmed case. (A laboratory-confirmed case does not need to meet the clinical case definition.)
Comment: Confirmed cases should be reported to National Notifiable Diseases Surveillance System. An imported case has its source outside the country or state. Rash onset occurs within 18 days after entering the jurisdiction, and illness cannot be linked to local transmission. Imported cases should be classified as:
• International. A case that is imported from another country
• Out-of-State. A case that is imported from another state in the United States. The possibility that a patient was exposed within his or her state of residence should be excluded; therefore, the patient either must have been out of state continuously for the entire period of possible exposure (at least 7-18 days before onset of rash) or have had one of the following types of exposure while out of state: a) face-to-face contact with a person who had either a probable or confirmed case or b) attendance in the same institution as a person who had a case of measles (e.g., in a school, classroom, or day care center). An indigenous case is defined as a case of measles that is not imported. Cases that are linked to imported cases should be classified as indigenous if the exposure to the imported case occurred in the reporting state. Any case that cannot be proved to be imported should be classified as indigenous.
Modifying case definitions
Case definitions can also change over time as more information is obtained. The first case definition for SARS, based on clinical symptoms and either contact with a case or travel to an area with SARS transmission, was published in CDC’s Morbidity and Mortality Weekly Report (MMWR) on March 21, 2003 (see box below).27 Two weeks later it was modified slightly. On March 29,
after a novel coronavirus was determined to be the causative agent, an interim surveillance case definition was published that included laboratory criteria for evidence of infection with the
SARS-associated coronavirus. By June, the case definition had changed several more times. In anticipation of a new wave of cases in 2004, a revised and much more complex case definition was published in December 2003.28
CDC Preliminary Case Definition for Severe Acute Respiratory Syndrome (SARS) — March 21, 2003
Suspected case
Respiratory illness of unknown etiology with onset since February 1, 2003, and the following criteria:
• Documented temperature > 100.4°F (>38.0°C)
• One or more symptoms with respiratory illness (e.g., cough, shortness of breath, difficulty breathing, or radiographic findings of pneumonia or acute respiratory distress syndrome)
• Close contact* within 10 days of onset of symptoms with a person under investigation for or suspected of having SARS or travel within 10 days of onset of symptoms to an area with documented transmission of SARS as defined by the World Health Organization (WHO)
* Defined as having cared for, having lived with, or having had direct contact with respiratory secretions and/or body fluids of a person suspected of having SARS.
Source: Centers for Disease Control and Prevention. Outbreak of severe acute respiratory syndrome–worldwide, 2003. MMWR 2003:52:226–8.
Variation in case definitions
would include not only all cases of rubella, but also measles, chickenpox, and rashes due to other causes such as drug allergies. So while the advantage of a sensitive case definition is that it includes most or all of the true cases, the disadvantage is that it sometimes includes other illnesses as well.
On the other hand, an investigator studying the causes of a disease outbreak usually wants to be certain that any person included in a study really had the disease. That investigator will prefer a specific or “strict” case definition. For instance, in an outbreak of
Exercise 1.4
Investigators of an outbreak of trichinosis used a case definition with the following categories:
Clinical Criteria
Confirmed case: Signs and symptoms plus laboratory confirmation
Probable case: Acute onset of at least three of the following four features: myalgia, fever, facial edema, or eosinophil count greater than 500/mm3 Possible case: Acute onset of two of the four features plus a physician diagnosis of
trichinosis
Suspect case: Unexplained eosinophilia
Not a case: Failure to fulfill the criteria for a confirmed, probable, possible, or suspect case
Time: Onset after October 1, 2006
Place: Metropolitan Atlanta
Person: Any
Using this case definition, assign the appropriate classification to each of the persons included in the line listing below. Use the highest rate classification possible. (All were residents of Atlanta with acute onset of symptoms in November.)
ID# Last Name Myalgias Fever Edema Facial Eosinophil Count Physician Diagnosis Confirmation Classification Laboratory
1 Anderson yes yes no 495 trichinosis yes
2 Buffington yes yes yes pending possible trichinosis pending
3 Callahan yes yes no 1,100 possible trichinosis pending
4 Doll yes yes no 2,050 EMS* pending
5 Ehrlich no yes no 600 trichinosis not done
*Eosinophilia-Myalgia Syndrome
Exercise 1.5
Consider the initial case definition for SARS presented on page 1-26. Explain how the case definition might address the purposes listed below.
1. Diagnosing and caring for individual patients
2. Tracking the occurrence of disease
3. Doing research to identify the cause of the disease
4. Deciding who should be quarantined (quarantine is the separation or restriction of
movement of persons who are not ill but are believed to have been exposed to infection, to prevent further transmission)
Using counts and rates
As noted, one of the basic tasks in public health is identifying and counting cases. These counts, usually derived from case reports submitted by health-care workers and laboratories to the health department, allow public health officials to determine the extent and patterns of disease occurrence by time, place, and person. They may also indicate clusters or outbreaks of disease in the community.
Counts are also valuable for health planning. For example, a health official might use counts (i.e., numbers) to plan how many
infection control isolation units or doses of vaccine may be needed.
Rate:
the number of cases divided by
the size of the population per unit of time
However, simple counts do not provide all the information a health department needs. For some purposes, the counts must be put into context, based on the population in which they arose. Rates are measures that relate the numbers of cases during a certain period of time (usually per year) to the size of the population in which they occurred. For example, 42,745 new cases of AIDS were reported in the United States in 2002.30 This number, divided by the
estimated 2002 population, results in a rate of 15.3 cases per 100,000 population. Rates are particularly useful for comparing the frequency of disease in different locations whose populations differ in size. For example, in 2003, Pennsylvania had over twelve times as many births (140,660) as its neighboring state, Delaware (11,264). However, Pennsylvania has nearly ten times the population of Delaware. So a more fair way to compare is to calculate rates. In fact, the birth rate was greater in Delaware (13.8 per 1,000 women aged 15–44 years) than in Pennsylvania (11.4 per 1,000 women aged 15–44 years).31
Descriptive Epidemiology
As noted earlier, every novice newspaper reporter is taught that a story is incomplete if it does not describe the what, who, where, when, and why/how of a situation, whether it be a space shuttle launch or a house fire. Epidemiologists strive for similar comprehensiveness in characterizing an epidemiologic event, whether it be a pandemic of influenza or a local increase in all-terrain vehicle crashes. However, epidemiologists tend to use synonyms for the five W’s listed above: case definition, person, place, time, and causes/risk factors/modes of transmission. Descriptive epidemiology covers time, place, and person.
Compiling and analyzing data by time, place, and person is desirable for several reasons.
The 5W’s of descriptive epidemiology:
What = health issue of concern
Who = person Where = place When = time
Why/how = causes, risk factors, modes of transmission
• First, by looking at the data carefully, the epidemiologist
becomes very familiar with the data. He or she can see what the data can or cannot reveal based on the variables
available, its limitations (for example, the number of records with missing information for each important variable), and its eccentricities (for example, all cases range in age from 2 months to 6 years, plus one 17-year-old.).
• Second, the epidemiologist learns the extent and pattern of
the public health problem being investigated — which months, which neighborhoods, and which groups of people have the most and least cases.
• Third, the epidemiologist creates a detailed description of
the health of a population that can be easily communicated with tables, graphs, and maps.
• Fourth, the epidemiologist can identify areas or groups
within the population that have high rates of disease. This information in turn provides important clues to the causes of the disease, and these clues can be turned into testable hypotheses.
Time
implement control and prevention measures, such as an influenza vaccination campaign or mosquito spraying. For diseases that occur sporadically, investigators can conduct studies to identify the causes and modes of spread, and then develop appropriately
targeted actions to control or prevent further occurrence of the disease.
In either situation, displaying the patterns of disease occurrence by time is critical for monitoring disease occurrence in the community and for assessing whether the public health interventions made a difference.
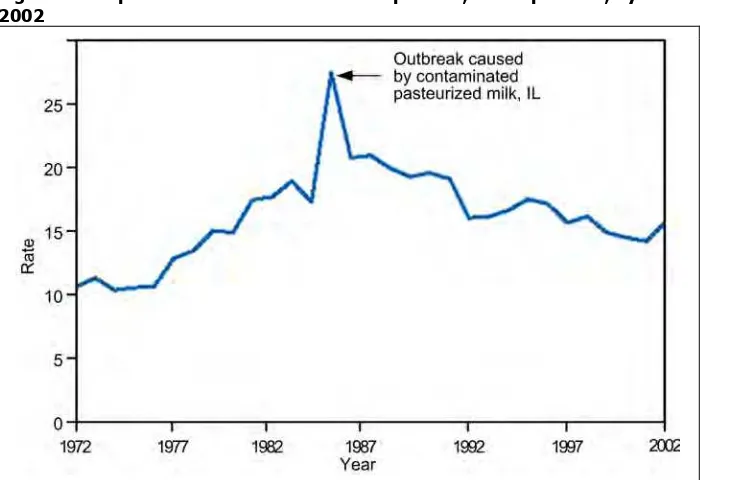
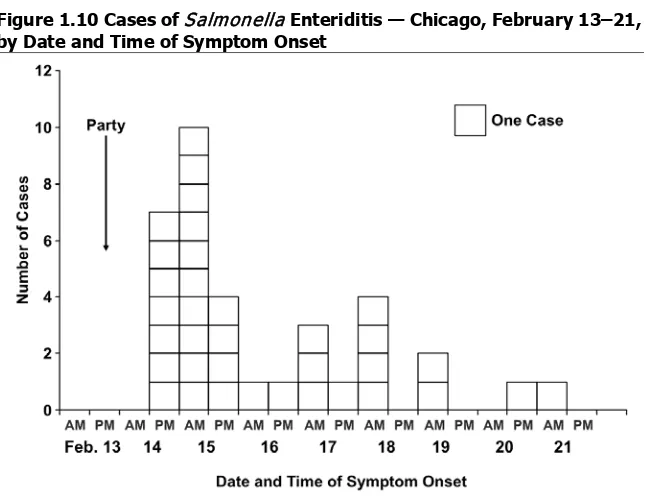
Time data are usually displayed with a two-dimensional graph. The vertical or y-axis usually shows the number or rate of cases; the horizontal or x-axis shows the time periods such as years, months, or days. The number or rate of cases is plotted over time. Graphs of disease occurrence over time are usually plotted as line graphs (Figure 1.4) or histograms (Figure 1.5).
Figure 1.4 Reported Cases of Salmonellosis per 100,000 Population, by Year — United States, 1972– 2002
Figure 1.5 Number of Intussusception Reports After the Rhesus Rotavirus Vaccine-tetravalent (RRV-TV) by Vaccination Date—United States, September 1998–December 1999
Source: Zhou W, Pool V, Iskander JK, English-Bullard R, Ball R, Wise RP, et al. In: Surveillance Summaries, January 24, 2003. MMWR 2003;52(No. SS-1):1–26.
Sometimes a graph shows the timing of events that are related to