1
Chapte
r
3
Chapter 3
Appendix B
Expression of Objective Function
• The objective function often is expressed in units of
currency (e.g., U.S. dollars) because the goal of the
enterprise is to minimize costs or maximize profits subject to a variety of constraints.
• In other cases the problem to be solved is the maximization
of the yield of a component in a reactor, or minimization of the use of utilities in a heat exchanger network, or
minimization of the volume of a packed column, or
minimizing the differences between a model and some data, and so on.
• Functions that are more complex or more nonlinear are
more difficult to solve in optimization.
– Modern optimization software has improved
2
Chapte
r
Economic Objective Functions
• Key skills that may be valuable
– The concepts of cost analysis, profitability analysis, budgets, income-and-expense statements, and balance sheets
• Two major components of economic objective
functions: capital costs and operating costs
3
Chapte
r
4
5
6
7
Chapte
r
3
erroneous assumptions
(1) dished ends (not flat)
Ae = 2(1.16 D2) = 2.32 D2
(2) thickness is a function of D (not constant)
(3) fabrication costs
$ ends > $ sides
(1.5x)
2
0
0
3.48
fab cost of sides ($/lb.) t thickness
density
(corrosion allowance) 11700 2 250
250
.125 0.0108 0.125
C S DLt S D t
S
PD
t t psi
P psi
t inch t D
9
Chapte
r
3
capacity
pressure psi
gal
100
250
400
2500
1.7
2.4
2.9
25000
2.2
2.9
4.3
1
0
L
D
10
11
The Time Value of Money in
Objective Functions
• The economic analysis of projects that incur income
and expense over time should include the concept of the time value of money.
• This concept means that a unit of money (dollar, yen,
euro, etc.) on hand now is worth more than the same unit of money in the future.
• Sometimes using a calculator or computer without
much thought.
• To understand the underlying assumptions and
concepts behind the calculations, however, you need to account for cash flows in and out using the
investment time line diagram for a project.
12
Chapte
r
13
14 .05
.004167 12
i
Chapte
r
15
16
17
18
19
20
21
22
23
24
25
Insulation example -- fixed vs. operating costs (Fi)
annualization factor (repayment multiplier)
26
Chapte
r
3
There are several disadvantages to using IRR
in optimization (requires iterative solution).
NPV can be shown to be equivalent to using
an annualization factor (series present worth
factor).
27
28
Chapte
r
3
2 0
0
0 0
2 0 $
(steam generated)
area ($25/ft )
/ vs.
(1 ) 1
. /
(1 )
( , , , )
n
n
opt
p
F
yr
I
ROI F I
i
NPV F I F r I
i i
T w r c U
29
30
Chapte
r
3
In the previous section we only briefly mentioned the financial assumptions used in profitability analysis. Any detailed analysis of a project requires specifying the following parameters:
(1)initial investment (2)future cash flows (3)salvage value (4)economic life (5)depreciation (6)depletion
(7)investment tax credit (8)taxes
(9)inflation
31
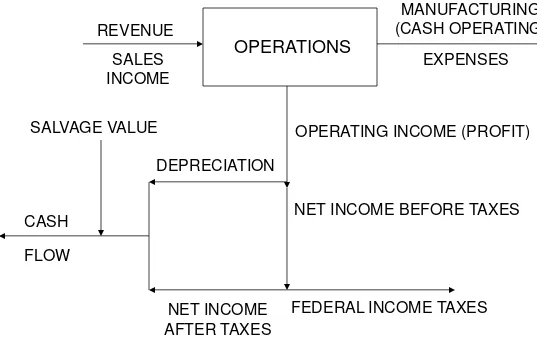
REVENUE
OPERATIONS
SALES INCOME
MANUFACTURING (CASH OPERATING)
EXPENSES
OPERATING INCOME (PROFIT)
NET INCOME BEFORE TAXES
FEDERAL INCOME TAXES NET INCOME
AFTER TAXES CASH
FLOW
SALVAGE VALUE
DEPRECIATION
Figure 3.3 Computation of Cash Flow
Chapte
r
32
33
34
35
36
37
38
39
40
Insulation Thickness
x (cm)
Insulation Cost
($)
Value of fuel
saved ($/year)
Payback period (years)
Return on investment
(% per year)
Net Present
value ($)
Internal rate of return
(%)
1 2,135 5,281 1.27 79 16,013 247
2 4,270 8,182 1.64 61 23,847 191
3 6,405 10,020 2.01 50 28,028 155
4 8,540 11,288 2.38 42 30,250 130
5 10,675 12,215 2.75 36 31,301 112
6 12,810 12,984 3.10 32 31,809 98
7 14,945 13,480 3.48 29 31,378 86
A summary of the calculations is