Multivariate chemometric analysis of the fluorescence
spectra of eucalyptus wood
Evaggeli Billa
a,*, Adamantia Pastou
a, Bernard Monties
b, Javier Romero
c,
Emmanuel G. Koukios
aaBioresource Technology Unit,Department of Chemical Engineering,National Technical Uni6ersity of Athens,Zografou Campus, GR-15700,Athens,Greece
bLaboratoire de Chimie Biologique,Institut National de la Recherche Agronomique(INRA),78850,Thi6er6al-Grignon,France cEmpresa Nacional de Cellulosa S.A.(ENCE),36157,Ponte6edra,Spain
Accepted 8 October 1999
Abstract
In this paper, multivariate chemometric analysis of fluorescence spectra of juvenile and mature eucalyptus wood samples is used in order to investigate the existence of any correlation between fluorescence data and, the physical/chemical properties, as well as the pulping data of eucalyptus wood. The results obtained demonstrated that the wood of juvenile and adult trees could be discriminated by fluorescence spectroscopy. Data analysis also has shown the existence of good statistical correlation between fluorescence data on the one hand, and ash content, sodium hydroxide solubility, and lignin monomeric composition of the wood samples on the other hand. Moreover, fluorescence spectral data were found to be well correlated with the pulping yield and the Kappa number of the kraft pulps issued from the adult and juvenile eucalyptus wood. © 2000 Elsevier Science B.V. All rights reserved.
Keywords:Chemometric analysis; Eucalyptus wood; Adult trees
www.elsevier.com/locate/indcrop
1. Introduction
The use of fluorescence spectroscopy as an ana-lytical method offers several inherent advantages, including high sensitivity, specificity, rapidity, and low cost; these combined with its non-destructive character, make it a very attractive analytical
approach for various chemical and biochemical applications (Jensen et al., 1982; Bro et al., 1997). Although lignocellulosics do exhibit autofluores-cence, fluorescence spectroscopy has not so far been an established method in this field. This is mainly due to the structural heterogeneity and chemical complexity of lignocellulosics, contain-ing many fluorophores that make the interpreta-tion of fluorescence data equivocal (Olmstad and Gray, 1993; Castellan et al., 1994). In particular, the classic approach consisting of finding a pair of excitation-emission wavelengths, where the
ana-* Corresponding author. Tel.:+30-1-7723287; fax: + 30-1-7723163.
E-mail address:[email protected] (E. Billa)
lyte of interest is the only component giving rise to the recorded signal, is not appropriate for the study of lignocellulosics (Guilbault, 1990). More-over, although the use of fluorescence seems to hold distinct advantages for process analysis and optimisation, is not widespread in this partic-ular field (Reibe and Eustace, 1990; Beebe et al., 1993).
Furthermore, chemometrics, i.e. the application of mathematical and statistical methods in order to extract reliable and relevant information from chemical data, can be applied towards arriving at tangible information from complex analytical data (Miller, 1995). Until now, chemometrics-based methods have not been largely applied in the field of lignocellulosics. We can e.g. mention the work of Shimleck et al. (1997), who deter-mined the kraft pulp yield and carbohydrate con-tent of wood using NIR in conjuction with a PLS technique. Principal Component Analysis (PCA) of 13CC-CP/MAS-NMR-spectra has also been employed for the estimation of cellulose I and II in cellulosic samples (Lennholm and Iversen, 1995).
In this paper, multivariate chemometric analy-sis of fluorescence spectra of juvenile and mature eucalyptus wood is used in order to investigate the existence of any statistically adequate correlation between fluorescence data, and the physical/ chem-ical properties, as well as the pulping data of mature and juvenile eucalyptus wood samples.
It is known that the stage of the plant develop-ment influences its physical/chemical properties, which then play a decisive role on their pulping characteristics and the other technical properties of the pulp and paper produced. Consequently, the age of wood harvesting is an important factor for defining paper pulp quality. This information could be of great interest, among other things, for the selection of criteria for the improvement of wood species.
2. Materials and methods
Samples of Eucalyptus globulus wood corre-sponding to mature and juvenile (second year) shoots were compared. Their following physical
and chemical properties were determined: lignin content, lignin monomeric structure, ash content, solubility in 1% (w/v) sodium hydroxide. Lignin content was determined by the Klason method (TAPPI, 1983a). The extraction was performed with hot sodium hydroxide solution 1% (w/v) for 1 h (TAPPI, 1983b). The monomeric lignin units engaged in b-O-4 bonds were determined by thioacidolysis (Lapierre, 1993).
The wood samples were submitted to kraft cooking (NaOH – Na2S), and the total yields as well as the Kappa number of the pulps were determined (Berjings, 1966).
2.1. Fluorescence data
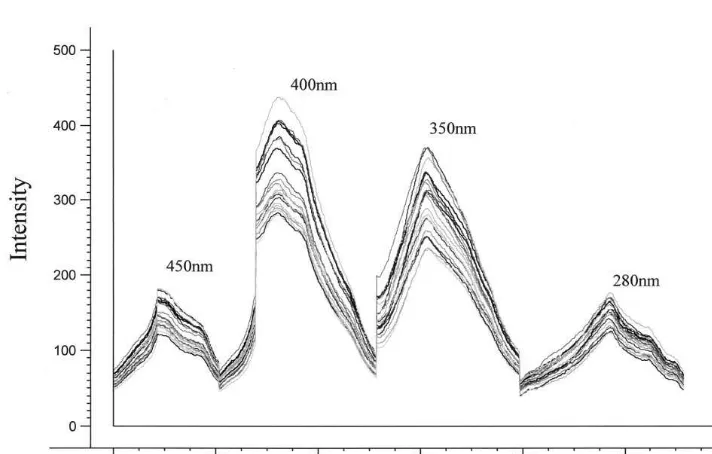
Solid wood samples were ground in order to obtain a homogeneous powder surface. Fluores-cence spectra were recorded twice for each sample employing a Perkin Elmer LS 50B Luminescence Spectrometer connected to a PC. The Perkin Elmer LS50B Instrument Program (version 5.0) is used for instrument control. Emission spectra were recorded at excitation wavelengths of 450, 400, 350 and 280 nm, whereas the emission is measured in the region of 275 – 650 nm with inter-vals of 0.5 nm (in total, 751 data points). The excitation wavelengths were chosen by visual in-spection of emission spectra at excitation wave-lengths in the range of 230 – 500 nm, recorded with a 10 nm step. For this purpose, an OBEY program was written in Obey Macro Language (Perkin Elmer, 1994). All measurements were per-formed at 2491°C. Excitation and emission monochromator slit widths were 3 nm, and a mirror absorbing 99% of the emitting radiation was used. The measurement starts at the highest and finishes at the lowest excitation wavelength, in order to minimise photodecomposition of the sample.
Spectral data were converted to ascii files by a computer program provided by Perkin Elmer (FL Data Manager, version 3.50).
2.2. Principal component analysis
goal is to represent the variation present in many variables using a small number of ‘factors’. A new row space is constructed in which to plot the samples, by redefining the axes using factors than the original measurement variables. These new axes are called principal components (PCs), allow the analyst to probe matrices with many variables and view the true multivariate nature of the data in a relatively small number of dimensions. With this view, human pattern recognition can be used to identify structures in the data (Beebe et al., 1998).
The first PC explains the maximum amount of variation possible within the data set in one direc-tion. The coordinates of the sample in a coordi-nate system defined by the Principal Components are called scores. The loading vectors are the bridge between the variable space and the PC space. The loadings tell us how much each vari-able contributes to each PC.
In matrix form:X=TP, whereX: the analysed data matrix; T is the score matrix, and P is the loading matrix. Only a significant number of PCs are relavant in describing the information in X. This leads to the following decomposition: X= TfPf+E, whereTfis the score matrix with dimen-sions sxf,Pfis the loading matrix with dimensions wxf and E is a residual matrix with the same dimensions as X (Esbensen et al., 1994). In this particular case, Tcontains information about the samples, and P contains information about the wavelengths.
2.3. Partial least square regression (PLS).
PLS is used in order to make a model correlat-ing X and y, where X contains the fluorescence spectra and y (s×1) is a vector containing the property of interest. The model performance is validated by cross validation due to our small data set. Multivariate calibration models were built correlating the fluorescence emission spectra, and physical as well as chemical properties of the samples.
PCA and PLS regressions were performed with the use of the UNSCRAMBLER program (ver-sion 6.0, Camo AS, Norway). The model perfor-mance is validated by cross validation due to our
small data set (Noergaard, 1995). The pre-dictive performances of the PLS models are as-sessed by RMSEP (root mean square error of prediction) criterion and Pearson’s correlation co-efficient R:
RMSEP=
'
%N
i=1
(Yipredicted−Yimeasured)2/N
where Nis the number of samples.
Schematically the procedure could be summa-rized as following:
Emission fluorescence spectra recorded at four excitation wavelenghtstranformation to ascii filesintroduction to UNSCRAMBLER pro-gram (each spectrum is represented by 751 points)put the four emission spectra sequen-tially resulting rows of 4×751=3004 points
creation of a X matrix for the 20 samples with dimension 20×3004removal of the common peaksthe analysed matrix becomes 20× 1115application of PCAconstruction of PLS models with the introduction of Yi matrices with dimensions 20×1 with data of different properties.
3. Results and discussion
ma-Fig. 1. Emission spectra of the eucalyptus wood samples as introduced to the UNSCRAMBLER program. Emission variables 1 – 751 correspond to lex=450 nm; variables 752 – 1502 correspond to lex=400 nm; variables 1503 – 2253 correspond tolex=350 nm; variables 2254 – 3004 correspond tolex=280 nm.
Fig. 3. A PCA 3-dimensional score plot of the samples. 1 – 10 different clones of eucalyptus; N: juvenile wood; A: mature wood; 1or 2 (in the third position) independent measurements of the same wood.
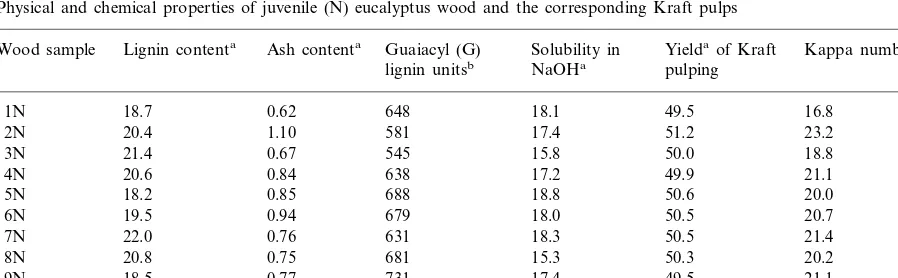
Table 1
Physical and chemical properties of juvenile (N) eucalyptus wood and the corresponding Kraft pulps Ash contenta Guaiacyl (G)
Wood sample Lignin contenta Solubility in Yieldaof Kraft Kappa number
pulping lignin unitsb NaOHa
1N 18.7 0.62 648 18.1 49.5 16.8
1.10 581 17.4
20.4 51.2
2N 23.2
0.67 545 15.8
3N 21.4 50.0 18.8
0.84 638 17.2
20.6 49.9
4N 21.1
0.85 688 18.8 50.6 20.0
5N 18.2
0.94 679 18.0
19.5 50.5
6N 20.7
22.0
7N 0.76 631 18.3 50.5 21.4
20.8
8N 0.75 681 15.3 50.3 20.2
0.77 731 17.4
18.5 49.5
9N 21.1
10N 21.0 0.77 696 20.9 48.8 27.3
aResults expressed in % on dry basis. bResults expressed inmmol/g of lignin.
trix. We have observed that the fluorescence emis-sion intensity is higher for excitation at 400 and 350 nm, as compared to 280 and 450 nm.
A PCA applied to the data in Fig. 2 with the use of UNSCRAMBLER software, has provided three vectors (PCs), which can explain the 99% of the total variance. Score plots of the data of the 20 samples and their duplicate measurements with respect to the three identified Principal Compo
pointing to the predictive potential of PCA, since it qualitatively corroborates with earlier data; ac-cording to the latter, pulps from different biologi-cal sources could be discriminated using PCA of their fluorescence spectra (Billa et al., 1999a).
In an effort to add further information to the correlation, quantitative data such as the ash
con-tent and the sodium hydroxide solubility of the samples (Tables 1 and 2) were introduced into the program. PLS models were mathematically con-structed aiming at correlating fluorescence spec-tral data (X: 20×1115) with ash content and sodium hydroxide solubility (Yi: 20×1). Fig. 4 presents the predicted versus measured values plot
Table 2
Physical and chemical properties of adult (A) eucalyptus wood and the corresponding Kraft pulps Guaiacyl (G)
Lignin contenta Solubility in Yieldaof Kraft
Wood sample Ash contenta Kappa number
NaOHa
lignin unitsb pulping
0.24 498
1A 18.6 11.7 57.7 14.4
15.5 55.4
12.6 515
2A 21.7 0.27
3A 21.1 0.25 515 10.9 56.7 13.6
4A 21.9 0.25 548 12.3 56.0 14.4
56.8 10.3
598 13.5
0.35 18.1
5A
6A 20.1 0.29 510 10.6 58.0 14.9
17.6 55.6
0.26 621 11.4
7A 21.3
8A 19.3 0.24 516 11.1 57.2 13.8
9A 20.1 0.27 496 11.0 56.3 13.5
0.22 560 11.4
10A 21.2 55.9 14.6
aResults expressed in % on dry basis. bResults expressed inmmol/g of lignin.
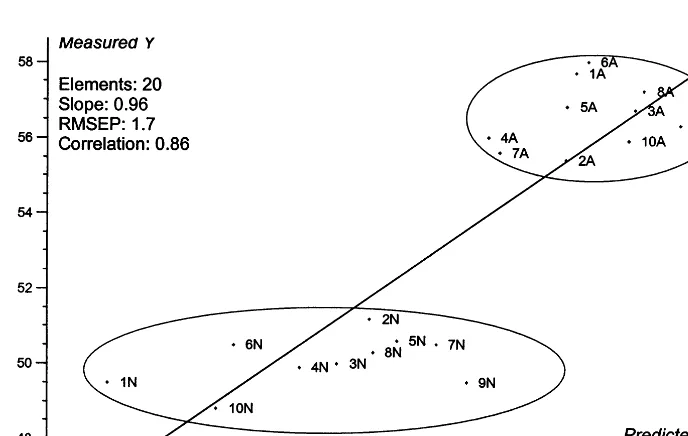
Fig. 5. Predicted versus measured plot for the sodium hydroxide solubility with reference to the third PC. PLS modelling.
for the ash content. The Pearson correlation co-efficient is 0.7. The ash content is higher for the juvenile samples, which also present higher inter-clonal variability. The sodium hydroxide solubil-ity of the eucalyptus wood is higher for the young shoots with also larger interclonal variability (R=0.87) (Fig. 5). Hot alkali solution extracts low-molecular weight carbohydrates, consisting mainly of hemicellulose and degraded cellulose. This is in accordance with previous studies that have shown that young tissues are more fragile and soluble compared to older ones (Hatton and Hunt, 1993).
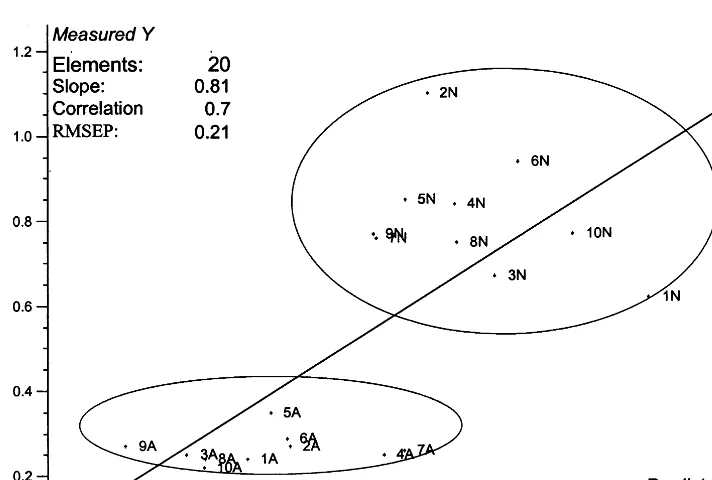
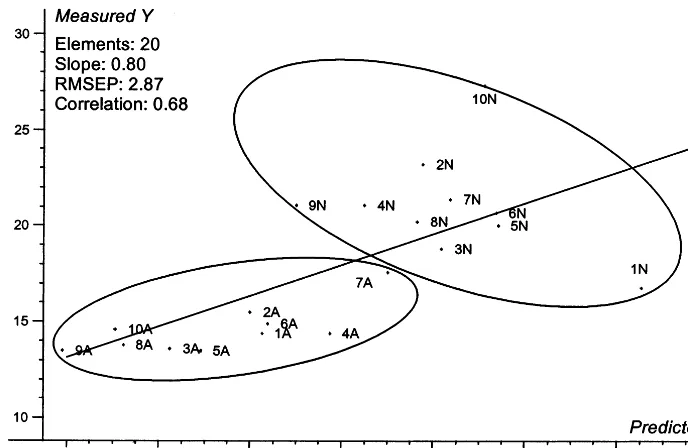
We then examined whether fluorescence spec-troscopic information derived from the wood samples could be correlated with structural infor-mation of lignins obtained by thioacidolysis (Ta-bles 1 and 2). The thioacidolysis provides quantitative data on the guaiacyl (G) and syringyl (S) lignin monomeric units engaged in b-O-4 bonds (Lapierre, 1993). The data for the lignin monomeric composition shown in Fig. 6,
indi-cated that the lignins from juvenile trees are en-riched in G units. Moreover, the S/G ratio varies from 3.4 to 5.1 (results not shown), being higher for the adult trees indicating that they are en-riched in S units, in accordance with the studies on lignification of Terashima et al. (1993). The above results corroborate previous data, where fluorescence spectroscopy information of residual kraft lignins was correlated with structural infor-mation emerging from quantitative 31
P NMR spectroscopy (Billa et al., 1999b).
4. Conclusions
The results obtained demonstrated that the wood of juvenile and adult trees could be
discrim-inated by fluorescence spectroscopy. Moreover, with the help of the multivariate chemometric analysis of the fluorescence spectra of juvenile and mature eucalyptus wood, we have shown the
exis-Fig. 6. Predicted versus measured plot for the content in guaiacyl (G) lignin monomeric units with reference to the third PC. PLS modelling.
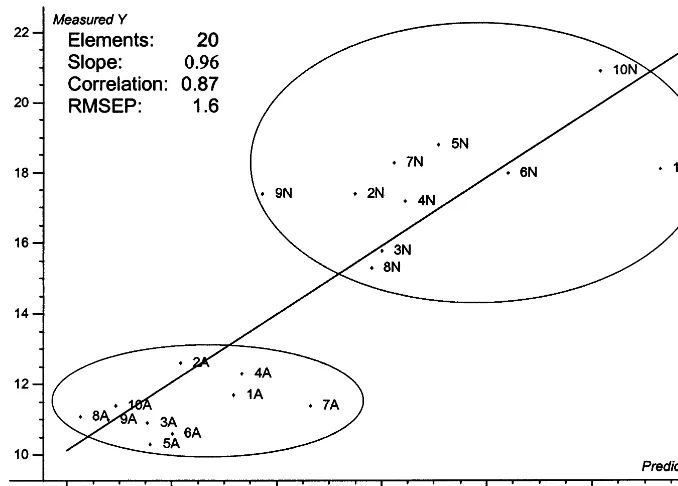
Fig. 8. Predicted versus measured plot for the Kappa number of the different eucalyptus kraft pulps with reference to the third PC. PLS modelling.
tence of good statistical correlations between fluorescence data and their physical/chemical properties, such as ash content, sodium hydroxide solubility, lignin monomeric composition. Finally, the fluorescence emission spectral data were well correlated with the pulping yield and the kappa number of the kraft pulps issued from the adult and juvenile eucalyptus wood. These results demonstrate the interest of fluorescence as an analytical tool for process analysis and optimisa-tion in the pulp and paper industry.
Acknowledgements
This work was financed by the European Com-mission through the OPLIGE (ECLAIR Pro-gramme, contract AGRE-0021-C) and AFFLUENCE (AIR programme, contract AIR2-CT94-1416) projects.
References
Beebe, K.R., Blaser, W.W., Bredeweg, R.A., et al., 1993. Anal. Chem. 65, 199R.
Beebe, K.R., Pell, R.J., Seasholtz, M.B., 1998. Chemometrics, A Practical Guide. John Wiley and Sons, New York, pp. 81 – 112.
Berjings, V., 1966. Pulp Paper Mag. Can. March, 206. Billa, E., Koutsoula, E., Koukios, E.G., 1999a. Biores.
Tech-nol. 67, 25 – 33.
Billa, E., Argyropoulos, D.S., Koukios, E.G., 1999b. In: Argy-ropoulos, D.S. (Ed.), Progress in Lignocellulosics Charac-terization. Tappi Press, Atlanta, USA, pp. 131 – 144. Bro, R., Workaman, J.J.J.R., Mobley, P.R., Kowalski, B.R.,
1997. Appl. Spectrosc. Rev. 32 (3), 237 – 261.
Castellan, A., Choudhury, H., Davidson, R.S., Grelier, S., 1994. J. Photochem. Photobiol. A: Chem. 81, 117. Esbensen, K., Schonkopf, S., Midtgaard, T., 1994.
Multivari-ate Analysis in Practice. Camo AS editions, Norway. Guilbault, G.G., 1990. In: Munck, L. (Ed.), Fluorescence
Analysis in Foods. Longman Scientific and Technical, UK, pp. 33 – 58.
Hatton, J.V., Hunt, K., 1993. Cellulose Chem. Technol. 27, 17.
Jensen, S.A., Munck, L., Martens, H., 1982. Cereal Chem. 59 (6), 477.
Lapierre, C., 1993. In: Jung, H.G., Buxton, D.R., Hartfield, R.D., Ralph, J. (Eds.), Forage Cell Wall Structure and Digestibility. ASA-CSSA-SSSA, pp. 133 – 166.
Lennholm, H., Iversen, T., 1995. Holzforschung 49, 119 – 126. Miller, C.E., 1995. Chemom. Intell. Lab. Syst. 30, 11 – 12. Noergaard, L., 1995. Talanta 42, 1305.
Olmstad, J.A., Gray, D.J., 1993. J. Photochem. Photobiol. A: Chem. 73, 59.
Reibe, M.T., Eustace, D.J., 1990. Anal. Chem. 62, 65A. Shimleck, L., Wright, P., Michell, A., Wallis, A., 1997. Appita
J. 50 (1), 40 – 46.
Terashima, N., Fukushima, K., He, L.-F., Takabe, K., 1993. In: Jung, H.G., Buxton, D.R., Hartfield, R.D., Ralph, J. (Eds.), Forage Cell Wall Structure and Digestibility. ASA-CSSA-SSSA, pp. 247 – 270.
TAPPI (Technical Association of the Pulp and Paper Indus-try), 1983a. Acid-insoluble lignin in wood and pulp. Offi-cial Test Method T-222 om-8, Atlanta.
TAPPI (Technical Association of the Pulp and Paper Indus-try), 1983b. One percent sodium hydroxide solubility of wood and pulp. Official Test Method T-212 om-88, At-lanta.