Guido Bugmann
a,*, Raju S. Bapi
baCentre for Neural and Adapti
6e Systems,Uni6ersity of Plymouth,Plymouth PL4 8AA,UK bDepartment of Computer & Information Science,Uni
6ersity of Hyderabad,Gachibowli,Hyderabad, 500 046Andhra Pradesh, India
Abstract
Relative recency discrimination (RD) task is typically used to assess the temporal organization function of the prefrontal cortex (PFC). Subjects look at a series of cards (with words or drawings on them) and on seeing a test card determine which of the two items was seen more recently. Results show that patients with damage to the prefrontal cortex are severely impaired on this task. We propose a memory trace-priming mechanism, based on automatic time-marking process hypothesis (Schacter, D.L., 1987. Memory, amnesia, and frontal lobe dysfunction: a critique and interpretation. Psychobiology 15, 21 – 36), to offer a computational account of the results. In this model, successive words seen by subjects leave decaying memory traces in PFC, which subsequently prime the representations in higher sensory areas such as inferior temporal Cortex (IT) during discrimination judgements. The paper focuses on the evaluation of a probabilistic pre-frontal trace mechanism using a pool of clusters of neurons with self-sustained firing that ends at a random time. The results show that the probabilistic behavior of subjects can be accounted for by the stochasticity of the trace model. A good fit to experimental data is obtained with a PFC memory persistence probability with a decay time constant oft=30 s. The model allows for a distributed representation in IT and PFC, but the best fit suggests a sparse representation. It is concluded that further data are needed on representations in IT and PFC, on the connectivity between these two areas, and on the statistical and dynamic properties of memory neurons in PFC. © 2000 Elsevier Science Ireland Ltd. All rights reserved.
Keywords:Working memory; Short-term memory; Recency discrimination; Prefrontal cortex; Temporal trace; Retention time
1. Introduction
Prefrontal cortex is thought to participate in temporal organization of behavior (Fuster, 1989). Accordingly, many tests designed to assess the
integrity of prefrontal cortex measure perfor-mance on temporal order discrimination. For in-stance, a family of tasks involves recency discrimination (RD) wherein subjects have to de-termine which of two test objects was seen later in a sequential presentation. Many of the deficits observed were attributed to the fact that prefron-tal damage interferes with the ability to structure and segregate events in memory. In the absence of
* Corresponding author.
E-mail address: [email protected] (G. Bug-mann).
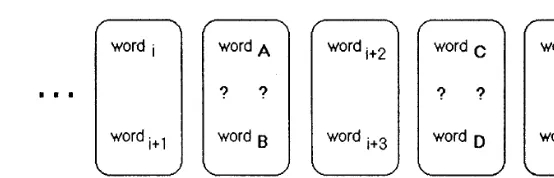
Fig. 1. Example of card sequence manipulated by subjects.Dis the average time separating the inspection of successive items.
contextual cues, prefrontal patients are seen to have difficulties assigning temporal salience to items that appear successively (see Milner et al., 1991 for a summary). In the literature, two major hypotheses have been proposed for this basic deficit of assigning time-stamp to events in work-ing memory (WM): (i) there is an effortless auto-matic time-marking process taking place at the time of encoding of events in WM which is dis-rupted due to damage to the prefrontal cortex and (ii) there are effortful encoding and retrieval pro-cesses that use active attention, rehearsal, and organization strategies that are disrupted in re-cency judgement tasks and that some of these processes depend on intact prefrontal cortex (see summary in Schwartz et al., 1991). A clean resolu-tion of the above hypotheses has not yet been made in an experimental paradigm. In the work reported here, we show that the effortless auto-matic time marking hypothesis can explain the results of two of the recency judgement experi-ments, using word items and representational drawings.
The main hypothesis of the model — that needs to be tested experimentally — is that work-ing memory units exhibit a stochastic retention pattern. It will be shown that simple hypotheses on the dynamics and connectivity of clusters of prefrontal neurons can explain behavioural data of an apparently complex task such as relative RD. This result gives support to the hypothesis of effortless automatic time-marking process (Schac-ter, 1987).
This paper is organised as follows. Relative RD experiments and their results are described in Section 2. Modelling behavioural data requires a model of how behaviour is generated. Our model is an extension of the model for top-down
selec-tive attention described by (Usher and Niebur, 1996). Details on this extended model are given in Section 3. The parameters of the model that pro-duce the best fit to the experimental data are given and discussed in Section 4. The conclusion follows in Section 5.
2. Recency discrimination experiments
In RD (Milner et al., 1991), subject is given a pack of cards each of which contains two items and is allowed to inspect each card for a few seconds and told to turn to the next one. Whenever a test card bearing a question mark appears in addition to the two items, subject has to point to the item seen more recently. Usually both items have been shown before (say, one of them eight items ago vs. another one 32). In some cases one of the objects has never been shown, hence the task becomes one of recognition mem-ory. Three such tests that use items from one of the three modalities (involving concrete words, representational drawings, or abstract drawings) are usually administered (Fig. 1).
16–128
4–32 0.7311
1/8 0.7209
8–128
1/16 0.7615 0.7716
1/32 4–128 0.8425 0.8966
aThe last two columns indicate the average performance on word recency and on drawing recency. These values have been
measured on Fig. 11 in Milner et al. (1991).
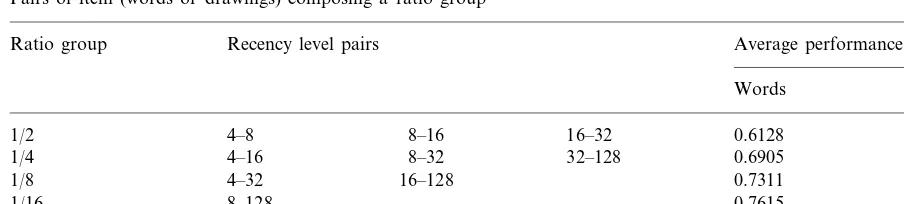
an item would be presented on the response card for the first time on the test and the subject has to recognise that the item has never been shown before and hence it is the most recent item. In contrast, 60 of the response cards that contain two previously seen items are arranged in five recency levels — 4, 8, 16, 32 and 128. A recency level of four implies that the item was seen 4 items ago before appearing on the response card as one of the test items. All ten possible groupings of recency levels such as — 4 versus 8, 4 versus 16, 4 versus 32, 4 versus 128, etc are used (see Table 1). The test is self-paced and subjects scanned 184 word cards in 15 min, resulting in an average
of 5 s for observing and manipulating each card, i.e. 2.5 s per word. With representational draw-ings the observation time was limited to 3 s per card (two images). Allowing for some time for manipulation, this corresponds probably to 2 s per drawing. Only recency judgement task for words and representational drawings is being modeled in the work presented here. Recognition tasks do probably involve the hippocampus and not pre-frontal cortex (Milner et al. (1991). Milner et al. (1991) did not provide performance versus interval ratio data for abstract drawings. Among the 137 subjects, only those 33 with left prefrontal lesions showed a significantly diminished average performance (59 – 62% correct responses) for con-crete word items. The average performance for all the other subjects ranged between 64 and 72%. For the test with representational drawings, only 13 subjects with right frontal lesions showed a significant impairment (59% average correct
re-sponse) compared to performances between 63 and 71% for the other subjects. Results of mean percent correct responses over all the 137 subjects (including frontal lesions) and over all the word recency levels corresponding to an interval ratio from Milner et al. (1991) are given in Table 1.
The results in Table 1, show that small interval ratios (i.e. large difference between the presenta-tion times of the two test items) favored correct discrimination. We explore here the hypothesis that the characteristic inverse relationship ob-served between performance and interval ratio could be due to an effect of memory decay on discrimination decisions rather than due to a more complex mechanism for directly encoding intervals, temporal order or sequences.
The proposed model has to meet three targets: (i) it needs to replicate the profile of average performance versus interval ratios (Table 1), (ii) it needs to reproduce the average normal perfor-mance of unimpaired subjects (words — 70%, drawings — 68%), and (iii) by appropriately dam-aging the memory process, the model needs to show impaired performance as seen in patients (words — 61%, drawings — 59%). Lesion model-ing will be discussed elsewhere.
3. Model
3.1. O6er6iew
3.1.1. Response mo6ement generation
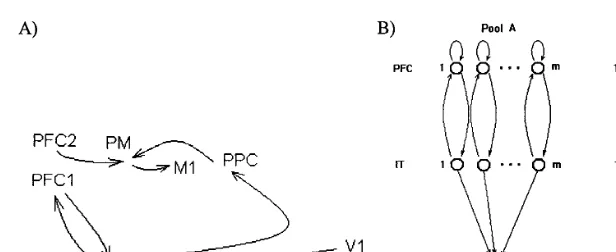
Fig. 2. (A) Response generating circuit. The link from PFC2 to PM carries a control signal, which enables responses during testing. The path from V1 to IT to PFC1 enables storing viewed patterns as temporary sustained firing. The path from PFC1 to IT to PPC via early common visual areas enables defining the position in space of the selected pattern, then selecting the appropriate response. The link from PPC to PM activates pre-motor neurones if enabled by a control signal from PFC2. Other control links are not shown. IT represents VA2 (Pandya and Barnes, 1987). PFC1 and PFC2 represent two prefrontal areas, possibly 46/9v and 10. PM represents supplementary and pre-motor areas such as FEF, SMA and PMd. M1 is the motor cortex (area 4). PPC represents a number cortical areas such as 5, 7, LIP known to contain action maps. (B) Model for priming by a pool of probabilistic all-or-none memory neurons. Memory nodes in PFC are maintained in an active state by probabilistic self-feedback connections, then decay at random times. These nodes are initially activated by neurons in IT representing the observed items. At test time, active memory nodes reinforce the firing of IT neurons. The PFC pool with the largest number of remaining active neurons determines the item selected for the response.
generation that realizes the task of the subject (Fig. 2A). For simplicity it is assumed that the firing of object selective cells in IT is mirrored by cells in posterior parietal cortex (PPC) coding for response actions directed towards the position of their respective objects (Fig. 2B). The biological circuit that realizes the transfer of activity from object selective IT cells to position-specific PPC cells is unknown. We will assume that object-specific neurons in IT with the strongest firing do eventually initiate a response towards the location of the corresponding object.
3.1.2. Trace in prefrontal cortex
There are neither physiological nor anatomical data specifying the neural circuits underlying the sustained activity in PFC nor systematic investiga-tions of the time course of the sustained activity at the neuronal level. It is known that (i) most PFC neurons show a constant firing rate during the delay period (Miller et al., 1996) and (ii) sustained firing does sometimes end prematurely (Funahashi et al., 1989). Beyond that, a number of assumptions need to be made, first in terms of modelling approach. In the standard ‘ensemble averaging’ approach, a decaying memory trace
would be modelled by a smoothly decaying func-tion of the time. A problem with this approach is the need to convert the analogue trace activity into a response selection probability in a biologi-cal plausible way. Therefore, in our approach, rather than attempting to hide the unreliability of neurones by ensemble averaging, the unreliability is exploited to explain behavioural response er-rors. Sustained firing is assumed here to arise within a cluster of neurones from recurrent con-nections with probabilistic synapses. These intro-duce noise in terms of the duration of the sustained firing, but firing stays at a constant level until it ends (see details in Section 3.2). The variable that decays with time is the probability to find a neurone in an active state, not the activity itself.
3.1.3. Representation
While the subject observes the two patterns on his card, focusing probably his attention on the one, then on the other1, the fixated pattern is
represented by a pattern of neural activity in areas
1We assume serial acquisition. The article by Milner et al.
tion has been observed in areas 46/9v and 10/11/
12. Neurones in area 10/11/12 neurones show sustained and phasic firing that is much more stimulus-specific than that in 46/9v, responding only to complex objects such as faces (Courtney et al., 1997). This parallels the increasing complexity of visual features represented along the ventral stream. Area 10 has also been shown to be in-volved in branching tasks where visual stimuli prompt the switching between subtasks (Koechlin et al., 1999).
Lesion studies suggest a crucial role for area 46/9v in representing the temporal order of stim-uli (Petrides, 1991; Milner et al., 1991). This area is fed by VA2 in which objects are represented by the activation of multiple disjoint groups of cells representing partial features of the object (Wang et al., 1998). We explore here the possibility that the memory of an object is represented by similar groups of WM cells in area 46¯9v (Fig. 2B). The number of such groups will be one of the free parameters in the data fitting procedure (Section 4).
3.2. Numerical model
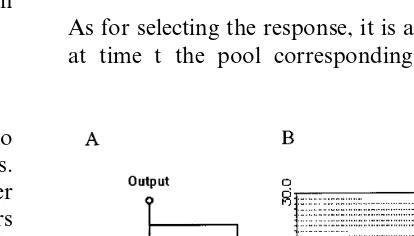
The patterns to be memorized are assumed to be coded in IT by a number m of sensory cells. Each of these cells activates its dedicated cluster of memory cells in PFC (Fig. 2B). These clusters have a probabilistic all-or-node behaviour, i.e. fire at a constant rate for a random time, then become silent (Fig. 3B). Such a firing pattern can theoret-ically be produced by a cluster of neurones with sustained firing mediated by probabilistic self-feedback connections (Bugmann and Taylor, 1993). These connections can sustain firing at a high rate until an abrupt stop, which occurs when, by virtue of the laws of probability, the feedback signal fails to be transmitted. In practice, simula-tions of clusters of leaky integrate-and-fire (LIF)
A working memory cluster in PFC is modelled here as an abstract unit that is activated by input from IT and stays active by virtue of a self-feed-back connection (Fig. 3A). The connection has a probability a to sustain the activity. In the sim-plest case, such a unit represents a spiking neu-rone with an autapse. Then a represents the probability that one spike of that neurone gener-ates another spike in the same neurone. Assuming that each feedback-and-fire cycles takes a timeDt, the probability to find the WM unit in active state after a time t=kDt is given by (Bugmann and Taylor, 1993):
pon(t)=at/Dt=exp(−t/t)
where t= −Dt/ln(a) (1)
Then the probability PA(n,t) that exactly n
clus-ters out of a pool A ofmare still active after time
t is:
PA(n,t)=Cnmexp− nt
t(1−exp −t
t)m−n (2)
As for selecting the response, it is assumed that, if at time t the pool corresponding to pattern A
Fig. 3. (A) Abstract model of a cluster of working memory neurons with self-sustaining feedback connections. A single connection is assumed here with a probabilityato reproduce
contains more active memory neurons that the pool corresponding to pattern B, then priming will lead to a response pointing to pattern A. The probability of a correct response is essentially the probability that the most recent pattern has the most active pool. However, in the case where both pools have the same number of active neurons (usually both will have no active neuron left), it is assumed that noise will lead to each response to be chosen by chance with equal probability2. The
probability P(a\b) that pattern A has more
active memories a than pattern B is:
P(a\b)= %
The probability that both pools have the same numbers a and b of active memories is:
P(a=b)= %
m
n=0
PB(n,t)PA(n,t) (4)
The probability Pc of a correct response is thus given by:
Pc=P(a\b)+0.5P(a=b) (5)
In order to reproduce the experimental data in Table 1, one needs to average the values of Pc
over all possible interval pairs forming a given ratio. For instance, P1/2 is calculated by:
P1/2=
Where Pc(4,8) indicates that pattern A is 4 items
old and pattern B is 8 items old. The equal weight (1/3) given to all cases reflects the assumption that an equal number of cases of each pair of intervals are tested in the experiments. This is not specified in the paper by (Milner et al., 1991). Until confir-mation from the authors can be obtained, this must be taken as an assumption of the model. It has two free parameters, the decay rate ? of the memories and the number m of memories in the pool.
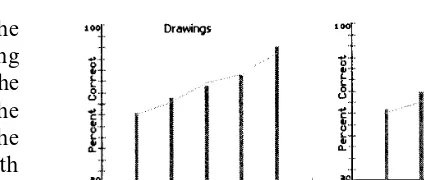
Fig. 4. Results: the columns represent the experimental data from Table 1. The lines joining the columns are best-fit values of the model.
4. Results and discussion
4.1. Recency data fitting
A least-squares error minimization procedure was used to find the best values of tand m. For each interval ratio, the probability of a correct response is calculated using Eqs. (5) and (6). For word data in Table 1, an excellent fit was ob-tained with t=30 s and m=1 (sum squared error=0.00169) (Fig. 4). With representational drawings data, the best fit gavet=27 s andm=1 (sum squared error=0.0011) (Fig. 4). The aver-age performances over all recency pairs were 68% for words and 69% for drawings. Overall, the good quality of the fit gives credit to the ‘auto-matic time-marking’ hypothesis for memory of temporal order.
4.2. Representation
A surprising aspect of the results is that the fitting process leads to a model of the task where a single node is used in IT and a single memory node is PFC (m=1). Recordings in these area always show many neurons involved in a given task and imaging data or EEG could not be produced if only a small number of neurons were involved3
. It should be noted however that the
3In optical imaging experiments by Wang et al. (1998)
visual stimulation had two effects in TE (border between VA2/VA3): a global activation of the whole area and addi-tional local activation of small clusters of stimulus specific neurons. It may be possible that brain imaging experiments detect only the non-specific global activation.
2As the priming signal is missing when both pools are
tion in IT and PFC will require more precise knowledge of the decay time course of biological WN units.
4.2.1. Limitations of the model
The model is designed for forced choice experi-ments such as the relative RD task modeled here or delayed matching to sample tasks (e.g. Fuster et al., 1981). In the latter case, WM decay time constants of the order of 50 seconds explain ex-perimental data in monkey (unpublished results). The model is also specific to temporal memory tasks involving PFC. Other retention experiments fall in different categories. For instance, novelty detection tasks also show temporal decay of reten-tion (Rubin et al., 1999) but do not involve PFC (Milner et al., 1991; Tendolkar and Rugg, 1996). An altogether different model seems required to explain the temporal decay in novelty detection tasks.
On the question of biological plausibility, the model is clearly oversimplified in many ways. Firstly, spike trains produced by WM neurons are treated here as a continuous signal that is either active or inactive. This corresponds to the as-sumption that the timing of individual PFC spikes is irrelevant for priming in IT. Considering indi-vidual spikes in the model would probably create more opportunities for errors and allow longer time constants to be produced by the fitting pro-cedure. Not enough is known of biological time constants to determine if this would be an appro-priate step. Other elements of the model may require improvements. For instance (i) it is doubt-ful that the complex dynamics of a cluster of neurones can be captured by a simple probabilis-tic self-feedback loop; (ii) further, it is likely that such clusters may exhibit a distribution of decay time constants; (iii) possible effects of learning have also been omitted; (iv) noise effects in other parts of the circuit have been mostly ignored. For
response selection results (Section 3.2). The model can be extended to incorporate more of the bio-logical details noted above, however experimental data are missing to give appropriate guidance.
4.3. Memorisation process
A hypothesis of the model presented here is the pre-existence of neurons (or WM-clusters) in PFC that are specific to given stimuli. This is unlikely, when considering the huge number of possible stimuli extractable from any natural sensory input pattern. We therefore propose that some prepara-tion in done by the subject in order to set up units in PFC, with properties relevant for the task at hand. Further, we could also assume that only those stimuli relevant to the task actually initiate memory activity, thus pointing to the existence of some gating mechanism.
Given these hypotheses, the memory process modeled here is neither automatic in the restricted sense of (Zacks et al., 1984), nor effortless in the sense of (Schacter, 1987). However, it is passive in that no rehearsal or memory refreshment is needed to explain the performance of the subjects. This hypothesis offers a parsimonious account of human recency judgement performance.
5. Conclusion
area. The model could suggest a larger number if a different, non-exponential, decay time course for WM units were assumed. It is therefore im-portant to gather more detailed neuro-physiologi-cal data on the representation in IT and PFC, the connectivity between these two areas and the dy-namics of memory neurons in PFC.
Acknowledgements
This work has benefited from discussions with Professor Mike Denham, Professor Dan Levine, Professor John Taylor, Yakov Kazanovich, Chris Hindle and Ouri Monchi. RSB acknowledges sup-port from the UK Engineering and Physical Sci-ences Research Council (GR/J42151) and the benefit of discussions with Dr Kenji Doya. We are grateful for comments by anonymous referees.
References
Bugmann, G., 1997. Biologically plausible neural computa-tion. Biosystems 40, 11 – 19.
Bugmann, G., Taylor, J.G., 1993. A stochastic short-term memory using a pRAM neuron and its potential applica-tions. Proceedings of British Neural Network Society Meeting (BNNS’93). Can be downloaded from: http://
www.tech.plym.ac.uk/soc/staff/GuidBugm/pub/stm1 – ps.zip
Courtney, S.M., Ungerleider, L.G., Keil, K., Haxby, J.V., 1997. Transient and sustained activity in a distributed neural system for human working memory. Nature 386, 608 – 611.
Funahashi, S., Bruce, C.J., Goldman –Rakic, P., 1989. Mnemonic coding of visual space in the monkey’s dorso-lateral prefrontal cortex. J. Neurophysiol. 61 (2), 331 – 349. Fuster, J.M., 1989. The Prefrontal Cortex, 2nd edn. Raven,
New York.
Fuster, J.M., Bauer, R.H., Jervey, J.P., 1981. Effects of cool-ing inferotemporal cortex on performance of visual mem-ory tasks. Exp. Neurol. 71, 398 – 409.
Hanes, D.P., Schall, J.D., 1996. Neural Control of voluntary movement initiation. Science 274, 427 – 430.
Koechlin, E., Basso, G., Pietrini, P., Panzer, S., Grafman, J., 1999. The role of the anterior prefrontal cortex in human cognition’. Nature 399 (6732), 148 – 151.
Milner, B., Corsi, P., Leonard, G., 1991. Frontal-lobe contri-bution to recency judgements. Neuropsychologia 29 (6), 601 – 618.
Miller, E.K., Erickson, C.A., Desimone, R., 1996. Neural mechanisms of visual working memory in prefrontal cortex of the macaque. J. Neurosci. 16 (16), 5154 – 5167. Pandya, D.N., Barnes, C.L., 1987. Architecture and
connec-tions of the frontal lobe. In: Perecman, E. (Ed.), The Frontal Lobes Revisited. IRBN Press, New York, pp. 41 – 72.
Petrides, M., 1991. Functional specialization within the dorso-lateral frontal cortex for serial order memory. Proc. R. Soc. Lond. Ser. B 246, 299 – 306.
Rubin, D.C., Hinton, S., Wenzel, A., 1999. The precise time course of retention. J. Exp. Psychol. 25, 1161 – 1176. Sawaguchi, T., Goldman-Rakic, P.S., 1994. The role of
D1-dopamine receptors in working memory: local injections of dopamine antagonists into the prefrontal cortex of rhesus monkeys performing an occulomotor delayed task. J. Neu-rophysiol 71 (2), 515 – 528.
Schacter, D.L., 1987. Memory, amnesia, and frontal lobe dysfunction: a critique and interpretation. Psychobiology 15, 21 – 36.
Schwartz, B.L., Deutsch, L.H., Cohen, C., Warden, D., Deutsch, S.I., 1991. Memory for temporal order in schizophrenia. Biol. Psychiatry 29, 329 – 339.
Tendolkar, I., Rugg, M.D., 1996. Electrophysiological dissoci-ation of recency and recognition memory. Neuropsycholo-gia 36 (6), 477 – 490.
Usher, M., Niebur, E., 1996. Modelling the temporal dynam-ics of IT neurons in visual search: a mechanism for top-down selective attention. J. Cogn. Neurosci. 8 (4), 311 – 327.
Wang, G., Tanifuji, M., Tanaka, K., 1998. Functional archi-tecture in monkey inferotemporal cortex revealed by in vivo optical imaging. Neurosci. Res. 32 (1), 33 – 46. Zacks, R.T., Hasher, L., Alba, J.A., Sanft, H., Rose, K.C.,
1984. Is temporal order encoded automatically? Mem. Cognit. 12, 387 – 394.