23
CHAPTER III
RESEARCH METHODOLOGY
This chapter presents the methodology of the study. It provides information and
explanation about the purpose of the study, research design, site and participants, data
analysis, data analysis procedures, and testing of validity.
3.1Purpose of the Study
The purpose of the study is to know the students‟ attitudes toward the implementation of guessing game technique activities in teaching speaking skill and
to find out the benefit of guessing game activity. Therefore, this study is conducted to
answer these two questions:
1. What are benefits guessing game technique in students‟ speaking class?
2. What are students‟ attitudes towards the use of guessing game technique in
students‟ speaking class?
3.2Research Design
Qualitative approach was employed in this study. The term of qualitative
study refers to studies which look into the quality of relationship, activities, situation,
or material (Fraenkel et al. 2011: 440). It is a design that consents a researcher to
explore people's beliefs, experiences, behaviors, interactions, perceptions, attitudes,
feelings and motivations at once to comprehend how they are formed (Deeptee and
understand a phenomenon in a particular situation in a natural setting where the
researcher does not control the phenomenon of interest. It describes “in detail all of
what goes on in a particular activity or situation rather than on comparing the effects
of a particular treatment” (Fraenkel et al. 2011: 426). According to Cresswell (2007:
249) in qualitative study “the researcher builds a complex, holistic picture, analyzes words, report detailed views of informants, and conducts the study in natural setting”. One of the strengths of the qualitative approach is the natural setting where a
researcher gathers the data at the field of participants‟ experience to the issue under
study (Creswell, 2007: 37).
In relation to the aforementioned definition, this study was conducted to
investigate the phenomenon of using guessing game technique in teaching speaking
and to gather an in-depth understanding regarding to its process.
To look into the issues, the researcher used qualitative approach by applying a
descriptive method. The goal of a qualitative descriptive study is to generate a
comprehensive summary of events at the moment (Sandelowski, 2000). It seeks to
provide this picture using data in the form of words or pictures. Hence, the method
consisted of three kinds of data collection: participant observation, questionnaires and
interview.
3.3Site and Participants
The study was conducted in a Junior High School in Bandung. The selection
of the school was based on the following consideration. The school considered that
the students‟ vocabulary mastery should be improved, so the school gave a chance to the researcher to conduct a research.
The population of the study was one class of the students of the second
25
class. The researcher focused on one class as the sample. The sample class was
randomly chosen. There were 36 in that class.
The participants have learnt English since they were first graders, moreover
from elementary school. In junior high school, they learn English twice a week or
four hours for a week. But they are still less to speak or familiar with English
speaking materials. They still have difficulty to understand and speak in English.
The researcher takes the students as the participant because the school warmly
opens the cooperation to conduct this study especially in the second grade. They were
grouped into one class in academic year 2013/2014.
Other than that, the English teacher wanted to know other alternative
techniques in teaching speaking as well.
3.4Data Collection
Triangulation technique was used in collecting the data in this study. In a
qualitative study, it refers to collecting the data from various sources and/or through
various methods (Alwasilah, 2009: 106). Creswell (2012: 536) notes that
triangulation combines “the strengths of one type of method and neutralize the weaknesses of the other” to enrich the investigation. It helps to reduce the bias and the subjectivity of a research; moreover it can enhance the credibility of the research
(Arifin, 2011: 164). Accordingly, there were three methods in collecting the data in
Figure 3.1
Triangulation Method of Creswell (2012: 536)
3.4.1 Participant Observation
The first instrument in this study was participant observation. Participant
observation is commonly used to collect qualitative data. According to Key (1997),
one of the advantages of qualitative research is to “use subjective information and participant observation to describe the context, or natural setting, of the variables
under consideration, as well as the interactions of the different variables in the
context.” It tries to find an open understanding of a phenomenon.
The observation in this study was conducted to investigate students‟ learning activities. In this study, the researcher took part as a participant observer, which was
as their teacher. From this observation, the researcher would verify the students‟
behavior and performance to the task given, and students‟ condition when guessing game techniques were conducted by observing their activities in the class. The
observation was held for three meetings.
Data collection Strategy (Triangulation)
27
Observation sheet and field notes were used to record notes about
participants‟ behavior and performance during the observation (Cresswell, 2012). The
observation sheet was not used in the first meeting because there were any activities
related to guessing game in the first meeting. It was used from the second meeting
until the forth meeting. In the first meeting, the researcher simply gave an acticity of
related to guessing game which were guessing things and twenty questions which had
a topic of public places. The observation sheet was based on the activities related to
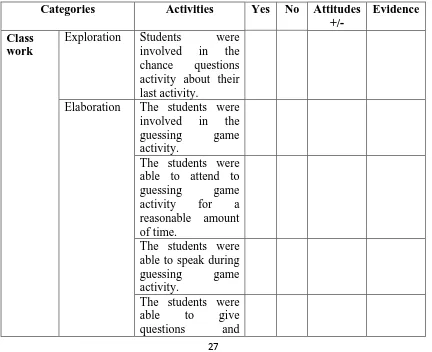
guessing game in the lesson plan. Therefore, the observation sheet is revealed below.
Table 3.1
Observation Sheet (based on guessing game in the classroom)
Categories Activities Yes No Attitudes
+/-
Evidence
Class work
answers to guess things during guessing game activity.
Confirmation The students were able to know how describe things.
To avoid the bias in the observation, the researcher invited the English teacher
from the school as the second observer. She accompanied and assessed the researcher
in teaching and learning process.
3.4.2 Questionnaires
Questionnaire was the second instrument in this study. It is one of the research
instruments which consist of a series of questions or statements to obtain the
information from participants (Arifin, 2011: 228). In a questionnaire, the participants
respond to the questions or statements by writing or marking an answer sheet
(Fraenkel et al. 2011: 125). According to Alwasilah (2011), questionnaire can be
used to identify opinions, attitudes, or subject‟s perceptions.
In this study, there was one form of questionnaire; it was close-ended
questionnaires. In close-ended questionnaire, it provides a multiples choices
questions which allow a participant to choose his or her answer from a number of
options. Whereas in open-ended questionnaire, participants are not provided with the
response options; they supply their own responses to the questions (Creswell, 2012:
386).
To complete this questionnaire, the participants needed to mark or circle
predetermined answers that “best represents their feeling about the topics included in
29
of this type of questionnaire are enhancing consistency of response across
participants, tabulating easier and faster and providing a means for coding responses
(Creswell, 2012; Fraenkel et al. 2011).
The questionnaires were analyzed quantitatively by using Likert Scale.
Fraenkel et al. (2011) claim that Likert Scales is the most commonly used questions
format for assessing participants‟ attitudes toward a particular concept. Likert Scale
uses scale 1-5, where the score 5 for strongly agree (SA), 4 for agree (A), 3 for
uncertain (U), 2 for disagree (DA), and 1 for strongly disagree.
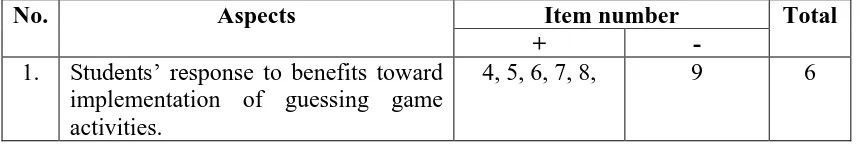
Table 3.2
The form of questionnaire consisted of positive and negative statements which
framework as follow: implementation of guessing game activities.
2. Students‟ attitude toward the implementation of guessing game activities in their speaking class.
1 2, 3 3
Total 9
The statements in these questionnaires were written in Indonesian to avoid
misunderstanding from the participants. This questionnaire was administered
anonymously to get reliable data. The questionnaires were distributed after finishing
the implementation of guessing game activities.
3.4.3 Interviews
The last instrument in this study was interview. In-depth information and data
can be obtained by a researcher by doing an interview (Alwasilah, 2011). Interviews
generate direct record from participants about “their experiences, opinions, feelings,
and knowledge” (Patton, 2002). For this study, interview was addressed to obtain additional information about students‟ attitudes toward guessing game activity and benefits perceived by them through guessing game activity, together with their
suggestion for implementing guessing game. In addition, the information from the
interview could support and clarify the data from the observations and questionnaires.
The model of interview in this study was semi-structured interview. The aim
of this model is to find the problem openly where the respondents are asked to give
their opinions and ideas (Sugiono, 2012: 320).
The interviews were conducted with six students as the samples. The
researcher assumed that six students represent all numbers of the class. It was
one-on-one interview where “the researcher asks questions to and records answers from only participant in the study at a time” (Creswell, 2012: 218). The interview was recorded
by voice recorder. To avoid misunderstanding and make students answer to the
31
3.5Data Analysis
After obtaining the data from the observations, questionnaires and interviews,
the data were analyzed to answer the research questions. There were two kinds of
data in this study; qualitative and quantitative data. The qualitative data was collected
from the observations and interviews, while the quantitative data was collected from
the questionnaires. The data collection would be analyzed as follows.
3.5.1 Participant Observation Analysis
The data from the observations were recorded by using observation sheet, the
researcher‟s field notes. The gained data were analyzed to find out the students‟
attitudes toward the implementation of guessing game activities and benefits
perceived by the students through the activities of guessing game. After that, the data
were classified based on some categories in the findings. The findings from the
observations were described in detail. Lastly, the explanation of the findings were
interpreted and discussed in the next chapter.
3.5.2 Questionnaire Analysis
The form of questionnaires which was close-ended questionnaires was
analyzed by calculating the frequency of the students‟ answers. Then, the next step
was calculating the percentage of each total frequency of the students‟ answers to item by using percentage formula. The formula is as follow.
fo
Figure 3.2
Precentage Formula of Sudijono (2008: 43)
P = Percentage (%) fo = Frequency Observed n = Total respondents
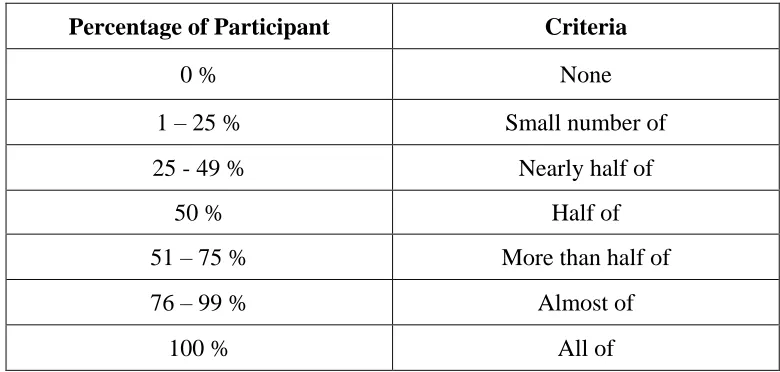
The next step was interpreting the result percentage of calculations; the researcher referred to a reference according to Kuntjaraningrat (Nurjanah, 2012). The following are the interpretations for each percentage:
Table 3.4
Criteria of Percentage of Participants
Percentage of Participant Criteria
0 % None
1 – 25 % Small number of
25 - 49 % Nearly half of
50 % Half of
51 – 75 % More than half of
76 – 99 % Almost of
100 % All of
33
The data from the interviews were recorded by using voice recorder. The
interview recording was transcribed so that the data could be categorized. After
transcribing the data, the researcher analyzed it. The next step was the data were
interpreted by addressing the data with the research questions of the study.
3.6Data Analysis Procedures
Data analysis was done by categorizing, interpreting, synthesizing, organizing
the data into units and models, choosing the important one to be learnt, and
formulating the conclusion (Sugiono, 2012: 334). In this study, after the data was
collected from the observations, the questionnaires and the interviews, those data
were analyzed by using descriptive qualitative analysis. Miles and Huberman (1994)
proposed three simultaneous flows of activities in analyzing the data, there are: data
reduction, data display and conclusion drawing or verification.
3.6.1 Data Reduction
Data reduction refers to “the process of selecting, focusing, simplifying, abstracting, and transforming the data that appears in written-up field notes or
transcriptions” (Miles and Huberman, 1994). In this study, the process of data
reduction progressed concurrently as data collection proceeds. There were a number
of data which was obtained from the field: the data from observations, questionnaires
and interviews. So, data reduction is needed to simplify the data gathered. By
implementing data reduction, the data will be simpler and it will make the process of
data analysis easier. The attained data would be focused to answer the research
question.
In this process, data reduction was done by writing summaries, making
the final report is achieved. This was the series of elucidate the data. Those series
helped the researcher had the clear view about this study. Miles and Huberman
(1994) also add that “data reduction is a form of analysis that sharpens, short, focuses, discards, and organizes data in such a way that „final‟ conclusions can be drawn and verified.”
3.6.2 Data Display
Data display is the second step of data analysis in qualitative study. In
qualitative research data could be displayed by some ways such as by using graph,
chart, table or matrix, networks or concept, flowchart, diagram, extended text or
narrative text and another various kinds of it (Miles and Huberman, 1994; Alwasilah,
2011). Data display facilitates the researcher in the process of data analysis; the ideas
and interpretations of the data will be clearer and permanent (Alwasilah, 2011).
In this study, the field notes would be displayed in an extended text to
describe the implementation of guessing game activity in a speaking class, while the
result of observation sheet would be displayed in table. The result of interviews
would be explained in extended text. Moreover, the questionnaires result would be
display in some tables and charts.
3.6.3 Conclusion Drawing
The third step of data analysis in qualitative study is conclusion drawing or
verification. The researcher made an interpretation on the data analyzed after doing
data reduction and data display processes to the attained data from field notes,
observation sheets, questionnaires and interviews. After that, she drawn some
conclusions related to the research questions: benefits perceived by the students in the
35
use of extensive reading activities in their reading class. Additionally, the
recommendation for further study would be drawn in the chapter five.
3.7 Testing of Validity
Validity is regarded as an important concept in qualitative study (Fraenkel et
al. 2011). Validating finding refers to the accuracy or credibility of the findings
which are determined by the researcher by using some strategies (Creswell, 2012).
To test the validity and the trustworthiness in this study, the researcher employed
several strategies: triangulation, feedback and member checking.
The first strategy was triangulation. As it has been explained before,
triangulation is data collection technique which combines some methods and/or
sources. Triangulation promotes the researcher “to develop report that is both accurate and credible” (Creswell, 2012) because a variety of instruments in collecting
the data is supported in a conclusion (Fraenkel et al. 2011).
In this study, the researcher employed methodological triangulation (Denzin
(1978) in Patton, 2002) because there were several methods used to collect the data.
The methods were participant observation, questionnaire and interview. The
researcher conducted participant observation to collect the data from the teaching and
learning process by using field notes and completing observation sheets. Then in
order to avoid bias of the study, she balanced the findings with the information
obtained from questionnaires and interviews
The second strategy was feedback. To identify validity threat, bias and
researcher‟s assumption, including logical weakness of the current study, thus asking
feedbacks, comments, critiques, and advice from others are needed (Alwasilah,
2011). In this study, the feedbacks were given from the supervisors, the English
The third strategy was member checking. It was also employed in this study to
check the accuracy the findings (Creswell, 2012). Member checking was
accomplished after analyzing the data obtained from the observation, questionnaires
and interviews. The data obtained was reconfirmed to participants to determine the
accuracy and appropriateness of the findings. The researcher took back the findings to
the participants and reconfirmed them by asking the participants whether the
descriptions of the findings were complete and sensible and whether its
interpretations are fair and representative (Creswell, 2012: 259).