GLACIER VOLUME CHANGE ESTIMATION USING TIME SERIES OF IMPROVED
ASTER DEMS
Luc Giroda∗, Christopher Nuthaand Andreas Kääba
aDepartment of Geosciences, University of Oslo, Postboks 1047 Blindern, 0316 Oslo, Norway (luc.girod, christopher.nuth, andreas.kaeaeb)@geo.uio.no
Commission VIII, WG VIII/6
KEY WORDS:ASTER, Jitter, DEM generation, RPC, Glacier
ABSTRACT:
Volume change data is critical to the understanding of glacier response to climate change. The Advanced Spaceborne Thermal Emission and Reflection Radiometer (ASTER) system embarked on the Terra (EOS AM-1) satellite has been a unique source of systematic stereoscopic images covering the whole globe at 15m resolution and at a consistent quality for over 15 years. While satellite stereo sensors with significantly improved radiometric and spatial resolution are available to date, the potential of ASTER data lies in its long consistent time series that is unrivaled, though not fully exploited for change analysis due to lack of data accuracy and precision. Here, we developed an improved method for ASTER DEM generation and implemented it in the open source photogrammetric library and software suite MicMac. The method relies on the computation of a rational polynomial coefficients (RPC) model and the detection and correction of cross-track sensor jitter in order to compute DEMs. ASTER data are strongly affected by attitude jitter, mainly of approximately 4 km and 30 km wavelength, and improving the generation of ASTER DEMs requires removal of this effect. Our sensor modeling does not require ground control points and allows thus potentially for the automatic processing of large data volumes. As a proof of concept, we chose a set of glaciers with reference DEMs available to assess the quality of our measurements. We use time series of ASTER scenes from which we extracted DEMs with a ground sampling distance of 15m. Our method directly measures and accounts for the cross-track component of jitter so that the resulting DEMs are not contaminated by this process. Since the along-track component of jitter has the same direction as the stereo parallaxes, the two cannot be separated and the elevations extracted are thus contaminated by along-track jitter. Initial tests reveal no clear relation between the cross-track and along-track components so that the latter seems not to be easily modeled analytically from the first one. We thus remove the remaining along-track jitter effects in the DEMs statistically through temporal DEM stacks to finally compute the glacier volume changes over time. Our method yields cleaner and spatially more complete elevation data, which also proved to be more in accordance to reference DEMs, compared to NASA’s AST14DMO DEM standard products.
The quality of the demonstrated measurements promises to further unlock the underused potential of ASTER DEMs for glacier volume change time series on a global scale. The data produced by our method will help to better understand the response of glaciers to climate change and their influence on runoff and sea level.
1. INTRODUCTION
1.1 Motivation
Glaciers and their changes over time are key elements of the Earth’s water cycle influencing global sea level and, in many mountain regions, local water availability for household, agri-cultural and hydropower use. Glacier can also pose significant natural hazards, for instance through ice avalanching and glacier lake outbursts. Volume changes of glaciers reflect glacier mass changes and are thus critical to the understanding of glacier re-sponse to climate change. The Advanced Spaceborne Thermal Emission and Reflection Radiometer (ASTER) system on the Terra (EOS AM-1) spacecraft has been a unique source of systematic stereoscopic images covering the whole globe at consistent char-acteristics for over 15 years. While satellite stereo data with sig-nificantly improved radiometric and spatial resolution are avail-able to date, the potential of ASTER data lies in its long time se-ries that is unrivaled, though by far not fully exploited for change analysis due to lack of data accuracy and precision. Long time series are crucial for glacier change detection in order to sepa-rate short-term variations in surface mass balance from the more long-term changes driven by variations in climate and glacier dy-namics (Wang and Kääb, 2015). Only recently, the ASTER data
∗Corresponding author
archive has been made freely available to the public which further calls for and facilitates improved and systematic exploitation of these stereo data over large regions.
1.2 Challenges
Even if the existence of such raw data over such a long time span is a great starting point, DEMs generated by NASA with SilcAst (SILC, 2015) (ASTER DMO products) do not provide a sufficient geometric quality for glacier volume change estimation over short periods, the expected change being significantly smaller than the accuracy of the product (a few meters against±30m, see Figure 1 of the DMO over a scene of fast sea ice, i.e. with expected com-pletely flat topography). This is due in part to the unaccounted for satellite jitter inducing attitude perturbation (Kääb et al., 2013). Proposed causes for this disturbance include the mechanical cool-ing system, the rotation of mirrors and movements of the high gain antenna, but a source is yet to be formally identified.
instance, while the TanDEM-X iDEM is not yet complete and freely available but will have to be examined in this context.
Figure 1: ASTER DMO product over a fast sea ice scene, which should be uniformly flat in the sea area, presents gaps filled with interpolated data and high noise, the data peaks at several hundred meters. The high elevation areas (yellow) at the scene margins represent islands.
In (Girod et al., 2015) and (Kääb et al., 2013), we discussed the characteristics of the ASTER jitter signal and showed that com-pensation methods previously proposed for other sensors or even other bands of the ASTER system were not applicable. We then demonstrated that it was possible to compute improved DEMs, being more complete and with a clean along-track signal that we supposed could be removed using a stack of DEMs and stable ter-rain. In this paper, we shortly explain the DEM extraction method in section 2.1 and then how we remove the remaining along-track signal in section 2.2.
2. MMASTER METHOD
Our method, dubbed MMASTER to reflect the use of MicMac in this ASTER processing chain, is using for its first part the DEM generation method presented in (Girod et al., 2015) and recapped in section 2.1. The second part of the method, presented in sec-tion 2.2, allows for the generasec-tion of either DEMs if an external dataset with good data on the stable terrain is available, or eleva-tion change values if two (or more) ASTER scenes of the same area at different points in time are available. Figure 2 summarizes the different steps of the method.
2.1 DEM extraction
In (Girod et al., 2015), we presented a method to extract a DEM from the VNIR images of an ASTER L1A dataset with a correc-tion on the cross-track jitter. The method can be divided in the following steps :
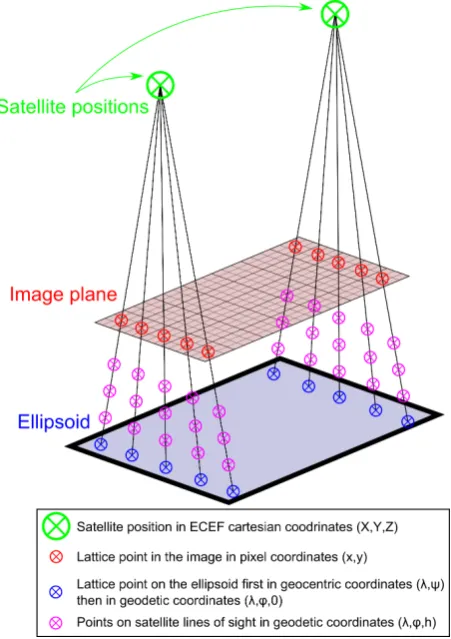
• Extraction from HDF file: nadir and back-looking VNIR images, radiometric calibration tables and geolocation data (lattice points in both geocentric and image coordinates ev-ery 400 pixels along the image’s Y-axis as well as the asso-ciated satellite position).
• Destriping of the images by the application of the radiomet-ric calibration tables to the images.
Figure 2: Diagram of the overall method. Green, as presented in (Girod et al., 2015) and recapped in section 2.1. Red, presented in this paper in section 2.2.
• Creation of grids of points for each image at regular (500m) altitude intervals on the lattice points-defined lines of sights (see Figure 3).
• Fitting of RPC functions (see equations 1 to 5) on the grid using mean square minimization.
• Computing of the cross-track jitter component by estimating the distance between the point of best correlation and the epipolar line and correcting the image for it (see example of a correction grid in Figure 4).
• Computing the DEM by searching for the point of best cor-relation for given altitudes for all points on the 15m GSD UTM coordinate grid of the imaged area.
Figure 3: Satellite positions and associated lattice points in im-age and geographical coordinates and 3D GRID created from the lattice points.
2.2 Along-track jitter removal
To obtain good elevation difference data, the DEMs produced by the aforementioned method still require post-processing. Indeed, the along-track jitter component is still present in the DEMs. Be-cause of its relatively low amplitude compared to the terrain vari-ation in most scenes, it is not easy to detect the along-track jit-ter effect from the single DEM produced alone. However, we are interested in elevation change, and computing the elevation difference between two scenes largely removes the terrain signal and shows the superposition of the jitter effects from both DEMs. Actual terrain change (such as glacier elevation change, erosion, or similar processes) is also added to the signal. Figure 5 shows the difference of two DEMs after a 3D co-registration using the method described in (Nuth and Kääb, 2011).
To remove this remaining effect composed of the along-track jit-ters of the two ASTER DEMs, we first need to filter out the unsta-ble terrain. This can be done by masking changing terrain manu-ally, by using a database of glacier areas and a buffer to account for possible glacier changes over time or database inaccuracies, or by detecting glaciers using multispectral methods such as band ratios (Winsvold et al., 2016). This last method, while being au-tomated as well as not requiring external data, works on clean-ice glaciers but might fall short on debris covered glaciers and other non-glacier phenomena such as landslides . Note also, that ASTER SWIR data is not anymore available for multispectral analysis in images acquired in recent years due to sensor degra-dation.
When only the stable terrain is remaining, the data is fit with fifth degree polynomials in the across and along track directions for
Figure 4: Measure of the combined cross-track vibration visible in the back-looking image through bi-dimensional correlation in back-looking image coordinates for the 2014 scene presented in section 3.1.
the long wavelength part (∼34km) and by a sinusoidal signal (with known bounds on wavelength (4.5±0.3km) and amplitude
(5±5m)) in the along-track direction for the short wavelength part. Depending on the amount and distribution of stable terrain in the scene available for fitting, the signal might be difficult to identify and therefore only partially corrected. Figure 6 shows the difference between the two study DEMs after the application of the above corrections.
Figure 5: Example of measured elevation change from two ASTER DEMs after co-registration. For an overview of the area covered see Figure 7.
3. GLACIER VOLUME CHANGE
3.1 Test scene
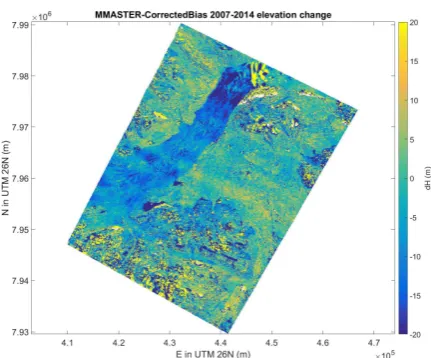
Figure 6: Example of measured elevation change after correction of the along-track jitter effect. Some jitter remains visible point-ing to a still imperfect correction. For an overview of the area covered see Figure 7.
The SPIRIT project used SPOT 5 HRS stereopairs to create DEMs over selected important polar regions at 40m GSD in UTM pro-jection. The accuracy of the DEMs produced by the SPOT 5 HRS system has been assessed at around 5 m (relative) and 10/15 m (absolute) (Baudoin et al., 2004). After co-registration of two of these products, we can therefore expect an accuracy of the el-evation difference of around 7m.
ASTER
Date 2007-07-29
Reference AST_L1A#00307292007135727_08012007140410
Date 2014-06-12
Reference AST_L1A#00306122014141003_06132014033533 SPIRIT
Date 2007-08-02
Reference GES_08-015
Date 2014-06-02
Reference GES_14-012
Table 1: Dataset references.
3.2 Data
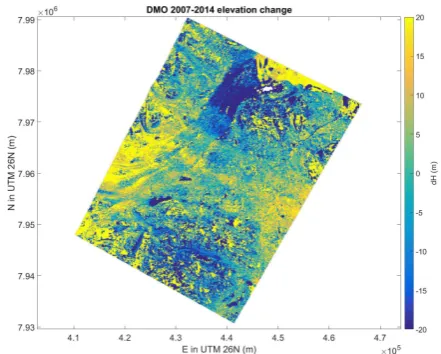
Elevation change grids were computed for each dataset with co-registered products (the SPIRIT scenes together on one hand – see Figure 9 – and the two DMO scenes together on the other hand – see Figure 10), or, for the MMASTER product, after ap-plication of our method.
Our analysis focuses on the Daugaard-Jensen glacier part that is visible is both ASTER scenes as well as on a group of small glacier unlinked to the Greenland Ice Sheet. The approximate centerline and the selected areas are shown in Figure 7.
We first extracted the 2007-2014 elevation change values over the centerline for each dataset. The difference between the SPIRIT elevation change values (considered ground truth with a±7m ac-curacy) and both the DMO and MMASTER values are plotted in Figure 8. The MMASTER values are in most part (89%) inside of the±7maccuracy band given by the SPIRIT data (agreement of−2.5±4.0m) while the DMO is significantly off (agreement of +11.2±28.2m, with only 24% in the accuracy band). The DMO
data shows both error trends and sharp error peaks reaching over 100m while the MMASTER is fairly contained. While the er-ror trend should stem from the long-wavelength jitter effects not
Figure 7: Centerline (green) and areas (red) considered for the quantitative analysis, overlaying the SPIRIT 2014 orthoimage.
accounted for in the DMO in contrast to the MMASTER DEM, we assume that the sharp error peaks could in parts be due to the cross-track jitter not accounted for in the DMO processes. Corre-sponding points in the ASTER stereo data can have a cross-track offset from the (approx. along-track) epipolar line that is too large to match between them when using a directional (i.e. along-track) correlation algorithm with insufficient cross-track margin.
Figure 8: Difference along the centerline (shown in Figure 7) be-tween the 2007-2014 elevation change from the SPIRIT data (set as reference data and thus zero; error bar shown in grey; see Fig-ure 9) and the elevation change from our product (MMASTER, see Figure 6) and the DMO product (see Figure 10).
On both cases, the MMASTER outperforms the DMO in terms of accuracy with reference to the SPIRIT DEM differences.
Dataset dV Daugaard-Jensen dV Group
DMO +0.629km Table 2: Volume change in glacier tongue according to each dataset.
Figure 9: Measured elevation change from co-registered 2007 and 2014 SPIRIT DEMs.
Figure 10: Measured elevation change from co-registered 2007 and 2014 DMO DEMs.
4. IMPLEMENTATION
The across-track jitter estimations and corrections, as well as the DEM and orthoimage production, were implemented in the free open source MicMac photogrammetric library (developed at the French National Institute of Geographic and Forest Information – IGN – (Pierrot-Deseilligny et al., 2016) and (Pierrot-Deseilligny, 2016)). A ready to use software to produce DEMs and ortho-images from Level 1A ASTER products is therefore available.
However, our implementation uses the MatLab HDF tools to ex-tract the data from the files provided by NASA as two destriped tiff images and two xml files containing the positions of the satel-lites and the lattice points in J2000.00 ECEF Cartesian coordi-nates as well as the lattice points in image coordicoordi-nates. The post-processing of the DEMs into elevation change products is also
currently implemented in MatLab. Future development will port these capabilities into the MicMac library as well.
5. CONCLUSION
In continuation to the work presented in (Girod et al., 2015) on the production of improved DEMs from ASTER L1A products with focus on removal of effects from cross-track jitter, we have now extended the method to also deal with the remaining ef-fect from the along-track jitter component and have shown that it is possible to fit corrections to the bias observed on the stable ground and produce MMASTER dDEMs that are suitable to sur-vey glacier volume change, while it proved challenging to obtain good data with the DMO products.
When comparing two scenes of the same area to analyze eleva-tion change in the terrain, MMASTER products show good accor-dance with SPIRIT products (that have themselves been proven to be adequate for mapping glacier elevation change by (Korona et al., 2009)). We can therefore conclude that, when sufficient stable ground is present for the fitting of corrections, the MMAS-TER products can be used for mapping glacier elevation change with an accuracy better than±10m, given that sufficient visual contrast is available in the data to permit matching of stereo-parallaxes. This possibility opens a range of new perspectives for glacier change detection in view of the large and 15-year long global-scale archive of ASTER stereo data, its recent free avail-ability, and the fact that the ASTER stereo sensor is still oper-ational and will continue to acquire new data in the foreseeable future.
6. ACKNOWLEDGMENTS
This study was funded by the European Research Council under the European Union’s Seventh Framework Programme (FP/2007-2013)/ERC grant agreement no.320816 and by the ESA project Glaciers_cci (4000109873/14/I-NB). Acquisition of the ASTER images was guided by NASA JPL, through the ASTER science team and the Global Land Ice Measurements from Space (GLIMS) initiative. The SPOT5-HRS DEMs were obtained through the IPY-SPIRIT program ((Korona et al., 2009)) cCNES and SPOT Image 2007 and 2014. We also acknowledge the help from Marc Pierrot-Deseilligny and the MicMac team at IGN/ENSG for their help in the development of the software.
REFERENCES
Baudoin, A., Schroeder, M., Valorge, C., Bernard, M. and Rudowski, V., 2004. The hrs-sap initiative: a scientific assess-ment of the high resolution stereoscopic instruassess-ment on board of spot-5 by isprs investigators. International Archives of Pho-togrammetry, Remote Sensing and Spatial Information Sciences 35(B1), pp. 372–378.
Girod, L., Nuth, C. and Kääb, A., 2015. Improvement of dem generation from aster images using satellite jitter estimation and open source implementation. ISPRS - International Archives of the Photogrammetry, Remote Sensing and Spatial Information Sciences XL-1-W5, pp. 249–253.
Korona, J., Berthier, E., Bernard, M., Rémy, F. and Thouvenot, E., 2009. Spirit. spot 5 stereoscopic survey of polar ice: ref-erence images and topographies during the fourth international polar year (2007–2009). ISPRS Journal of Photogrammetry and Remote Sensing 64(2), pp. 204–212.
Nuth, C. and Kääb, A., 2011. Co-registration and bias corrections of satellite elevation data sets for quantifying glacier thickness change. The Cryosphere 5(1), pp. 271–290.
Pierrot-Deseilligny, M., 2016. Micmac webpage.
Pierrot-Deseilligny, M., Rupnik, E., Girod, L., Belvaux, J., Mail-let, G., , Deveau, M. and Choqueux, G., 2016. MicMac, Apero, Pastis and Other Beverages in a Nutshell! ENSG, IGN, Champs-Sur-Marne, France.
SILC, 2015. Sensor information laboratory corp software’s sil-cast ver.2.00 webpage.
Wang, D. and Kääb, A., 2015. Modeling glacier elevation change from dem time series. Remote Sensing 7(8), pp. 10117–10142.