__________________________________ * Corresponding Author
MAPPING OF THE SEAGRASS COVER ALONG THE MEDITERRANEAN COAST OF
TURKEY USING LANDSAT 8 OLI IMAGES
T. Bakirman a,*, M.U. Gumusay a, I. Tuneyb
a YTU, Civil Engineering Faculty, 34220 Esenler Istanbul, Turkey - (bakirman, gumusay)@yildiz.edu.tr b Ege Universiy, Faculty of Science, 35100 Bornova Izmir, Turkey – [email protected]
Commission VIII, WG VIII/9
KEY WORDS: Seagrass, Cover, Landsat 8, Image Classification, Remote Sensing
ABSTRACT:
Benthic habitat is defined as ecological environment where marine animals, plants and other organisms live in. Benthic habitat mapping is defined as plotting the distribution and extent of habitats to create a map with complete coverage of the seabed showing distinct boundaries separating adjacent habitats or the use of spatially continuous environmental data sets to represent and predict biological patterns on the seafloor. Seagrass is an essential endemic marine species that prevents coast erosion and regulates carbon dioxide absorption in both undersea and atmosphere. Fishing, mining, pollution and other human activities cause serious damage to seabed ecosystems and reduce benthic biodiversity. According to the latest studies, only 5-10% of the seafloor is mapped, therefore it is not possible to manage resources effectively, protect ecologically important areas. In this study, it is aimed to map seagrass cover using Landsat 8 OLI images in the northern part of Mediterranean coast of Turkey. After pre-processing (e.g. radiometric, atmospheric, water depth correction) of Landsat images, coverage maps are produced with supervised classification using in-situ data which are underwater photos and videos. Result maps and accuracy assessment are presented and discussed.
1. INTRODUCTION
Seagrass (P. oceanica) is an endemic plant that protects Mediterranean ecosystem, prevents coast erosion and regulates carbon dioxide absorption in at both land and sea. Seagrass provides nutrition and habitat to various fish and invertebrate, notably larva and tiddler.
Seagrass and other benthos in sea ecosystem are under heavy pressure of human activities (Brown et al., 2011). Fishing, mining, pollution and other human activities damage seabed ecosystem and reduce benthic biodiversity. If no precautions are taken, fish and sea product sector is estimated to dramatically downfall in the middle 21st century (Worm et al., 2006). Additionally, all oceans in global scale are affected by human activities (Halpern et al., 2008). According to the studies, only 5% - 10% of world’s sea floor is mapped (Wright and Heyman, 2008). Therefore, it is not possible to manage resources effectively and protect ecologically substantial areas. Marine ecosystems are need to be mapped in order to determine marine protected areas and manage resources.
Due to limitations of classic surveying techniques, information is scarce about benthic habitat’s ecologic function and geographic diversity (Wright and Heyman, 2008). Geological and biological researches about seafloor have been carried out at in the early years of 19th century by collecting samples from sea bottom (Eleftheriou, 2013). However, sampling techniques such as grab and trawl are not sufficient to characterize biological patterns and processes (Van Rein et al., 2009). Even though these techniques provide detailed information in small scale, they are not operable to present biological characteristics of the sea floor in large scales (Brown et al., 2011).
Optical remote sensing products which are cost effective and have wide coverage areas, have been benefited in sublittoral researches with the advances in remote sensing techniques
(Franklin, 2010). Since penetration of light in water is poor, these research are limited in shallow coastal areas (Brown et al., 2011).
Landsat satellite images are widely used in sea grass detection, aerial coverage, distribution mapping, extent and biomass change detection studies (Hossain et al., 2015a). Misbari and Hashim have used Landsat 7 TM and Landsat 8 OLI images to detect changes in sea grass cover by calculating biomass in Malaysia’s shallow waters (Misbari and Hashim, 2016). Hossain et. al. have evaluated Landsat 7 image enchantment techniques for seagrass detection and distribution mapping (Hossain et al., 2015b). Pahlevan et. al. have analysed radiometric performance of Landsat 8 OLI images for aquatic applications (Pahlevan et al., 2014).
In this study, it is aimed to map seagrass cover using Landsat 8 OLI images’ visible bands in a coastal area in Mediterranean, Turkey. After pre-processing of Landsat image, support vector machine (SVM) supervised classification technique will be applied using underwater photos and videos as training and testing data.
2. STUDY AREA
Study area is located at Gulluk Gulf in Mediterranean coast of Turkey where seagrass densely populated (Figure 1). P.ocenica
are usually found in the depths higher than 50 meters due to their need for sunlight. Therefore, extent of the study area has been drawn close to shoreline. Accordingly, the existence of thermal power plant in the area is another factor for the selection of study area. The power plant threats habitat of seagrass in the area by releasing hot water to sea. So, it is essential to map current status of seagrass cover of this area.
The International Archives of the Photogrammetry, Remote Sensing and Spatial Information Sciences, Volume XLI-B8, 2016 XXIII ISPRS Congress, 12–19 July 2016, Prague, Czech Republic
This contribution has been peer-reviewed.
Figure 1. Study area
3. DATA AND METHOD
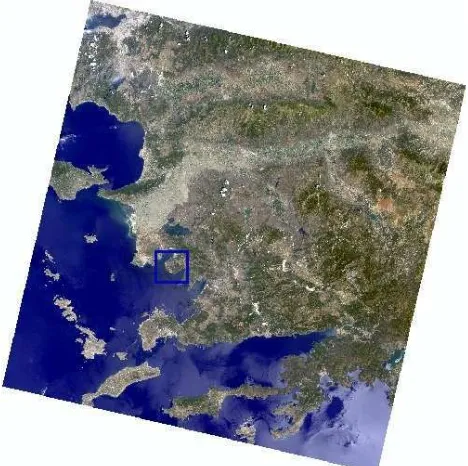
Landsat 8 OLI image acquired on 18.06.2015 have been obtained from United States Geological Survey (USGS). Full scene can be viewed in Figure 2. Landsat 8 OLI images consist of 11 spectral band with geometric resolution of 30 meters for RGB bands. Please note that only red, green and blue bands which correspond to band 2, 3 and 4 of Landsat image have been processed within the scope of this study.
Figure 2. Landsat 8 OLI image full scene (RGB) General workflow of the study has been given in Figure 3. Landsat images need to be pre-processed before classification operation. Image pixels need to be converted to radiance from digital numbers (DN), for the first step of pre-processing. This conversion is performed using following formula:
ܮఒ=ܯ×ܳ+ܣ (1)
Figure 3. General workflow of the study where Lλ = spectral radiance
ML = radiance multiplicative scaling factor Qcal = Level 1 pixel value in DN
AL = Radiance additive scaling factor
The following formula can be used for conversion from DN to reflectance:
ߣᇱ=ܯ
×ܳ+ܣ (2)
where pλ’ = Spectral Reflectance
Mp = Reflectance multiplicative scaling factor Qcal = Level 1 pixel value in DN
Ap = Reflectance additive scaling factor
However, true reflectance cannot be obtained by this formula, since it does not contain correction for solar elevation angle (L8 Handbook, 2015). Therefore, radiance values are converted to reflectance using Fast Line-of-sight Atmospheric Analysis of Hypercubes (FLAASH) in ENVI software which requires radiance image as input. FLAASH is tool that corrects wavelengths in the visible through near-infrared using MODTRAN4 (Berk et al., 1987).
Full scene Landsat image have been subsetted to study area and land area in the subsetted scene have been masked out, for the final step before classification.
Underwater videos and photos have been used for training and testing data. They have been collected as transects using GPS. Sample scene captured from underwater video can be seen in Figure 4.
Figure 4. Seagrass
The International Archives of the Photogrammetry, Remote Sensing and Spatial Information Sciences, Volume XLI-B8, 2016 XXIII ISPRS Congress, 12–19 July 2016, Prague, Czech Republic
This contribution has been peer-reviewed.
Classification processes have been performed using SVM supervised classification method. SVM aims to determine the location of decision boundaries to separate classes using a decision surface called optimal hyperplane (Pal and Mather, 2005; Vapnik, 2013). SVM machine learning algorithm works with different kernel types but generally radial basis function (RBF) kernel is a reasonable first choice. RBF kernel nonlinearly maps samples into a higher dimensional space, has low number of hyperparameters which influences the complexity of model selection and has fewer numerical difficulties (Hsu et al., 2003; Vapnik, 2013). The mathematical representation of RBF kernel is as follows:
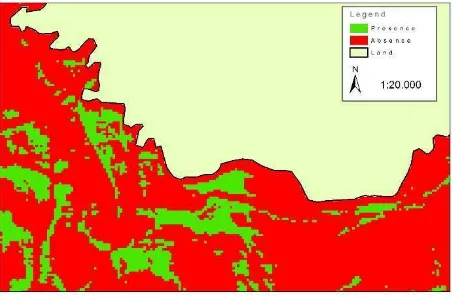
SVM classifier has been trained by GPS locations of underwater samples. This procedure has been performed for each two classes that are ‘Seagrass Presence’ and ‘Seagrass Absence’. Following training, Landsat image has been classified using RBF kernel with γ and penalty parameters taken as 0,333 and 100, respectively. Final classification map can be viewed in Figure 5.
Figure 5. Final seagrass cover map (Green = Presence, Red =
Absence)
A total area of 13.75 kilometre square has been classified. Seagrass seems to be present at the %18.3 of study area. Rest of the area mostly consists of sand.
Overall accuracy of the classification has been calculated as %71.05 which is acceptable for aquatic applications. Using near infrared band of Landsat image may increase accuracy.
5. CONCLUSIONS
In this study, seagrass cover maps have been produced using Landsat 8 OLI image using SVM supervised classification and underwater samples in a coastal area in Gulluk Gulf in Mediterranean of Turkey. The study shows that Landsat 8 OLI images provide enough classification accuracy for seagrass mapping in the study area.
For the future work, a more detailed percentage cover map can be produced and it would be more efficient to manage seagrass ecosystem using Landsat time series to monitor changes.
REFERENCES
Berk, A., Bernstein, L.S., Robertson, D.C., 1987. MODTRAN: A moderate resolution model for LOWTRAN. DTIC Document.
Brown, C.J., Smith, S.J., Lawton, P., Anderson, J.T., 2011. Benthic habitat mapping: A review of progress towards improved understanding of the spatial ecology of the seafloor using acoustic techniques. Estuarine, Coastal and Shelf Science, 92, pp. 502-520.
Eleftheriou, A., 2013. Methods for the study of marine benthos. John Wiley & Sons.
Franklin, J., 2010. Mapping species distributions: spatial inference and prediction. Cambridge University Press.
Halpern, B.S., Walbridge, S., Selkoe, K.A., Kappel, C.V., Micheli, F., D'Agrosa, C., Bruno, J.F., Casey, K.S., Ebert, C., Fox, H.E., Fujita, R., Heinemann, D., Lenihan, H.S., Madin, E.M.P., Perry, M.T., Selig, E.R., Spalding, M., Steneck, R., Watson, R., 2008. A Global Map of Human Impact on Marine Ecosystems. Science, 319, pp. 948-952.
Hossain, M.S., Bujang, J.S., Zakaria, M.H., Hashim, M., 2015a. Application of Landsat images to seagrass areal cover change analysis for Lawas, Terengganu and Kelantan of Malaysia.
Continental Shelf Research, 110, pp. 124-148.
Hossain, M.S., Sidik, B.J., Harah, Z.M., 2015b. Landsat image enhancement techniques for subtidal and intertidal seagrass detection and distribution mapping in the coastal waters of Sungai Pulai estuary, Malaysia. Coastal marine science, 38, pp. 27-41
Hsu, C.-W., Chang, C.-C., Lin, C.-J., 2003. A practical guide to support vector classification.
Misbari, S., Hashim, M., 2016. Change Detection of Submerged Seagrass Biomass in Shallow Coastal Water. Remote Sensing 8. Pahlevan, N., Lee, Z., Wei, J., Schaaf, C.B., Schott, J.R., Berk, A., 2014. On-orbit radiometric characterization of OLI (Landsat-8) for applications in aquatic remote sensing. Remote Sensing of Environment, 154, pp. 272-284.
Pal, M., Mather, P.M., 2005. Support vector machines for classification in remote sensing. International Journal of Remote Sensing, 26, pp. 1007-1011.
Van Rein, H.B., Brown, C.J., Quinn, R., Breen, J., 2009. A review of sublittoral monitoring methods in temperate waters: a focus on scale. Underwater Technology, 28, pp. 99-113.
Vapnik, V., 2013. The nature of statistical learning theory.
Springer Science & Business Media.
Worm, B., Barbier, E.B., Beaumont, N., Duffy, J.E., Folke, C., Halpern, B.S., Jackson, J.B.C., Lotze, H.K., Micheli, F., Palumbi, S.R., Sala, E., Selkoe, K.A., Stachowicz, J.J., Watson, R., 2006. Impacts of Biodiversity Loss on Ocean Ecosystem Services.
Science, 314, pp. 787-790.
Wright, D.J., Heyman, W.D., 2008. Introduction to the Special Issue: Marine and Coastal GIS for Geomorphology, Habitat Mapping, and Marine Reserves. Marine Geodesy, 31, pp. 223-230.
The International Archives of the Photogrammetry, Remote Sensing and Spatial Information Sciences, Volume XLI-B8, 2016 XXIII ISPRS Congress, 12–19 July 2016, Prague, Czech Republic
This contribution has been peer-reviewed.