AUTOMATED REGISTRATION OF IMAGES FROM MULTIPLE
RESOURCESAT-2
- CAMERA
P. V. Radhadevi a, * , S. S. Solanki b,M.V. Jyothi c, Geeta Varadan
Advanced Data Processing Research Institute Dept. of Space, Manovikas Nagar P.O., Secunderabad-9 a
[email protected], b [email protected], c [email protected]
KEY WORDS: Co-registration, in-flight calibration, sensor model, orbit-aligned, attitude exploitation
ABSTRACT:
Continuous and automated co-registration and geo-tagging of images from multiple bands of Liss-4 camera is one of the interesting challenges of Resourcesat-2 data processing. Three arrays of the Liss-4 camera are physically separated in the focal plane in along-track direction. Thus, same line on the ground will be imaged by extreme bands with a time interval of as much as 2.1 seconds. During this time, the satellite would have covered a distance of about 14 km on the ground and the earth would have rotated through
an angle of 30”. A yaw steering is done to compensate the earth rotation effects, thus ensuring a first level registration between the bands. But this will not do a perfect co-registration because of the attitude fluctuations, satellite movement, terrain topography, PSM steering and small variations in the angular placement of the CCD lines (from the pre-launch values) in the focal plane. This paper describes an algorithm based on the viewing geometry of the satellite to do an automatic band to band registration of Liss-4 MX image of Resourcesat-2 in Level 1A. The algorithm is using the principles of photogrammetric collinearity equations. The model employs an orbit trajectory and attitude fitting with polynomials. Then, a direct geo-referencing with a global DEM with which every pixel in the middle band is mapped to a particular position on the surface of the earth with the given attitude. Attitude is estimated by interpolating measurement data obtained from star sensors and gyros, which are sampled at low frequency. When the sampling rate of attitude information is low compared to the frequency of jitter or micro-vibration, images processed by geometric correction suffer from distortion. Therefore, a set of conjugate points are identified between the bands to perform a relative attitude error estimation and correction which will ensure the internal accuracy and co-registration of bands. Accurate calculation of the exterior orientation parameters with GCPs is not required. Instead, the relative line of sight vector of each detector in different bands in relation to the payload is addressed. With this method a band to band registration accuracy of better than 0.3 pixels could be achieved even in high hill areas.
1. INTRODUCTION
Resourcesat-2 (RS-2) ground segment is fully operational since on-orbit acceptance (October 2011). This satellite is intended to continue the remote sensing data services to global users provided by IRS-P6 (RS-1) with enhanced performance. Details about the camera systems of IRS-P6 are available in [Radhadevi, 2008, 2009]. Important changes in RS-2 compared to RS-1 are: Enhancement of LISS-4 (L4) multispectral swath from 23 km to 70 km and improved radiometric accuracy from 7 bits to 10 bits for LISS-3 (L3) and L-4 and 10 bits to 12 bits for AWIFS (AWF). Even though wide swath of 70 km is advantageous, the band to band mis-registration errors along the periphery of the image also will be increased compared to narrow swath.
Co-registration using the imaging geometry and auxiliary data is achieved indirectly by registering each band to a common co-ordinate system on the ground or relatively to a common reference. Theiler et al., 2002, explain automated co-registration of Multi spectral Thermal Imager (MTI) bands using photogrammetric methods. They have also reported the automated image registration of MTI imagery through entirely image-based methods. Initially these two approaches were developed as parallel methods for co-registration, later they were combined in to a more hybrid approach (Pope et al., 2003). Co-registration and in-flight calibration updates of MISR (Multi-angle Imaging Spectro Radiometer) imagery is explained by Jovanovic, 2002.
The development of an automatic registration method for different bands, benefiting from the same orbit acquisition and imaging geometry is explained in this paper. Taking advantage of the information of the camera and the satellite, a ground processing makes the estimation and correction process much simpler to achieve even to sub pixel level co-registration. Conjugate points identified between the
bands are used as “relative GCPs “ to refine the attitude
information between them.
The software collates the output of extreme bands with respect to middle band by rewriting extreme bands, keeping middle band untouched. And to do this, viewing geometry and inter image relation is exploited by means of image matching but in very limited way unlike total image based registration method. This is necessary to update the information on satellite position and orientation which is acquired by satellite navigation system during image acquisition with the help of image itself which provides the measure of mis-registration visually. The conjugate points are used to derive attitude correction required for extreme bands to register with central band. The resulted co-registered products will be orbit aligned and is ready for further processing.
2. BBR FACTORS LEADING TO NEW HYBRID APPROACH
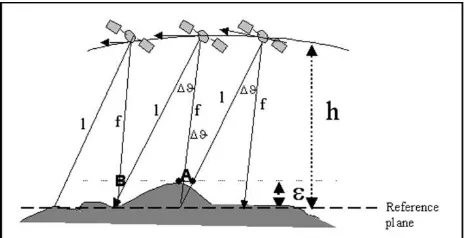
2.1 Elevation effects
Mis-specified elevation introduces an error in co-registration. Fig. 1 illustrates this effect. If the elevation above sea level is in error by an amount , then the mis-registration error will be ( tan ) = sec2 , where is the angle off-nadir. For RS2 L4 image, nadir look with an altitude error of 1km, would lead to a band-to-band offset on ground to 16.8m or 2.9 pixels. On highly undulating terrain like Himalayas, error would be more. This will reflect as mis-registration in the along-track direction. These elevation differences as they are not uniform, will reflect as non-uniform offsets along the satellite track as shown in Fig. 1. (Points A and B have different offsets as they are at different heights over the reference plane). Incorporating the knowledge about terrain height in the geometric model is used to overcome this. While projecting a particular pixel in the array on to ground, the height of the ground point is extracted from a public domain DEM so that shift due to terrain undulation is minimized. The accuracy of the DEM is not very critical because we are determining the relative shift between the bands and not the absolute accuracy of the line of sight vector. Table 1. shows BBR effect due to PSM steering and height.
Figure 1. Effect of Altitude variations on band to band offsets
Table 1. Band to band mis-registration (in pixels) in L4MX with different PSM (Payload Steering Mechanism) steering angles
and heights
2.2 On-board measurement system
Apart from all the factors mentioned above there is one inherent reason for BBR presence, and that is on-board measuring system and their sampling. There are different system which
records satellite time, position and attitude during image acquisition like GPS, navigation system, gyros, clock for time stamping and star sensor. Due to these measuring system specified limits platform behaviour will not be captured and will result in BBR. The original sampling frequencies of orbit, star sensor and gyro rate are 1Hz, 2Hz and 8 Hz respectively. Therefore, any attitude variation with a frequency of > 1Hz (half of 2Hz) may reduce the image positioning accuracy. Also, attitude data are recorded using a unit of 0.0075deg. Thus, any value which is a non-integer multiple of 0.0075 cannot be accurately recorded. The BBR accuracy is specified to be less than 0.25 pixel distortion which is equivalent to an attitude deviation of 1.0169 x 10⁻⁴ deg. Therefore, requirement translates to an attitude change not to exceed 1.0169 x 10⁻⁴ deg. in 1.05 sec. and 2.1 sec. Assuming spacecraft rate to be constant , the rate should not exceed (1.0169 x 10⁻⁴/2.1)= 4.8 x 10⁻⁵ deg./sec. to restrict pixel distortions between first and last CCD arrays. But, the attitude information coming from the on-board system is not meeting this specification. The BBR effect due to this uncertainty will be dynamic and cannot be controlled even if all above said factors are taken care. This can only be controlled if image data itself is used to estimate attitude fluctuation as Time resolution is considerably higher than the attitude data. Therefore, using the mis-registration information between the bands of MX, attitude information can be corrected with a higher sampling rate of up to 1138HZ. Precisely, for this reason we have gone for automatic hybrid co-registration approach wherein all systematic variation are taken care by in-flight calibrated geometric sensor model and varying factors are controlled by external public DEM and residual attitude estimation and correction model based on limited controlled image matching.
3. GEOMETRY-BASED CO-REGISTRATION (WITH RESIDUAL ATTITUDE CORRECTION)
The bore sight is located near to Central band. Separation between the extreme bands is about 2359 lines. There is a time delay of 2.1 sec in imaging the same ground point in extreme bands. Although viewing geometries encountered under operational conditions vary substantially from one image to another, especially for off-nadir images, the same timing sequence is used for each image acquisition. This leads to varying band-to-band alignments. As explained in the previous section, largest source of mis-registration is due to uncertainties in the information about the platform during image acquisition.
Co-registration of images acquired by different bands of the same sensor imaged with a time gap is a process through which the spatial address of pixels in the images for same ground point is made same. That means feature imaged in one band is located in the same row and column in the other bands after co-registration. This is the basic requirement in the case of multi spectral data for better image analysis and classification. L3 and AWF data of RS2 does not have serious band-to-band offsets as different bands are aligned in the focal plane unlike in the case of L4. Geometry-based approach is adopted for co-registration of L4 bands that accounts for the offsets arise from the imaging geometry and terrain undulations.
Different levels of applications are envisaged with the co-registered data. Data selection through browsing, data for texture draping application, data input to interpretation and classification, input to fly through, cartographic applications etc. are some of them. The volume of data in the case of full pass processing is very high. These huge data volumes are to be handled with intelligence in processing and storage. From this view, we suggest and explain the procedure of co-registered The International Archives of the Photogrammetry, Remote Sensing and Spatial Information Sciences, Volume XL-8, 2014
products, viz., orbit-aligned. Schema for automated band-to-band registered product generation is shown in Fig.2.
Figure 2. Schema for automated band to band orbit align product generation for Liss-4
3.1 Orbit Align Co-registration
In this paper, we explain the automatic hybrid approach of co-registration to result orbit aligned product and in such product the orbit-aligned frame, y-axis is aligned to the direction of the satellite. It is always approximately northward with a small alignment angle. This is the default mode of co-registered product generation. In orbit-aligned products, middle band is untouched and extreme bands are aligned with respect to the middle band, minimizing the resampling artifacts. Thus, original raw geometry of central band is preserved. Data handling aspects are also taken care. It requires less memory as less padding is there around the edges. Orbit-aligned product is sufficient for most of the upcoming applications in computer based visualization, data browsing, temporal data analysis etc. Below we are explaining the steps to generate orbit align product, pictorial representation of which is given in the form of flow diagram as fig. 2.
The steps involved in generating orbit-aligned co-registered products are
1. In-flight camera calibration (carried out during the commissioning phase of the satellite)
For computation of post alignment angles and reassigning effective focal length in-flight calibration is carried out rigorously once during ground segment. This readjustment is done to ascertain all systematic errors are taken care. This procedure is done once during Initial phase operation of mission commissioning, but is kept under check by periodic evaluation. Detailed in-flight calibration methodology of different cameras of IRS-P6 is
2. Orbit attitude modeling (Rigorous sensor
model-RSM without GCP’s)
For attaining co-registration through geometry-based methods, development of a sensor model is essential. The algorithm for orbit attitude model, which combines the principles of viewing geometry of the satellite with photogrammetric collinearity equations, was initially developed for SPOT-1 and IRS-1C/D [Radhadevi et al., 1994, Radhadevi, 1998]. This model has been adapted to suit the L4 camera characteristics of RS2. In order to do direct geo-referencing, the spacecraft navigation and attitude data must be known. The information connected to the corresponding ground coordinate and image coordinate through collinearity equations. Collinearity equations express the fundamental relationship that the perspective centre, image point and object point lay on the straight line. Thus, for RS2, a pixel in any array (odd or even) of any band of L4 can be projected onto earth through a series of transformations and re-projected back to any other band/array through a reverse series of transformations using the parameters of the corresponding cameras in the rotation matrix and thereby fixing the relative positions of individual arrays in the focal plane. Payload to body biases of each camera is computed during the in-flight calibration and correct residuals are included in the rotation matrix. The series of rotations a pixel undergoes before it is projected on to the ground is shown in Fig. 3. Details about the rigorous sensor model are available in Nagasubramanian et.al. 2007. The viewing geometry is established on ground using RSM for given satellite ephemeris data. This also establish image to ground and reverse photogrammetric transformation
Figure 3. Series of transformation to convert a pixel to ground co-ordinates
3. Inter image relation (conjugate point matching) -This step practically measures the mis-registration present in multispectral image data. For estimating this we fix three columns in start, middle and end of The International Archives of the Photogrammetry, Remote Sensing and Spatial Information Sciences, Volume XL-8, 2014
swath direction and perform similarity measure operation based on mutual information technique to identify match at regular interval between extreme and central band in pair. Basically, three columns are chosen to get at least one sample match per interval.
4. Extract height
- using RSM compute ground location for central band match candidate point and extract height from public DEM for this computed ground point. Attach this height to match point identified in extreme bands.
5. Blunder / mismatch check
-Perform filtering of error match with the help of RSM. For this we do image to ground transformation from matched conjugate points and compute ground points independently for all matched pair. Construct frequency histogram and identify mode interval. Using this mode retain points within some prefixed threshold of say 5 to 10 pixels and drop rest.
6. Compute attitude correction
-Make GCPs from filtered conjugate image points in extreme bands and ground coordinate from central band and corresponding extracted height from public DEM. Use this relative GCPs between pair i.e. between leading and central band, lagging and central band, and compute difference in attitude (roll-pitch only and not yaw) required for correction using RSM.
7. Fit 3rd order polynomial for these roll and pitch differences against time.
8. Grid formation
-Construct regular image coordinate grid over central band and compute ground coordinate using image to ground transformation. Extract height for this ground grid. Again using this height compute ground coordinate for same central band image grid. Using this final ground grid compute image coordinate grid in leading and lagging bands by means of ground to image transformation. But while computing image coordinates in leading and lagging bands apply fitted roll and pitch corrections differences also along with the nominal roll and pitch values.
9. Resample leading and lagging bands
-Rewrite leading and lagging bands by grid based resampling. In this process central band is untouched and preserved in its original form. And if one requires to keep histogram un-altered for resampled band then it should be done using nearest neighbour resampling while rewriting bands. But for best performance cubic-convolution or sinc interpolation is recommended.
The resulted product will be orbit aligned product with optimal BBR correction and ready for further photogrammetric operation as central band geometry is untouched. This whole process is automized and in-order to drive optimal time performance it can be parallelized to exploit system available cores.
4. TEST AND EVALUATION
4.1 Test Data
Twenty four data sets are chosen for the analysis such that different terrain types- plain, costal, moderate, hilly and highly undulating is covered. Images with different look angles are considered to study the combined effect of look angle and terrain undulation on BBR. Details like orbit number, look angle, and the terrain undulation over which the imaging is done are shown in Table 2. Data is arranged in the order of the look angle.
4.2 Evaluation procedure
Co-registration procedures explained in section 3 is implemented as pre-processing step in the product generation scheme. Quality assessment of the products is a routine and automatic process. The evaluation module is also a part of the product generation software. Image-based automated matching does evaluation of BBR accuracy of the products. Central band is taken as reference and the other two extreme bands are evaluated with respect to this. Regular grid based image matching, so that no area is left unchecked, is adopted for this purpose. Cloudy and homogeneous areas are avoided from matching by entropy based area selection. Robust mutual information being the measure of similarity between the bands, points with high confidence (threshold greater than 0.8) are considered for least square matching which yields sub pixel level accuracies. The offsets are computed from the statistics of the match-point data. The number of points is very high that raises the confidence in the arrived values.
5. CONCLUSIONS
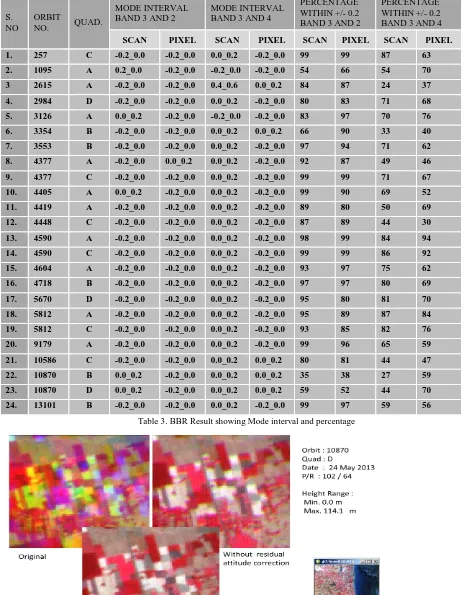
In this paper we have developed and implemented a method for automatic co-registration of multiple bands of L4 camera of RS2 which is different from the approach adopted for resourcesat-1 (IRS-P6 LISS4). Details can be referred in our paper Radhadevi & Solanki, 2008. Both procedures involves photogrammetric means but in P6 (swath 23 Kms.) it was bias adjustment along with RSM model whereas, for RS2 it is more involved process than bias adjustment. Here it infers attitude correction required form image itself which has better sampling interval than attitude information available from on board sensor. More over this method has reduced largely attempts required to remove unaccounted mis-registration residuals by image processing based technique, like thin-plate interpolation correction, later. An in-flight geometric calibration of the detector elements in the focal plane is the first pre-requisite for defining the direction and orientation of the imaging ray originating from a pixel and projected on to the correct ground location. Forward or inverse transformation between the co-ordinate systems connecting the orbit, attitude, focal plane and terrain with accurate time tagging is the second requirement. Success percentage is close to 95% and method is modular to process it in parallel to utilize system capability. It also makes it suitable to process in near real time. BBR accuracies of the order of less than 0.2 to 0.3 pixels could be achieved in all cases. Result shown in table 3 and figure 4,5. From table 3 we can observe that match percentage is slightly poor though mode interval is +/-0.2 for lagging (band4) and central (band3) band as band4 is near infrared whereas band3 is optical.
Table 2. Test data sets details
6. ACKNOWLEDGEMENTS
The authors gratefully acknowledge Shri. R Ramachandran, Associate Director and Dr. J Saibaba, Deputy Director (SDAA), ADRIN for their encouragement and support for this work.
REFERENCES
Radhadevi, P. V., Solanki, S. S., Nagasubramanian, V., and Jyothi, M. V., Automatic Co-Registration of multiple bands of IRS-P6 Liss-4 camera. ISPRS Journal of Photogrammetry & Remote Sensing, 64, pp 17-26, 2009.
Jyothi, M. V., Radhadevi, P. V., Solanki, S. S., Topographic Data Bases in the Product Generation of IRS P6 Liss-4 Imagery. ISPRS Journal of Photogrammetry & Remote Sensing, Vol. 63, pp. 322-332., 2008.
Radhadevi, P. V., and Solanki, S. S., In-flight geometric calibration of multiple camera of IRS-P6. Photogrammetric Record, 23(121), 69-89, 2008.
Nagasubramanian V., Radhadevi P.V., Ramachandran R. and Krishnan R.. Rational function model for sensor orientation of IRS-P6 Liss-4 imagery. The Photogrammetric Record, 22(120),pp 309-320, 2007.
Pope, P.A., Theiler, J.P., and Galbraith, A.E., 2003.LANL experience with co registration of MTI imagery. Proceedings of the SPIE, 5159, pp139-146.
Jovanovic, V M, 2002, MISR Automatic Geometric Quality Assessment and In-flight Geometric Calibration Updates, International Archives of Photogrammetry, Remote Sensing and Spatial Information Sciences, 34,part1.
Theiler, J.P., Galbraith, A.E., Pope, P.A., Ramsey, K.A. and Szymanski, J.J., 2002. Automated Coregistration of MTI Spectral Bands. Proceedings of the SPIE, 4725(37), pp314-327. Radhadevi, P. V., Ramachandran, R. and Murali Mohan, ASRKV, 1998.Restitution of IRS-1C PAN data using an Orbit Attitude Model and minimum control. ISPRS Journal of Photogrammetry and Remote Sensing, 53, pp 262-271.
Radhadevi, P. V. and Ramachandran, R., 1994. Orbit Attitude Modelling of SPOT imagery with a Single Ground Control Point. Photogrammetric Record, 14(84), 1994, pp973-982. Data
set
Orbit
no. Quad.
Date of Pass
Tilt Angle (deg.)
Height Range (m)
1 257 C 8/5/2011 9.82 374 - 662
2 1095 A 6/7/2011 0 3407 - 6442
3 2615 A 21/10/2011 -2.44 87 - 877
4 2984 D 16/11/2011 2.15 31 - 1232
5 3126 A 26/11/2011 -2.25 171 - 2325
6 3354 B 12/12/2011 2.18 0 - 1821
7 3553 B 26/12/2011 2.24 234 - 708
8 4377 A 22/02/2012 -2.4 0 - 751
9 4377 C 22/02/2012 -2.4 30 - 828
10 4405 A 24/02/2012 -2.43 20 - 575
11 4419 A 25/02/2012 -2.39 40 - 1763
12 4448 C 27/02/2012 -2.37 0 - 1844
13 4590 A 8/3/2012 -2.33 380 - 705
14 4590 C 8/3/2012 -2.33 375 - 652
15 4604 A 9/3/2012 -2.31 121 - 968
16 4718 B 17/03/2012 2.23 511 - 877
17 5670 D 23/05/2012 2.3 522 - 922
18 5812 A 2/6/2012 -2.27 434 - 801
19 5812 C 2/6/2012 -2.27 490 - 837
20 9179 A 25/01/2013 -2.19 21 - 571
21 10586 C 4/5/2013 -2.19 223 - 2992
22 10870 B 24/05/2013 2.31 0 - 84
23 10870 D 24/05/2013 2.31 0 - 114
24 13101 B 28/10/2013 2.42 235 - 592
S. NO
ORBIT
NO. QUAD.
MODE INTERVAL BAND 3 AND 2
MODE INTERVAL BAND 3 AND 4
PERCENTAGE WITHIN +/- 0.2 BAND 3 AND 2
PERCENTAGE WITHIN +/- 0.2 BAND 3 AND 4
SCAN PIXEL SCAN PIXEL SCAN PIXEL SCAN PIXEL
1. 257 C -0.2_0.0 -0.2_0.0 0.0_0.2 -0.2_0.0 99 99 87 63
2. 1095 A 0.2_0.0 -0.2_0.0 -0.2_0.0 -0.2_0.0 54 66 54 70
3 2615 A -0.2_0.0 -0.2_0.0 0.4_0.6 0.0_0.2 84 87 24 37
4. 2984 D -0.2_0.0 -0.2_0.0 0.0_0.2 -0.2_0.0 80 83 71 68
5. 3126 A 0.0_0.2 -0.2_0.0 -0.2_0.0 -0.2_0.0 83 97 70 76
6. 3354 B -0.2_0.0 -0.2_0.0 0.0_0.2 0.0_0.2 66 90 33 40
7. 3553 B -0.2_0.0 -0.2_0.0 0.0_0.2 -0.2_0.0 97 94 71 62
8. 4377 A -0.2_0.0 0.0_0.2 0.0_0.2 -0.2_0.0 92 87 49 46
9. 4377 C -0.2_0.0 -0.2_0.0 0.0_0.2 -0.2_0.0 99 99 71 67
10. 4405 A 0.0_0.2 -0.2_0.0 0.0_0.2 -0.2_0.0 99 90 69 52
11. 4419 A -0.2_0.0 -0.2_0.0 0.0_0.2 -0.2_0.0 89 80 50 69
12. 4448 C -0.2_0.0 -0.2_0.0 0.0_0.2 -0.2_0.0 87 89 44 30
13. 4590 A -0.2_0.0 -0.2_0.0 0.0_0.2 -0.2_0.0 98 99 84 94
14. 4590 C -0.2_0.0 -0.2_0.0 0.0_0.2 -0.2_0.0 99 99 86 92
15. 4604 A -0.2_0.0 -0.2_0.0 0.0_0.2 -0.2_0.0 93 97 75 62
16. 4718 B -0.2_0.0 -0.2_0.0 0.0_0.2 -0.2_0.0 97 97 80 69
17. 5670 D -0.2_0.0 -0.2_0.0 0.0_0.2 -0.2_0.0 95 80 81 70
18. 5812 A -0.2_0.0 -0.2_0.0 0.0_0.2 -0.2_0.0 95 89 87 84
19. 5812 C -0.2_0.0 -0.2_0.0 0.0_0.2 -0.2_0.0 93 85 82 76
20. 9179 A -0.2_0.0 -0.2_0.0 0.0_0.2 -0.2_0.0 99 96 65 59
21. 10586 C -0.2_0.0 -0.2_0.0 0.0_0.2 0.0_0.2 80 81 44 47
22. 10870 B 0.0_0.2 -0.2_0.0 0.0_0.2 0.0_0.2 35 38 27 59
23. 10870 D 0.0_0.2 -0.2_0.0 0.0_0.2 0.0_0.2 59 52 44 70
24. 13101 B -0.2_0.0 -0.2_0.0 0.0_0.2 -0.2_0.0 99 97 59 56
Table 3. BBR Result showing Mode interval and percentage
Figure 4. Orbit align product.
(a)
(b)
(c)
(d)
Before correction (Raw level-1) Orbit align BBR corrected product
(e)
(f)
(g)
(h)
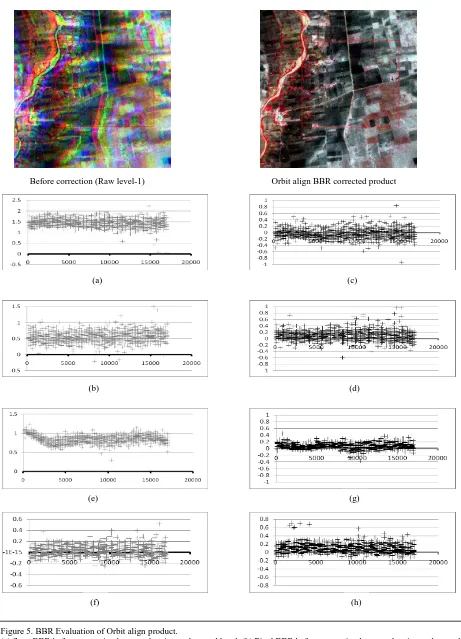
Figure 5. BBR Evaluation of Orbit align product.
(a) Scan BBR before correction between lagging and central band, (b) Pixel BBR before correction between lagging and central band (c) Scan BBR after correction between lagging and central band, (d) Pixel BBR after correction between lagging and central band (e) Scan BBR before correction between leading and central band, (f) Pixel BBR before correction between leading and central band (g) Scan BBR after correction between leading and central band, (h) Pixel BBR after correction between leading and central band X- axis is scanline no. Y-axis is BBR in pixel unit