OPTIMIZING THE DISTRIBUTION OF TIE POINTS FOR THE BUNDLE ADJUSTMENT
OF HRSC IMAGE MOSAICS
J. Bostelmann∗, U. Breitkopf, C. Heipke Institute of Photogrammetry and GeoInformation (IPI)
Leibniz Universit¨at Hannover Nienburger Str.1, D-30167 Hannover, Germany
Commission III, ICWG III/II
KEY WORDS:Planetary Mapping, Mars, HRSC, Bundle Adjustment, Tie Points
ABSTRACT:
For a systematic mapping of the Martian surface, the Mars Express orbiter is equipped with a multi-line scanner: Since the beginning of 2004 the High Resolution Stereo Camera (HRSC) regularly acquires long image strips. By now more than 4,000 strips covering nearly the whole planet are available. Due to the nine channels, each with different viewing direction, and partly with different optical filters, each strip provides 3D and color information and allows the generation of digital terrain models (DTMs) and orthophotos. To map larger regions, neighboring HRSC strips can be combined to build DTM and orthophoto mosaics. The global mapping scheme Mars Chart 30 is used to define the extent of these mosaics. In order to avoid unreasonably large data volumes, each MC-30 tile is divided into two parts, combining about 90 strips each. To ensure a seamless fit of these strips, several radiometric and geometric corrections are applied in the photogrammetric process. A simultaneous bundle adjustment of all strips as a block is carried out to estimate their precise exterior orientation. Because size, position, resolution and image quality of the strips in these blocks are heterogeneous, also the quality and distribution of the tie points vary. In absence of ground control points, heights of a global terrain model are used as reference information, and for this task a regular distribution of these tie points is preferable. Besides, their total number should be limited because of computational reasons.
In this paper, we present an algorithm, which optimizes the distribution of tie points under these constraints. A large number of tie points used as input is reduced without affecting the geometric stability of the block by preserving connections between strips. This stability is achieved by using a regular grid in object space and discarding, for each grid cell, points which are redundant for the block adjustment. The set of tie points, filtered by the algorithm, shows a more homogenous distribution and is considerably smaller. Used for the block adjustment, it yields results of equal quality, with significantly shorter computation time. In this work, we present experiments with MC-30 half-tile blocks, which confirm our idea for reaching a stable and faster bundle adjustment. The described method is used for the systematic processing of HRSC data.
1 INTRODUCTION
In the exploration of our solar system the mapping of Mars is an important task. More than 14 years ago the European Space Agency (ESA) sent its first interplanetary mission to our neigh-boring planet: Mars Express was launched on June 2, 2003 and inserted into orbit around Mars on December 25 that same year. One of the scientific instruments on board the orbiter is the High Resolution Stereo Camera (HRSC). This multi-line sensor with five panchromatic and four multi-spectral CCD arrays was veloped by the German Aerospace Center (DLR) specifically de-signed for photogrammetric mapping purposes (Neukum et al., 2004).
The HRSC images the Martian surface with a nominal resolution of 12.5m per pixel. The along-track multi-stereo capability of the camera delivers image strips with three-dimensional information, which cover nearly the whole planet. The different observation angles of the panchromatic images per strip allow photogram-metric object point determination in each recorded image strip (Albertz et al., 2005). Four additional channels provide color in-formation in red, green, blue and near infrared. For a derivation of accurate digital terrain models (DTMs) (Heipke et al., 2007) and orthophotos (Gwinner et al., 2010) the orientation data (position and pointing) of the HRSC is improved via bundle adjustment (Spiegel, 2007). This non-linear least-squares optimization uses a large number of image tie point observations to adjust the param-eters of the exterior orientation (EO) of the camera. The derived
∗Corresponding author
DTMs and orthophotos are regularly released to NASA’s Plan-etary Data System (PDS) and ESA’s PlanPlan-etary Science Archive (PSA) and are used by a large number of scientists, e.g. for geo-logical analysis. A summary of results of the HRSC experiment has been published in (Jaumann et al., 2015).
With the beginning of the systematic mapping of Mars, the United States Geological Survey (USGS) divided the Martian surface into thirty tiles (Batson and Greeley, 2007). This Mars Chart 30 (MC30) tiling scheme is now also used for photogrammetric mapping with HRSC imagery. Because of gaps in the coverage and for reasons of computational efficiency in the current pro-cessing strategy the MC30 tiles (except for the polar tiles) are split into two halves. These MC30 half-tiles define the bound-aries for the generation of large DTM (Gwinner et al., 2015) and orthophoto mosaics (Michael et al., 2016).
Figure 1 shows the first completed multi-orbit mosaic. This half-tile is located in MC-11-E (Oxia Palus, East) and covers an area of about 2.9 millionkm2 (1,330km x 1,780km). The
Figure 1: HRSC color orthophoto mosaic (left), color-coded relief map (center), and nadir orthophoto mosaic (right) of MC-11 (East); about 1330 km x 1780 km in size; resolution: 12.5m (nadir mosaic), 50m (DTM, color mosaic); from (Gwinner et al., 2015)
Additionally, the illumination conditions change from strip to strip depending on time and season when images are taken. Fur-thermore, the image quality is occasionally degraded by haze and sandstorms, and by oscillations of the spacecraft during image acquisition. Thus, the data set of HRSC strips for each block is very heterogeneous (see also Table 1).
Min Mean Max
Nadir resolution [m] 11.1 17.0 55.5
Image length [lines] 2,248 48,827 182,888
Nr. of overlaps [strips] 3 8.3 23
Forward intersection error1[m] 3.3 15.2 41.6
Table 1: Statistics of 98 HRSC image strips located in MC-11-E
Also the distribution of the tie points, needed for the adjustment and found by an automated matching procedure (Schmidt et al., 2008) is heterogeneous (Figure 2b). This is caused by varying
a) b)
Figure 2: a) HRSC image strips in MC-11-E; b) tie points in HRSC image h1183 0000; both showing a irregular, heterogeneous distribution
image texture. However, because the bundle adjustment uses the DTM derived from the Mars Orbiter Laser Altimeter (MOLA) as reference, a homogenous distribution of the tie points is prefer-able (Spiegel, 2007). For a systematic processing of these large
1Mean forward intersection error per strip. Referring to image rays,
used to calculate object points after bundle adjustment of individual strips.
blocks a manual selection of strips and tie points is obviously not desirable. In contrast to other large scale bundle adjustments problems (Hartmann et al., 2016), the image correspondence prob-lem is already solved, due to adequate approximate values for the EO parameters. But setting up matching parameters in advance to obtain a suitable tie point distribution over all areas of the block is hard because of differing image quality. Hence a post-processing step following tie point matching is seen to be more promising. Choosing matching parameters, that produce a large number of tie points an algorithm can subsequently optimize their distribu-tion by reducing the number while keeping the geometric block stability. This can be carried out in image space, as done e.g. in close range photogrammetry (Barazzetti et al., 2010) or, as de-scribed in the following, in object space.
In the next section of this paper an efficient way of processing large HRSC image blocks is described and two different sub-block strategies together with an object space based tie point filter are introduced. Section 3 presents two setups and results of ex-periments to compare the two sub-block strategies and to demon-strate the benefits of a tie point filter. The findings are summa-rized in Section 4 together with an outlook.
2 EFFICIENT BUNDLE ADJUSTMENT OF LARGE
HRSC BLOCKS
2.1 Processing Overview
For the efficient adjustment of large HRSC image blocks, a two-stage photogrammetric work flow has been developed (see Fig-ure 3). First, individual strips are adjusted separately (FigFig-ure 3: left side). The panchromatic images, their nominal EO and the MOLA DTM serve as input to adjust the pointing of the EO. Ini-tially the image data is filtered to remove noise and compression artifacts.
block tp
nominal EO strip BA * STRIP PROCESSING
block adjusted EO
strip matching ortho *
strip evaluation
tie points block matching sub-block tie points ortho * tie point filter block tie points
sub-blocks
Figure 3: Process for the bundle adjustment of HRSC image data
For the subsequent block adjustment, multi-strip tie points are needed. These tie points not only connect the images of one strip, but also images of strips from neighboring orbits. For matching these multi-strip tie points a sub-block strategy is used. Two op-tions how these sub-blocks can be built are described in Section 2.2. For each sub-block the EO and the MOLA DTM are used to resample the filtered images to a common scale and projection. In these orthophotos the multi-strip tie point matching is applied. The resulting tie points of all sub-blocks are then used for the block adjustment step.
Before the simultaneous bundle adjustment of the block is carried out, the tie point filter, which is introduced in Section 2.3, is em-ployed to optimize the distribution of the tie points. A description of the other methods used in the software modules, depicted as colored, rounded boxes in Figure 3 can be found in (Bostelmann and Heipke, 2014).
2.2 Sub-block strategies for multi-strip tie point matching
Because each strip only overlaps with a limited number of other strips in a block, it is reasonable to use sub-blocks for extract-ing multi-strip tie points, offerextract-ing among others the possibility of parallel processing. In the used concept in each sub-block one primary strip is selected. The nadir image of this strip is used as a ’master’ image for image matching. In this master a regular grid of candidate points is defined. For each of these points the ho-mologous points in the ’slave’ images are searched. Thereby up to five panchromatic images for each secondary strip of the sub-block, and up to four for the primary strip serve as corresponding ’slave’ images. Based on these considerations a first sub-block strategy was developed (Schmidt, 2008). It was suitable for small blocks, having a regular strip arrangement, but led to limitations when processing larger blocks with an irregular arrangement of strips. For this reason two new sub-block strategies were devel-oped and are compared here: one, pairwise, with two strips each and one using multiple strips.
For a graphical explanation of these two sub-block strategies, Fig-ure 4a depicts the footprints of a block of four HRSC image strips, marked with capital letters (A,B,C,D). The associated connectiv-ity graph (Figure 4b) shows, that only one connection, AC, is missing. (Areas framed in red, will be referred to in Section 2.3.)
B
Figure 4: a) Exemplary block of four HRSC image strips (A: h1183 0000, B: h4350 0001, C: h9435 0009, D: ha469 0000); b) corresponding connectivity graph
The primary strip, containing the master image is drawn blue. In the overlapping area of each sub-block, tie points can be observed in up to ten images (five per strip). In the remaining area of the primary strip observations in up to five images are possible.
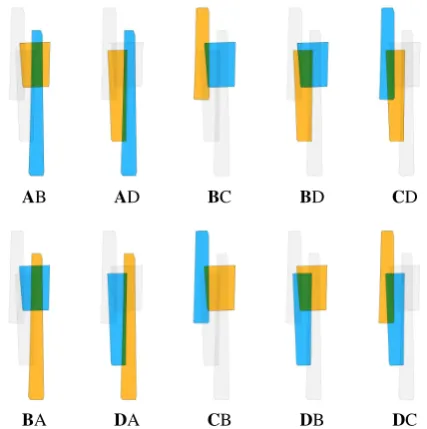
AB AD BC BD CD
BA DA CB DB DC
Figure 5: Pairwise sub-blocks for the block shown in Figure 4; blue: primary strip; orange: secondary strip
Usingmulti-stripsub-blocks, as shown in Figure 6, each strip is selected as primary strip only once. For the same example, this results in four sub-blocks. The number of secondary strips (or-ange) varies, depending on the number of overlapping strips. In this way tie points observed in more than ten images are possible.
ABD BACD CBD DABC
Figure 6: Multi-strip sub-blocks for the block shown in Figure 4; blue: primary strip; orange: secondary strips
Obviously, for a larger block the number of sub-blocks for both options is higher. In terms of systematic processing, the pair-wise option is more practical: computer requirements for each sub-block are more predictable and the results of the sub-block matching can be re-used for other blocks in this area. However, theoretically the multi-strip option with tie points connecting all overlapping strips is preferable. The tie point filter described be-low works with pairwise as well, as with multi-strip sub-blocks. Both options are considered and compared in Section 3.1.
2.3 Tie point filter
The aim of filtering is to optain a more homogenous distribution, while reducing the number of tie points. This is done by using a large number of inhomogeneously distributed points as input and then discarding points which are redundant for the block adjust-ment. The filtering works as follows:
1. All tie points of all sub-blocks are used to calculate their 3D coordinates in a common global coordinate system to-gether with the forward intersection error of all inherent im-age rays.
2. These 3D object points are clustered based on their lateral position using a regular grid. The size of each grid cell is constant and is defined by one parameter for the entire block, which is empirically evaluated in Section 3.1.
3. For each group one or more ‘best points’ are selected, the others are discarded.
The selected ‘best points’ of each grid cell need to fulfill the fol-lowing two criteria: 1) together they should have image observa-tions in the same number of strips, as the union of all points of the grid cell does, and 2) their number should be minimal. The algorithm selects the points with the highest number of con-nections (if there are more than one, the point with the lowest forward intersection error is taken), until all strips are connected.
Figure 7 gives a graphical interpretation of this selection. A graph consisting of tie points and image strips is shown. Again, the im-age strips are labeled with capital letters (ABCD). The tie points are represented by numbers. Each set of seven tie points refers to an area marked in red in Figure 4, which overlaps with two or three strips. For this reason, in each set one or two strips are not connected by tie points.
A B C D
1 2 3 4
image strips
tie points 5 6 7
set 1 )
image strips
tie points set 2 )
image strips
tie points set 3 )
3
1 2 3 4 5 6 7
A B C D
1 2 3 4 5 6 7
A B C D
Figure 7: Example of connections of image strips via tie points; each set refers to an area marked in Figure 4.
In many cases one point connecting all strips (available for this set) is selected as ’best point’ (see tie point 3 circled in blue in set 1). For other cells not all strips are connected by only one tie point. In these cases more than one point is selected (see point 2 and 6 in set 2). When the maximum number of connections is given for more than one tie point, the one with the lowest forward intersection error is chosen (see point 5 in set 3).
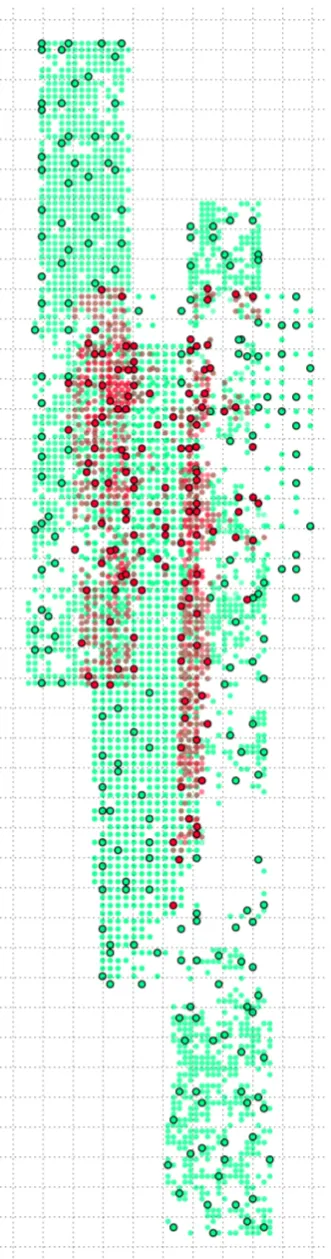
Figure 8: Outlined are 333 of 7742 tie points selected by a filter; in green: single-strip points; in red: multi-strip points; used sub-block option: pairwise; used grid cell size: 64 MEDGR pixel (approx. 30km)
2.4 Block Adjustment and Evaluation
The block adjustment uses the EO adjusted by the strip process-ing as input. For the camera pointprocess-ing and for the height com-ponent no additional improvement is expected. Compared to the strip adjustment the stochastic model is modified in a way that only bias parameters for the lateral position of each strip are esti-mated.
For the evaluation of the block adjustment, the block adjusted EO is compared to the nominal and the strip adjusted EO (see Figure 3). A large number of 3D points are estimated for each case and three measures are used to evaluate the accuracy and precision of each 3D point:
• The forward intersection error assesses the precision.
• The height difference to the MOLA DTM is taken as
mea-sure for the absolute accuracy.
• The forward intersection error of multi-strip tie points
de-tects displacements between neighboring strips.
For a qualitative analysis of individual adjustment results, all three measures are used to generate error maps. This allows e.g. to de-tect systematic errors. For the comparison of multiple data sets, average values are more useful.
3 EXPERIMENTS AND RESULTS
The described method has been applied on a large number of HRSC blocks, including smaller ones for testing and improving the methods, and large MC-30 half tile blocks with up to 100 strips for the development of a new HRSC data product.
In the following, the results of two blocks are presented; firstly to validate the new tie point filter and to demonstrate its improve-ment in efficiency and secondly to answer two questions:
• How does the choice of sub-block strategy (pairwise or
multi-strip) influence the results of the block adjustment?
• How does the size of the grid cells used in the filter (sec. 2.3)
influence the number of tie points and thus the computation time and possibly also the quality of the resulting EO?
For computational reasons elaborate parameter tests have only been carried out with a smaller block containing 19 HRSC strips (Section 3.1). The findings of these tests have subsequently been used to process the block with 98 strips from the MC-11-E half-tile area (Section 3.2).
3.1 Tests on medium sized block (19 HRSC strips)
In Figure 9 footprints of the nadir images are plotted. The medium sized block with 19 strips contains 48 usable pairwise sub-blocks and 19 multi-strip sub-blocks, the latter with up to 10 strips.
16 block adjustments were carried out: eight using the pairwise sub-blocks and eight with multi-strip sub-blocks. Using the same input data only the size of the grid cells for the tie point filter was varied using the following values: 0, 4, 8, 16, 24, 32, 48, 64 (for 0, no filter was used). Because the MOLA DTM is used for evaluation, the size of the grid cells is measured in MEDGR pixel (Smith et al., 2003). One pixel refers to 463m at the equator. Using the largest grid cell size (64 = 29,632m) the filter selects the lowest number of tie points.
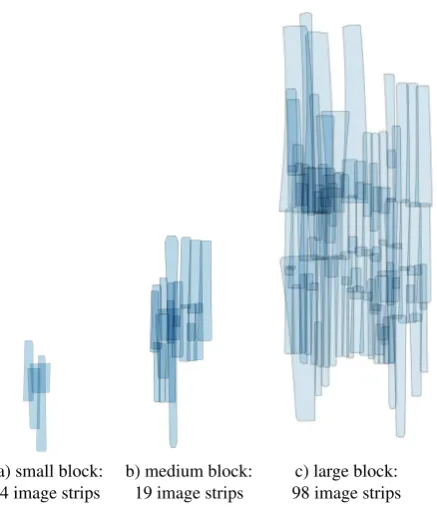
a) small block:
Figure 9: Nadir image footprints of HRSC strips, combined as blocks; a) same as Figure 4 for comparison
sub-blocks is very high. This is caused by the fact that strips are chosen as primary strip more than once, and therefore, in these ar-eas the tie points are highly redundant. With an incrar-easing size of the grid cells the number of selected tie points decreases, whereby the multi-strip sub-blocks led to about 20% less tie points.
0 20 40 60
grid cell size (in MEGDR pixel)
nr
Figure 10: Number of tie points selected by tie point filter
Figure 11 shows a result of the evaluation. The forward intersec-tion error of multi-strip points depicts the improvement of block adjusted EO compared to strip adjusted EO. Using small grid cell sizes both sub-block strategies yield EO with the practically same precision. When using a grid cell size of 24 or larger, the inter-section error increases when using the pairwise option. Using multi-strip sub-blocks the intersection error does not increase un-til the grid cell size is larger than 48. For reference, the red line marks the intersection error of the strip adjusted EO.
Obviously an increase in the intersection error due to tie point filtering should be avoided. So a grid cell larger 48 should not be used. Further, for cell sizes of 24 and smaller no significant difference between pairwise and multi-strip sub-blocks is identi-fiable.
grid cell size (in MEGDR pixel)
intersection
Figure 11: Intersection error of multi-strip tie points
3.2 Results of a large block (MC-11-E; 98 strips)
The current implementation of the sub-block tie point matching is not able to handle multi-strip sub-blocks at a scale, needed for the processing of the MC-11-E block. For this reason only pairwise sub-block results are shown in this section. For this large block of 98 HRSC image strips, 368 pairwise sub-blocks have been de-tected. The sub-block matching delivered 910,155 tie points. The tie point filter with a grid cell size of 24 reduced this number distinctly by selecting only 5% or 44,181 points. The block ad-justment was then carried out twice: once with the unfiltered and once with the filtered tie points.
In Figure 12 evaluation results of both block adjustments, the strip adjusted EO and the nominal EO are compared, using er-ror maps and mean values.
In terms of the mean intersection error of multi-strip tie points, which is taken as a quality measure for a consistent combina-tion of strips, the block adjustment, using unfiltered tie points, achieved a reduction from 50.1m to 20.6m. Compared to the av-erage image resolution (17.0m for the nadir images, and a factor of two to four larger for the other panchromatic images), this is a reasonable result. Although, after applying the tie point filter, only 5% of the number of tie points where used, this improve-ment does not suffer. However the size of the equation system to solve in the adjustment, and so the computation time decreases considerably (see Table 2).
not filtered filtered
No. of tie points used: 910,155 44,181 Unknowns in block BA: 2,411,168 117,599 Observations in block BA: 7,639,359 428,676 Computation time for block BA: 222h22min 4h21min
Table 2: Information about block adjustments of MC-11-E
no BA strip BA block BA (not filered) block BA (filtered)
Mean MOLA height difference: -11.7 0.6 1.0 1.9
Mean single-strip intersection error: 30.1 12.4 12.4 12.4
Mean multi-strip intersection error: 50.1 29.2 20.5 20.6
Table 3: Evaluation results for MC-11-E
a) b)
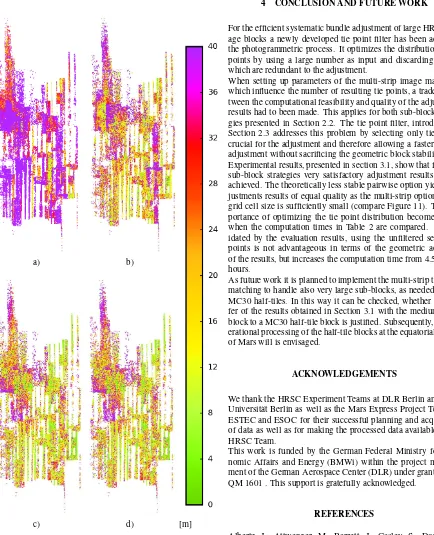
c) d) [m]
Figure 12: Color-coded intersection error of multi-strip points; a) before the adjustment, mean = 50.1m; b) after strip ad-justment, mean = 29.2; c) after block adjustment with unfiltered tie points, mean = 20.5m; d) after block ad-justment with filtered tie points, mean = 20.6m
4 CONCLUSION AND FUTURE WORK
For the efficient systematic bundle adjustment of large HRSC im-age blocks a newly developed tie point filter has been added to the photogrammetric process. It optimizes the distribution of tie points by using a large number as input and discarding points, which are redundant to the adjustment.
When setting up parameters of the multi-strip image matching, which influence the number of resulting tie points, a tradeoff be-tween the computational feasibility and quality of the adjustment results had to been made. This applies for both sub-block strate-gies presented in Section 2.2. The tie point filter, introduced in Section 2.3 addresses this problem by selecting only tie points crucial for the adjustment and therefore allowing a faster bundle adjustment without sacrificing the geometric block stability. Experimental results, presented in section 3.1, show that for both sub-block strategies very satisfactory adjustment results can be achieved. The theoretically less stable pairwise option yields ad-justments results of equal quality as the multi-strip option, if the grid cell size is sufficiently small (compare Figure 11). The im-portance of optimizing the tie point distribution becomes clear, when the computation times in Table 2 are compared. As val-idated by the evaluation results, using the unfiltered set of tie points is not advantageous in terms of the geometric accuracy of the results, but increases the computation time from 4.5 to 222 hours.
As future work it is planned to implement the multi-strip tie point matching to handle also very large sub-blocks, as needed for the MC30 half-tiles. In this way it can be checked, whether a trans-fer of the results obtained in Section 3.1 with the medium sized block to a MC30 half-tile block is justified. Subsequently, the op-erational processing of the half-tile blocks at the equatorial region of Mars will is envisaged.
ACKNOWLEDGEMENTS
We thank the HRSC Experiment Teams at DLR Berlin and Freie Universit¨at Berlin as well as the Mars Express Project Teams at ESTEC and ESOC for their successful planning and acquisition of data as well as for making the processed data available to the HRSC Team.
This work is funded by the German Federal Ministry for Eco-nomic Affairs and Energy (BMWi) within the project manage-ment of the German Aerospace Center (DLR) under grant no. 50 QM 1601 . This support is gratefully acknowledged.
REFERENCES
Barazzetti, L., Remondino, F. and Scaioni, M., 2010. Extrac-tion of accurate tie points for automated pose estimaExtrac-tion of close-range blocks. In: International Archives of the Photogrammetry, Remote Sensing and Spatial Information Sciences, Vol. 37 (3A), pp. 151–156.
Batson, R. M. and Greeley, R., 2007. Map formats and projec-tions used in planetary cartography. In: Planetary Mapping. Cam-bridge University Press.
Bostelmann, J. and Heipke, C., 2014. Analyzing a block of HRSC image strips for a simultaneous bundle adjustment. In: ISPRS -Annals of Photogrammetry, Remote Sensing and Spatial Infor-mation Sciences, Vol. 2 (4), pp. 15–20.
Bostelmann, J. and Heipke, C., 2016. Global Bundle Adjust-ment With Variable Orientation Point Distance for Precise Mars Express Orbit Reconstruction. In: International Archives of the Photogrammetry, Remote Sensing and Spatial Information Sci-ences, Vol. 41 (B4), pp. 361–368.
Gwinner, K., Jaumann, R., Bostelmann, J., Dumke, A., Elgner, S., Heipke, C., Kersten, E., Michael, G., Preusker, F., Roatsch, T., Schmidt, R., Scholten, F., Spiegel, M., van Gasselt, S. and Wal-ter, S., 2015. The first Quadrangle of the Mars Express HRSC Multi-Orbit Data Products (MC-11-E). European Planetary Sci-ence Congress EPSC2015-672 10, pp. 11–12.
Gwinner, K., Scholten, F., Preusker, F., Elgner, S., Roatsch, T., Spiegel, M., Schmidt, R., Oberst, J., Jaumann, R. and Heipke, C., 2010. Topography of Mars from global mapping by HRSC high-resolution digital terrain models and orthoimages: Characteristics and performance. Earth and Planetary Science Letters 294(3-4), pp. 506–519.
Hartmann, W., Havlena, M. and Schindler, K., 2016. Recent de-velopments in large-scale tie-point matching. ISPRS Journal of Photogrammetry and Remote Sensing 115, pp. 47–62.
Heipke, C., Oberst, J., Albertz, J., Attwenger, M., Dorninger, P., Dorrer, E., Ewe, M., Gehrke, S., Gwinner, K., Hirschm¨uller, H., Kim, J. R., Kirk, R. L., Mayer, H., Muller, J. P., Rengarajan, R., Rentsch, M., Schmidt, R., Scholten, F., Shan, J., Spiegel, M., W¨ahlisch, M. and Neukum, G., 2007. Evaluating planetary dig-ital terrain models-The HRSC DTM test. Planetary and Space Science 55, pp. 2173–2191.
Jaumann, R., Tirsch, D., Hauber, E., Ansan, V., Di Achille, G., Erkeling, G., Fueten, F., Head, J., Kleinhans, M., Mangold, N., Michael, G., Neukum, G., Pacifici, A., Platz, T., Pondrelli, M., Raack, J., Reiss, D., Williams, D., Adeli, S., Baratoux, D., de Vil-liers, G., Foing, B., Gupta, S., Gwinner, K., Hiesinger, H., Hoff-mann, H., Deit, L. L., Marinangeli, L., Matz, K.-D., Mertens, V., Muller, J., Pasckert, J., Roatsch, T., Rossi, A., Scholten, F., Sowe, M., Voigt, J. and Warner, N., 2015. Quantifying geologi-cal processes on Mars -Results of the high resolution stereo cam-era (HRSC) on Mars express. Planetary and Space Science 112, pp. 53–97.
Michael, G., Walter, S., Kneissl, T., Zuschneid, W., Gross, C., McGuire, P., Dumke, A., Schreiner, B., van Gasselt, S., Gwin-ner, K. and Jaumann, R., 2016. Systematic processing of Mars Express HRSC panchromatic and colour image mosaics: Image equalisation using an external brightness reference. Planetary and Space Science 121, pp. 18–26.
Neukum, G., Jaumann, R. and The HRSC Co-Investigator Team, 2004. HRSC: The High Resolution Stereo Camera of Mars ex-press. Mars Express: The Scientific Payload, Eur. Space Agency Spec. Publ., ESA-SP 1240, pp. 17–36.
Schmidt, R., 2008. Automatische Bestimmung von Verkn¨upfungspunkten f¨ur HRSC-Bilder der Mars Express-Mission. PhD thesis, DGK-C, Nr. 623, Deutsche Geod¨atische Kommission, Verlag C. H. Beck, M¨unchen.
Schmidt, R., Spiegel, M., Heipke, C., Dumke, A., Neukum, G. and The HRSC Co-Investigator Team, 2008. Operational Deter-mination of Tie Points and Bundle Adjustment of HRSC Images of the Mars Express Mission. In: International Archives of the Photogrammetry, Remote Sensing and Spatial Information Sci-ences, Vol. 37 (4), pp. 1025–1030.
Smith, D., Neumann, G., Arvidson, R. E., Guinness, E. A. and Slavney, S., 2003. Mars Global Surveyor laser altimeter mission experiment gridded data record. NASA Planetary Data System.