87
DIURNAL AND SEASONAL VARIATION OF MEASURED ATMOSPHERIC CO
2AT
DEHRADUN DURING 2009
Neerja Sharma1, R.K.Nayak1, V.K. Dadhwal1, Y.Kant2, M. M. Ali1
1
National Remote Sensing Centre, Hyderabad
2
Indian Institute of Remote Sensing, Dehradun [email protected]
KEYWORDS:Carbon Dioxide, photosynthesis, soil respiration, Net Ecosystem Productivity, Net primary Productivity, Indian summer monsoon
ABSTRACT:
Atmospheric carbon dioxide (CO2) is the major greenhouse gas. We analysed the diurnal trend and seasonal variations of atmospheric
Carbon Dioxide (CO2) measured at Dehradun during 2009. The measurements are taken from the Vaisala CO2 probe installed at the top
of the IIRS building. A distinct diurnal cycle with seasonal variations is present in these measurements. Diurnal cycle exhibits a half sinusoidal variation with decreasing phase during sunrise to afternoon and increasing phase during afternoon to sunset. CO2 mostly
remains constant with higher values during the night. The largest negative anomaly with respect to the annual mean varies between +/-20 ppmv with positive anomaly during the night time and negative anomaly during the day time. The cause of such variation could be attributed to the local ecosystem activity. During the day time the sinking of CO2 through the photosynthesis dominates its release
through autotrophic and heterotrophic respiration. On the other hand, photosynthesis has been ceased during the night time and respiration only controls the night variation of CO2..There exists significant change on the diurnal cycle of CO2 in different seasons
during the year. The maximum rapid decrease in CO2 concentration in early morning hours is due to photosynthetic activity during the
monsoon periods (maximum in August -8ppm). During monsoon period rapid night time increase of CO2 is observed due to the
enhancement of respiration. An inverse relationship exist between model simulated net ecosystem productivity and CO2 deviations on
monthly basis. This diurnal and seasonal variations in situ CO2 are in confirmation with model simulated results.
1. INTRODUCTION
Carbon dioxide (CO2) in the atmosphere is of vital importance
because of its influence on green house (GH) effect and climate change. CO2 being the GHG, the increase in concentration
directly influence the global temperature of atmosphere. Since pre-industrial time it has been increased continuously, and during the past three decade the growth rate has been accelerated which has influenced largely the recent time global warming. During 1995 - 2005 decade, the growth rate of CO2 in the atmosphere
was 1.9 parts per million by volume (ppmv) yr-1 increasing the
radiative forcing by 20%. This is the largest change observed for any decade in at last 200 years (IPCC, 2001). In recent decade, it is increasing by 2.14 ppmv yr-1 and at present it is 393ppmv (Nayak and Dadhwal et al. 2011).
Most sources of CO2 emission are natural, that include volcanic
eruption, the combustion of organic matter and the respiration process of living aerobic organisms. The man made sources of CO2 include the burning of fossil fuels for heating, power
generation and transport and industrial processes. It was reported that the important reason for increase in CO2 is a result of human
activities that have occurred over the last 150 years, including the burning of fossil fuels and deforestation.
CO2 exchange between atmosphere and land surface is an
important issue to understand the future climate scenario. For quantitative understanding of regional CO2 transport and its
variations with regional environmental boundary condition different spatial and temporal scales have to be analysed through field measurements. The distributed dense networks of
observations would be useful to represent the CO2 changes due to
geographic and local environmental conditions. Recently several observational networks have been established across the globe under different national and international efforts. In India a few observation sites are operationalized and a few are planned. Mmeasurement and analysis of near surface CO2 has been
reported by Bhattacharya et al (2009) using flask sample at Cape Rama (Goa) and at high altitude on commercial aircraft by Schuck et al., (2010).
In this paper we have analyzed the diurnal and seasonal variations of CO2 at Dehradun station of India. Vaisala CO2 CARBOCAP,
GMP343 sensor is used to measure CO2 averaged over 15
minutes. The diurnal trends of CO2 have been analyzed with
reference to local ecosystem activities. Significant changes on the diurnal cycle of CO2 in different seasons also studied. In order to
examine the causes of such variation, we have compared the CO2 data with the local ecosystem CO2 exchanges in the form of net
ecosystem productivity (NEP) and soil-respiration simulated from a terrestrial ecosystem model.
2. MATERIAL AND METHODS
2.1 Measurements
The measurement site used for the present study of CO2 is Indian
Dehradun station (30.1oN, 77.4oE). The site is surrounded by the vegetation and forest. The measurements are taken from the Vaisala CO2 probe installed at the top of the IIRS building,
approximately 30m above the ground in order to capture the International Archives of the Photogrammetry, Remote Sensing and Spatial Information Sciences, Volume XXXVIII-8/W20, 2011
ISPRS Archives XXXVIII- 8/W20; Workshop Proceedings: Earth Observation for Terrestrial Ecosystems
88 diurnal and seasonal variability of CO2. The Vaisala CARBOCAP
GMP343 is the most reliable instrument for such studies. It is an accurate and rugged probe type instrument which provides an acceptable compromise between size, response time accuracy and stability ( Table 1: Key specifications of GMP343). The measurement is based on the advanced CARBOCAP Single – Beam –Wavelength NDIR technology. Rigby, (2008) reported the reliable results of continuous measurement of CO2 using GMP343
at Central London.
While climatic and background CO2 increase measurements are carried out with very high precision, away from anthropogenic source-led noise, need exists for additional land use and other factor controlled CO2 variation at a number of sites. Availability
of small rugged infra-red sensors has opened up such studies. This is in contrast to eddy-covariance CO2 measurements from fast
sensors that are used to derive fluxes, these sensors are slow response sensors, e.g., LiCOR (Li-820, Li840), Vaisala (GMP 343). Recently such sensors have been used to characterize CO2
over urban area (Central London, by Rigby et al., 2008), soil CO2
fluxes/respiration, sea-air exchange.
2.2 Working principle
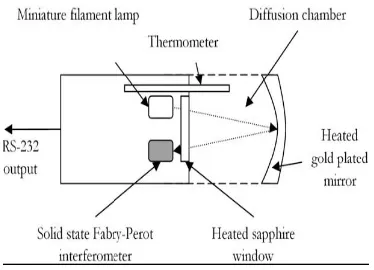
The detail schematic of the sensor is shown in figure 1 The infra-red sensor of GMP343 is based on the proprietary Vaisala CARBOCAP sensing technology. The pulsed light from a miniature filament lamp is reflected and re-focused back to an IR detector which is behind a silicon based Fabry-Perot Interferometer (FPI). The tiny FPI is tuned electrically so that the measured wavelength is changed between the absorption band of the CO2 gas and a referenced band.
Noise at 350 ppm 3 ppm
Short-term stability (up to 6 h) at 350 ppm
1 ppm
Long-term stability <_2% of reading year_1
Response time 75
Table.1Vaisala CARBOCAP GMP343 key performance statistics (Vaisala, 2005).
Figure.1 Vaisala CARBOCAP schematic.
3. RESULTS
3.1 Observation Results:
Hourly deviations of the observed CO2 are calculated throughout
the period. The CO2 deviations are calculated by the subtraction
of annual mean value from hourly values. A distinct diurnal cycle with seasonal variations of CO2 is observed during the study
period. The diurnal cycle of CO2 can be explained through the
interaction of number of process (Reid and Steyn, 1997). Diurnal cycle exhibits a half sinusoidal variation with decreasing phase during sunrise to afternoon and increasing phase during afternoon to sunset. CO2 mostly remains constant with higher values during
the night. The largest negative anomaly with respect to the annual mean varies between +/-20 ppmv with positive anomaly during the night time and negative anomaly during the day time. Further the amplitudes of diurnal cycles are different in different months with maximum dip during afternoon hours. The cause of such variation could be attributed to the local ecosystem activity. During the day time the sinking of CO2 through the
photosynthesis dominates its release through autotrophic and heterotrophic respiration.
To understand the maximum dip in CO2 during afternoon hours,
we have analyzed CO2 deviations in between 12-16 hours LT
(Figure 3). The minimum value (-26ppm) is observed during September. This minimum value starts decreasing with the arrival of summer monsoon. This is because of the enhanced vegetation activity during monsoon and post monsoon months.
Figure 2: Observed diurnal variability of atmospheric surface layer CO2 (deviations) at Dehradun during 2009
Figure 3: Observed atmospheric CO2 deviations during 12-16
hours LT at Dehradun during 2009.
ISPRS Archives XXXVIII- 8/W20; Workshop Proceedings: Earth Observation for Terrestrial Ecosystems
89 Figure.4 CO2 variations observed between 04-07 hr LT during
different months in 2009.
The rapid decrease in CO2 in early morning throughout the year
(Figure 2) is again the function of photosynthesis activity. To analyse this feature we studied the CO2 behaviour in between
07-10 hours LT (Figure 4). The maximum decrease in CO2 is
observed during monsoon period, with the minimum value during July (-8 ppm). During rest of the months the decline of CO2 lies
around -2ppm. The rapid decrease in CO2 is primarily due to
thickening of planetary boundary layer and secondarily due to enhancement of vegetation-photosynthetic activity. During monsoon months the vegetation is maximum, thus photosynthesis is also maximum which lead to increase the uptake of CO2 by
vegetation.
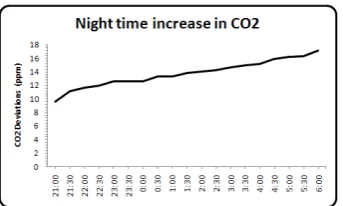
Figure.5 Night time increase in observed atmospheric CO2 during
21 to 06 hours LT .
It is observed that CO2 remains constant with the higher values
during the night (Figure 3). The night time increase in CO2 at
Dehradun is analyzed by taking observation from 21:00 to 06:00 hous LT (Figure.5). A linear increasing trend in CO2 is observed
from 21 to 06 hours LT throughout the year. At 21 hour the value is 10 ppmv while it reached to 18 ppmv around 06 hour.
3.2 Model Results:
The Net Ecosystem Productivity (NEP) is the estimates of net carbon exchange between the vegetation-soil system and the atmosphere. It could play an important role in the control of atmospheric CO2. It is the difference between Net Primary
Productivity (NPP) and soil-respiration and could be simulated by terrestrial ecosystem model. Recently Carnegie–Ames–Stanford Approach (CASA) is implemented for the simulation of NPP, NEP, soil respiration and etc. over India at 2 min spatial resolution. The model was forced by the time varying climatological parameters and satellite measured vegetation greenness index (Nayak et al. 2009, 2011). The simulated results
at Dehradun for the year 2009 are further used for the interpretation of CO2 observed variations.
The variation of monthly night time increase in in situ CO2 along
with the simulated soil respiration is shown in Figure 6.
Figure 6: Comparison between night time CO2 and simulated
soil-respiration during different months in 2009.
.
Figure 7: Comparison between monthly observed CO2 and
simulated net ecosystem productivity during 2009.
The night absolute deviations show that CO2 start increasing with
the arrival of summer monsoon (June) with the peak during August (27ppm) and then start declining. The soil respiration has one to one correspondence with the monthly night time increase in CO2 especially during monsoon months. It starts increasing
from June and reaches the peak in August. Observations show that the night time increase in CO2 during monsoon period is
mainly governed by the increase in soil respiration process. Because the photosynthetic activity stops at night.
The monthly CO2 deviations are also compared with the simulated NEP (Figure 7). An inverse relationship exists between the two parameters throughout the year. During winter months (Nov-Dec-Jan-Feb) the negative NEP enhanced the atmospheric CO2, while in monsoon the large positive NEP governs the rapid
decrease in the CO2.
4. CONCLUDING REMARKS
Results presented here show the distinct diurnal cycle and seasonal cycle of near-surface CO2 at Dehradun at a mixed
urban-vegetation site.. The observed variations in CO2 are controlled by
the day time photosynthesis and the night time respiration process at diurnal scale. The onset and withdrawal of summer monsoon also directly and indirectly influenced the CO2 concentration. The
CO2 07-10 hours LT
ISPRS Archives XXXVIII- 8/W20; Workshop Proceedings: Earth Observation for Terrestrial Ecosystems
90 intra-seasonal CO2 patterns were also compared with the CASA
model simulated NEP and soil respiration process. Soil respiration and CO2 trend perfectly correlated with each other
especially during monsoon months. While the NEP and monthly CO2 deviation shows an inverse relationship with each other. The
over all results highlight the control of that observed CO2
variations by the terrestrial ecosystem C cycle processes.
REFERENCES
Bhattacharya, S.K., Borole, D.V., Francey, R.J., Allison, C.E., Steele, L.P., Krummel, P., Langenfelds, R., Masarie, K. A., Tiwari, Y.K., and Patra, P.K.(2009) Trace gases and CO2 isotope records from Cabo de Rama, India, Curr. Sci., 97, 1336–1344. Nayak , R. K. , N. R. Patel, and V. K. Dadhwal (2011). Inter-annual variability of Net Primary Productivity over India, International Journal of Climatology (in press).
Nayak, R. K. and V.K. Dadhwal et al. (2011). Variability of atmospheric CO2 over India and Surrounding Oceans and control
by Surface Fluxes, The International Archives of the Photogrammetry, Remote Sensing and Spatial Information Sciences, Vol. 34, Part XXX
Nayak, R. K., N. R. Patel and V. K. Dadhwal (2009). Estimation and analysis of terrestrial net primary productivity over India by remote-sensing-driven terrestrial biosphere model, Journal of Environment Monitoring and Assessment- 10.1007/s10661-009-1226-9.
Reid, K.H., D.G. Steyn (1997). Diurnal variations of boundary-layer carbondioxide in a coastal city – observations and comparison with model results. Atmospheric Environment 31 (18), 3101–3114.
Rigby, M., R. Toumi, R.Fischer, D. Lowry, E.G. Nisbet, E.G (2008). First continuous measurements of CO2 mixing ratio in central London using a compact diffusion probe. Atmospheric Environment 42 , 8943–8953.
Schuck, T.J., Brenninkmeijer, C.A.M., Baker, A.K., Slemr, F., von Velthoven, P.F.J., and Zahn, A.(2010) Greenhouse gas relationships in the Indian summer monsoon plume measured by the CARIBIC passenger aircraft, Atmos. Chem. Phys., 10, 3965– 3984, doi:10.5194/acp-10-3965-2010, 2010.
ACKNOWLEGEMENTS
This research work is carried out as the part of National carbon Project, ISRO-Geosphere and Biosphere Programme.