IMPACT OF THE ATATÜRK DAM LAKE ON AGRO
-METEOROLOGICAL ASPECTS
OF THE SOUTHEASTERN ANATOLIA REGION USING REMOTE SENSING AND GIS
ANALYSIS
O. Ozcana, *, B. Bookhagenb , N. Musaogluc
a
ITU,
Center for Satellite Communications and Remote Sensing, 34469 Maslak Istanbul, Turkeyb
University of California Santa Barbara, Department of Geography, CA 93106-4060, USA
c
ITU,
Civil Engineering Faculty, Department of Geomatics Engineering, 34469 Maslak Istanbul, TurkeyKEY WORDS: Atatürk Dam Lake, GAP, Landsat time-series, Tasseled Cap transformation, Disturbance Index, RS, GIS.
ABSTRACT:
The Atatürk Dam is the fourth largest clay-cored rock fill dam in the world. It was constructed on the Euphrates River located in semi-arid Southeastern Turkey in the 1980s as the central component of a large-scale regional development project for the Southeastern Anatolia region (referred to as GAP). The construction began in 1983 and was completed in 1990. The dam and the hydroelectric power plant, which went into service after filling up the reservoir was accomplished in 1992. The Atatürk Dam, which has a height of 169 m, a total storage capacity of 48.7 million m3, and a surface area of about 817 km2 plays an important role in the
development of Turkey’s energy and agriculture sectors. In this study, the spatial and temporal impacts of the Atatürk Dam on agro -meteorological aspects of the Southeastern Anatolia region have been investigated. Change detection and environmental impacts due to water-reserve changes in Atatürk Dam Lake have been determined and evaluated using multi-temporal Landsat satellite imageries and meteorological datasets within a period of 1984 to 2011. These time series have been evaluated for three time periods. Dam construction period constitutes the first part of the study. Land cover/use changes especially on agricultural fields under the Atatürk Dam Lake and its vicinity have been identified between the periods of 1984 to 1992. The second period comprises the 10-year period after the completion of filling up the reservoir in 1992. At this period, Landsat and meteorological time-series analyses are examined to assess the impact of the Atatürk Dam Lake on selected irrigated agricultural areas. For the last 9-year period from 2002 to 2011, the relationships between seasonal water-reserve changes and irrigated plains under changing climatic factors primarily driving vegetation activity (monthly, seasonal, and annual fluctuations of rainfall rate, air temperature, humidity) on the watershed have been investigated using a 30-year meteorological time series. For all images, geometric corrections including digital elevation information and Tasseled Cap transformations were carried out to attain changes in surface reflectance and denoting disturbance of Landsat reflectance data. Consequently, thematic maps of the affected areas were created by using appropriate visualization and classification techniques in conjunction with geographical information system. The resulting dataset was used in a linear trend analysis to characterize spatiotemporal patterns of vegetation-cover development. Analysis has been conducted in ecological units that have been determined by climate and land cover/use. Based on the results of the trend analysis and the primary factor analysis, selected parts of South-eastern Anatolia region are analyzed. The results showed that approximately 368 km2 of agricultural fields have been affected because of inundation due to the Atatürk Dam Lake. However, irrigated agricultural fields have been increased by 56.3% of the total area (1552 km2 of 2756km2) on Harran Plain within the period of 1984 – 2011. This study presents an effective method for time-series analysis that can be used to regularly monitor irrigated fields in the Southeastern Anatolia region.
1. INTRODUCTION
The concept of sustainable development in water based development projects includes determination and planning of the demands for the water through the project region (e.g., Tortajada, 2001). As a rapidly developing country Turkey, needs sufficient amount of irrigated agricultural products for growing population; cheap, continuous and high quality renewable energy for the industry; qualified water for domestic uses especially for the regions that are having low level of life standards with respect to the national average standards.
For developing countries where a semi-arid climate is highly dominated like Turkey, dams, which are built and efficiently maintained, can be used for economic development purposes. Land and water resources of potential regions can be managed
for these purposes by construction of dams. The Southeastern Anatolia Project is the largest of these types of projects in Turkey, which spans approximately 75,000 square kilometers and covers approximately 10% of all area of Turkey (Akyurek, 2005).
The Euphrates is the longest river of western Asia. It originates from Mount Ararat at 4,500 m above sea level near Lake Van. Then it flows south by losing 2 meters per kilometer in elevation in Turkey and crosses into Syria. Hydrological flow condition of the Euphrates River is the irregular between and within the years. The water is needed during the drought seasons for irrigation and power generation purposes. The constructions of retaining structures to regulate river flows are needed for irrigation and hydropower generation.
The Lower Euphrates Project is one of the seven GAP (Southeastern Anatolia Project) sub-projects on the Euphrates River. It consists of the most important schemes of GAP like
the Atatürk Dam and Hydroelectric Power Plant (HEPP),
Sanliurfa Tunnels, Sanliurfa -Harran irrigation, Mardin-Ceylanpinar irrigation, Siverek-Hilvan pumped irrigation and Bozova pumped irrigation (Fig 1).
The Atatürk dam has a great contribution on the agricultural and
industrial development in the GAP Region. The irrigation system of Lower Euphrates Project is based on the Atatürk dam reservoir. The construction of the dam was initiated in 1983 and the diversion of water through the tunnels started in June 1986. The reservoir was filled in August 1990 and the power generation was started in 1992.
Fig. 1 Location of planned irrigation schemes of GAP. (Striped
areas will be irrigated from Atatürk Reservoir; others will be irrigated by other sources) (SPO, 1989).
The Landsat image archive represents an opportunity to assess agricultural monitoring over time through time-series analysis. Landsat, with a spatial resolution of 30 m and spatial extent of
185×185 km per scene, is used widely for mapping biophysical
vegetation parameters (Cohen & Goward, 2004) and has proven useful for monitoring land cover (Wulder et al., 2008) and ecosystem disturbance (Healey et al., 2005; Masek et al., 2006).
Remote sensing is a critical data source for observing and understanding the effects of landscape disturbance (e.g. Potter et al., 2003; Linke et al., 2008; Masek et al., 2008). Landsat-based detection of disturbances (e.g. Cohen et al., 2002; Franklin et al., 2001; Seto et al., 2002) commonly use image transformations such as the Tasseled Cap transformation (Crist & Cicone, 1984; Kauth & Thomas, 1976) to consolidate multispectral reflectance measurements and enhance the detection of disturbance events.
The Tasseled Cap transformation reduces the Landsat reflectance bands to three orthogonal indices called brightness, greenness and wetness, and is a standard technique for describing the three major axes of spectral variation across the solar reflective spectrum measured by Landsat (Kauth & Thomas, 1976). Once an image is transformed into its Tasseled Cap data space, image arithmetic and thresholding techniques can be used to automatically identify and classify land cover changes and land cover disturbance (e.g. Cohen et al., 2002; Franklin et al., 2001; Healey et al., 2005).
Up-to-date and objective information on the spatial distribution of irrigated crops as well as changes in their areal extent over time can help achieve the goal of efficient water resource management. The objective is to map the extent of irrigated
agricultural fields and assess land-cover trends at the object level within a selected study area in GAP region using Landsat images from 1984 to 2011.
Ozdogan (2004) indicates that in Southeastern Turkey, the best time to distinguish irrigated lands from other land cover types is mid-to-late summer. In the study, Landsat imagery for these months were used in order to determine the land cover/use changes especially on agricultural fields under the Atatürk Dam Lake and also irrigated agricultural fields with water reserve changes for ~30 years.
2. STUDY AREA
The first focus of this study is the Atatürk Dam Lake with a catchment area of 92,240 km2 while the impounded land is 817 km2. The maximum reservoir capacity of the Atatürk dam is 48.7 x10⁹ cubic meters with the total irrigation area of 8,724 km2. The minimum level of water in the reservoir is 526 m. The second focus is the Harran Plain, which is irrigated from the
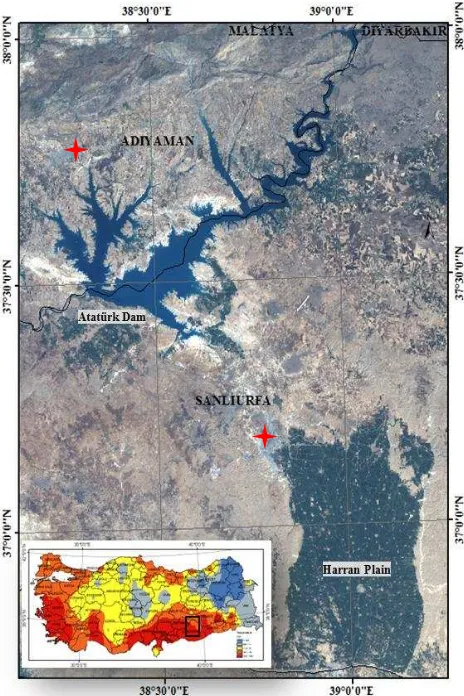
Atatürk Dam Lake and is located in the south-central part of the GAP project within the Sanliurfa - Harran Irrigation District. The Plain is 2756 km2 and is located in a region of rolling hills and a broad plateau that extends south into Syria (Fig 2). Two meteorological stations that have been used in the study are shown as red stars in Fig. 2.
Fig. 2 Landsat TM images of the study area (August 2011). Inset shows mean annual temperature of Turkey with the study
area outlined by a black rectangle.
The study area has the major climatic features of the Eastern Mediterranean with a strong continental influence. The annual
average temperature is 18 °C and annual rainfall is around 350 mm. There is significant seasonal variation in precipitation, with most precipitation occurring between November and April. The area receives almost no rain during the summer, at which time irrigation becomes crucial.
The Sanliurfa-Harran Plain Irrigation Project is the first realized scheme within the Lower Euphrates Project. The water is brought to Sanlıurfa- Harran Plain by the Sanliurfa tunnel system consisting of two parallel tunnels each 26.4-km long and with an 7.62-m inside diameter and a carrying capacity of 328 m3 /sec. These tunnels were completed successively in 1995 and in 1998. The irrigation capacity of Sanliurfa and Harran canals are almost 500 km2 and 1000 km2.
Several different crops including cotton, cereals, maize, and vegetables are cultivated in the Harran Plain. While there is a variety, cotton and cereals dominate the agricultural scene in any given year (Ozdogan et al., 2006).
3. METHODOLOGY
Remote sensing has been an effective tool for monitoring irrigated fields under a variety of climatic conditions and locations. The thematic analysis of multi-temporal data series requires differences between images to result exclusively from changes in surface properties, necessitating a precise geometric and radiometric correction of incorporated images (Song et al., 2001).
Monitoring the changes in the Atatürk Dam Lake and summer irrigated fields in the Harran Plain require multiple sources of data. In the first part of this study, land cover/use changes on agricultural fields under the Atatürk Dam Lake and its vicinity have been identified between the periods of 1984 to 1992. Reserve changes and inundated agricultural fields have been identified by change detection using multi temporal Landsat imagery within these periods.
After the 10-year period of completion and the filling up of the reservoir in 1992, Landsat and meteorological time-series
analyses are examined to assess the impact of the Atatürk Dam Lake on irrigated agricultural areas in the Harran Plain. For the last 9-year period from 2002 to 2011, the relationships between seasonal water reserve changes and irrigated plains under changing climatic factors primarily driving vegetation activity on the watershed have been analyzed consecutively using the appropriate tools. A total number of 99 Landsat images have been used in order to constitute time series analysis and to determine the changes on these fields in conjunction with climatic datasets. For all images, geometric corrections including digital elevation information and Tasseled Cap transformations were carried out to attain changes in surface reflectance and denoting disturbance of Landsat reflectance data.
Tasseled Cap transformation was originally developed for early Landsat sensors (multispectral scanner and thematic mapper) (Crist & Cicone, 1984; Kauth & Thomas, 1976), its linear coefficients have more recently been modified for applicability to Enhanced Thematic Mapper Plus (ETM+) imagery. In order to use the tasseled cap coefficients (Huang et al., 2002) for the Landsat 5 TM sensor, conversion of the Landsat 5 TM DN data into data that is equivalent to data recorded by the Landsat 7 ETM+ sensor is needed due to the calibration differences between the two sensors. This process is described by Vogelmann et al. (2001) in reverse; that is, they converted from
Landsat 7 ETM+ data to Landsat 5 TM equivalent. To convert from Landsat 5 TM DN data to Landsat 7 ETM+ DN data, the following expression is used (Eq. 1):
(1)
where DN7 is the Landsat 7 ETM+ equivalent DN data, DN5 is the Landsat 5 TM DN data, and the slope and intercept are band-specific numbers.
Before converting to reflectance data, all images with DN values were converted to radiance. While radiance is the quantity actually measured by the Landsat sensors, a conversion to reflectance facilitates better comparison among different scenes. It was obtained by removing differences caused by the position of the sun and the differing amounts of energy output by the sun in each band. The reflectance can be thought of as a
“planetary albedo,” or fraction of the sun’s energy that is
reflected by the surface. During the conversion from DN data to reflectance, it is possible to create small negative reflectance values which are set to zero.
Each image was taken during the mid-to-late summer months from 1992 through 2011 in order to investigate the change detection on Harran Plain and environmental impacts due to
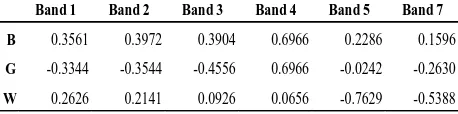
water reserve changes in Atatürk Dam Lake. All images were radiometrically corrected and then converted into reflectance values and then tasseled cap procedure was used to create a vegetation index that measures three vegetation dimensions— brightness, greenness and wetness (Crist and Krauth, 1986). Table 1 gives an overview of the Landsat based Tasseled Cap coefficients (Huang et al., 2002).
Table 1. Tassled Cap coefficients for Landsat (Huang et al., 2002).
Remote sensing change detection is performed using the Disturbance Index described in Healey et al. (2005), an index specifically designed to detect changes in vegetated land cover types. The Disturbance Index is a transformation of the Tasseled Cap data space and is calculated using the three normalized Tasseled Cap indices (brightness, greenness and wetness) from Landsat TM/ETM+data (Healey et al., 2005; Kauth & Thomas, 1976; Masek et al., 2008). The index is computed as a linear normalizes pixel values across Tasseled Cap bands with respect to overall changes in reflectance, such as seasonal changes or changes induced by directional reflectance effects, thereby
DN ercept
slope
DN7( * 5)int
Band 1 Band 2 Band 3 Band 4 Band 5 Band 7
B 0.3561 0.3972 0.3904 0.6966 0.2286 0.1596
G -0.3344 -0.3544 -0.4556 0.6966 -0.0242 -0.2630
W 0.2626 0.2141 0.0926 0.0656 -0.7629 -0.5388
effectively minimizing seasonal variability in the imagery (Healey et al., 2005).
The purpose of the disturbance index is generally to measure vegetation degradation that results from any number of natural or human induced causes such as forest fires or forest-insect infestations (Hais, et al., 2009). But, in the study area it also exemplifies the contrast between irrigated agricultural fields and bare ground. In our study, disturbance-index images were generated for the dates between 1992 and 2011 and were used to characterize spatiotemporal patterns of irrigated agricultural fields on Harran Plain based upon the original reflectance images—brightness, greenness and wetness (Table 2).
Table 2. Landsat imagery used for creation of the cumulative disturbance indices.
Date Sensor
05.09.1992 Landsat TM 5 21.08.1998 Landsat TM 5 24.08.1999 Landsat TM 5 26.08.2000 Landsat TM 5 28.08.2002 Landsat ETM+ 27.08.2006 Landsat TM 5 30.08.2007 Landsat TM 5 04.09.2009 Landsat TM 5 22.08.2010 Landsat TM 5 25.08.2011 Landsat TM 5
Furthermore, meteorological datasets were obtained from Adiyaman (North of Ataturk Dam) and Sanliurfa (South of Ataturk Dam) stations for the analysis of climate data on the dam lake and the Harran Plain within the period of 1894 to 2011.
4. RESULTS AND DISCUSSION
During the Atatürk Dam construction period between 1984 and
1992, spatial variations of agricultural fields and water reserve were determined (Fig. 3). By the year 2011, it was found that 367.65 km2 of the agricultural area (about 45% of the dam-lake surface area) has been inundated. The total filling of the reservoir results in a lake area of 800 km2 (Fig. 4).
Fig. 3 Spatial variations of agricultural fields and water reserve.
For the Harran Plain and the Atatürk Dam Lake, different
meteorological datasets were used. Monthly averaged values of air temperature, humidity and rainfall observed at the Sanliurfa and Adiyaman meteorological stations (Fig. 2) were used for years between 1984 and 2011.
It is expected that one of the prominent difference of the meteorological parameter between these regions is the temperature (Fig. 5).
Fig. 4 Water reserve changes on the Atatürk Dam Lake between the years 1984 to 2011.
Fig. 5 Annual temperature distribution of Dam Lake and Harran Plain Regions.
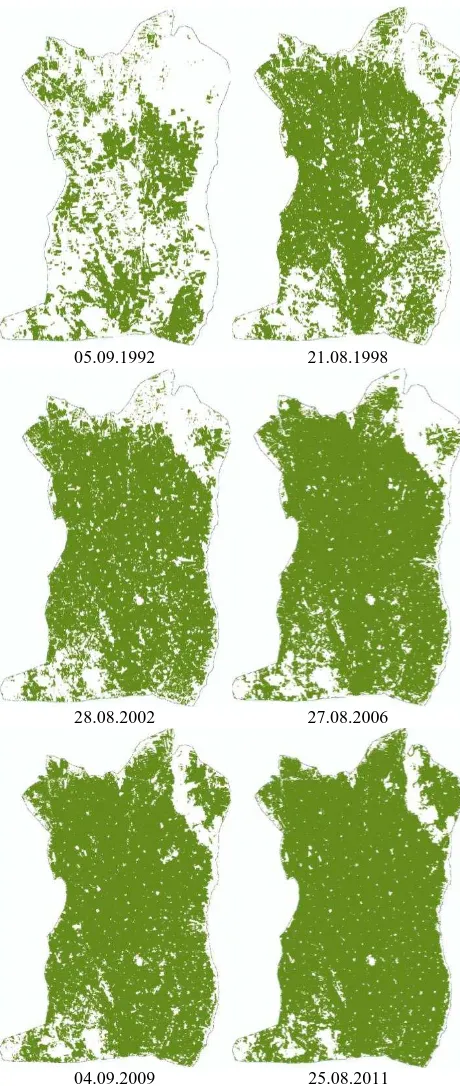
For the other part of the study, change detection is performed using the Disturbance Index for Harran Plain in order to characterize spatiotemporal patterns of irrigated agricultural fields. When the Landsat time series analyses are examined, the contrast between irrigated agricultural fields and bare ground has been clearly seen (Fig. 6).
0 150 300 450 600
1984 1985 1986 1987 1990 1991 1992
Ar
ea
(k
m
2)
Water Reserve Agricultural Fields
26 28 30 32
1984 1988 1992 1996 2000 2004 2008 2012
T
em
p
erat
u
re
(
°
C)
Sanliurfa Station Adiyaman Station
28 Aug 1992 30 Aug 1990 30 Aug 1984
25 Aug 2011
It has shown that, irrigated agricultural fields have been increased by 56.3% on Harran Plain within the period of 1992 – 2011.
05.09.1992 21.08.1998
28.08.2002 27.08.2006
04.09.2009 25.08.2011
Fig 6. Spatiotemporal patterns of irrigated agricultural fields on Harran Plain within the mid to late summer times of 1992, 1998, 2002, 2006, 2009 and 2011. The figure shows an outline
of the Harran Plains where green colors denote irrigated agricultural fields.
Results also reveal information on the spatial pattern of expansion within the Harran Plain (Fig. 6). While irrigation occurred in the central parts of the Harran Plain between 1992 and 1999, irrigation expanded at the margins of the plain for the
year 2002, and it expanded at the north of the plain especially for the last 3 years, reclaiming marginal lands with the introduction of irrigation.
Next, we investigated the relationships between seasonal water reserve changes and irrigated plains throughout the past 30 years. With the currently changing climatic conditions, we relied on the Landsat time series to analyze the differences in irrigated area (Fig. 7).
Fig. 7 Changes in Harran Plain irrigated lands and water reserve with annual precipitations. Water reserve and irrigated land area
are taken from the Landsat time series.
In the Harran Plain, 1,552 km2 were identified as irrigated as of 2011 in all irrigation unions, accounting for approximately 56% of the total land area. This is approximately a 250% increase from 1992, when the total irrigated area was only 599 km2. A total of 1,382 km2 was irrigated as of 2006, 1,418 km2 as of 2007, an additional 1,449 km2 as of 2009, and an additional 1,513 km2 as of 2010, before reaching a maximum in 2011.
Fig. 7 also reveals that the rate of expansion of irrigated lands increases between 1992 and 1999. However, by the year 1999, there is a 5% decrease in irrigated agricultural lands with a decreasing water reserve of approximately 10% because of a significant decrease in precipitation. A related observation is that from 2003-2008 the annual precipitation significantly decreased. Despite some of these climatic changes, there was no significant change in the increasing trend of the both irrigated agricultural fields and the water reserve.
5. CONCLUSION
In remote sensing based studies of irrigated lands, imagery with high spatial resolution is necessary to accurately locate irrigated fields and map their areal extent with sufficient detail (Pax-Lenney and Woodcock, 1997).
Remote sensing has been an effective tool for monitoring irrigated lands under a variety of climatic conditions and locations. It provides synoptic and timely coverage of agricultural lands in several spectral bands (Ozcan, 2007). Image archives allow comparison across dates, yielding change over time.
We have used a simple but robust method for remote detection of summer irrigated lands. It provides an applicable example of the practical utility of remote sensing for summer irrigation monitoring in the southeastern Anatolia (GAP) region.
In this study, the impacts of the Atatürk Dam on agro -meteorological aspects of the Southeastern Anatolia region have
0 100 200 300 400 500 600 700 800 900 1000
0 500 1000 1500 2000 2500
1992 1994 1996 1998 2000 2002 2004 2006 2008 2010
Pr
eci
pitat
ion
(m
m
)
A
rea
(k
m
2)
Water Reserve Irrigated Lands
Annual precipitation (Sanliurfa Station) Annual precipitation (Adiyaman Station)
been investigated. Change detection and environmental impacts due to water-reserve changes of the Atatürk Dam Lake have been determined and evaluated using multi temporal Landsat satellite imageries and meteorological datasets within a period of 1984 to 2011. We have identified a significant increase of the irrigated lands throughout the past 30 years (from 599 km2 to 1517 km2). Despite some climatic challenges and constrains, the reservoir is able to buffer several years of rainfall deficits, while maintaining a continuous agricultural growth of the area.
The presented methods here are applicable to other areas and can serve as an analog to assess agricultural development in times of environmental changes.
Acknowledgements
The authors wish to express their gratitude to Dr. Ali Volkan Bilgili at Harran University for providing meteorological data.
6. REFERENCES
Akyurek, G., 2005. Impact of Atatürk Dam on social and environmental aspects of the Southeastern Anatolia Project. MSc. METU Civil Engineering, 140pp.
Cohen, W., & Goward, S. (2004). Landsat's role in ecological applications of remote sensing. BioScience, 54, 535−545.
Cohen, W., Spies, T., Alig, R., Oetter, D., Maiersperger, T., & Fiorella, M. (2002). Characterizing 23 years (1972–95) of stand replacement disturbance in western Oregon forests with Landsat imagery. Ecosystems, 5, 122−137.
Crist, E. P., & Cicone, R. C. (1984). A physically-based transformation of thematic mapper data — The Tm Tasseled Cap. IEEE Trans. on Geoscience and Rem. Sens., 22, 256−263.
Crist, E.P.; Kauth, R.J. 1986. The tasseled cap de-mystified. Photogrammetric Engineering & Remote Sensing, 52(1): 81-86.
Franklin, S. E., Lavigne, M. B., Moskal, L. M., Wulder, M. A., & McCaffrey, T. M. (2001). Interpretation of forest harvest conditions in New Brunswick using Landsat TM enhanced wetness difference imagery (EWDI). Canadian Journal of Remote Sensing, 27, 118−128.
Hais, M., Jonasova, M., Langhammer, J., & Kucera, T. (2009). Comparison of two types of forest disturbance using multitemporal Landsat TM/ETM+ imagery and field vegetation data. Remote Sensing of Environment, 113, 835–845.
Healey, S. P., Cohen,W. B., Yang, Z. Q., & Krankina, O. N. (2005). Comparison of Tasseled Cap-based Landsat data structures for use in forest disturbance detection. Remote Sensing of Environment, 97, 301−310.
Huang, C., B. Wylie, L. Yang, C. Homer, and G. Zylstra, 2002: Derivation of a tasseled cap transformation based on Landsat 7 at-satellite reflectance. International Journal of Remote Sensing, 23, 1741-1748.
Kauth, R., & Thomas, G. (1976). The tasselled cap— A graphical description of the spectral– temporal development of agricultural crops as seen by Landsat. Proceedings of the Symposium on Machine Processing of Remotely Sensed Data
(pp. 4B−41–4B-51). Indiana: Purdue University of West
Lafayette.
Linke, J., Franklin, S. E., Hall-Beyer, M., & Stenhouse, G. (2008). Effects of cutline density and land-cover heterogeneity on landscape metrics in western Alberta. Canadian Journal of Remote Sensing, 34(4), 390−404.
Masek, J. G., Huang, C. Q., Wolfe, R., Cohen, W., Hall, F., Kutler, J., et al. (2008). North American forest disturbance mapped from a decadal Landsat record. Remote Sensing of Environment, 112, 2914−2926.
Masek, J. G., Vermote, E. F., Saleous, N. E., Wolfe, R., Hall, F. G., Huemmrich, K. F., et al. (2006). A Landsat surface reflectance dataset for North America, 1990–2000. IEEE Geoscience and Remote Sensing Letters, 3, 68−72.
Ozcan, O., 2007. Evaluation of flood risk analysis in Sakarya river sub-basin by using remote sensing and GIS, Msc. ITU Infor-matics Institute, Istanbul (in Turkish).
Ozdogan, M., 2004, ‘The hydroclimatologic effects of irrigation
in Southeastern Turkey’, Ph.D. Dissertation, Geography
Department, Boston University, 168 pp.
Ozdogan, M., Woodcock, C. E., Salvucci, G.D. and Demir, H., 2006. Changes in Summer irrigated crop area and water use in southeastern Turkey from 1993 to 2002: Implications for current and future water resources. Wat. Res. Man. 20: 467-488.
Pax-Lenney, M., & Woodcock, C. E. (1997). The effect of spatial resolution on the ability to monitor the status of agricultural lands. Remote Sens.of Environment, 61, 210–220.
Potter, C., Tan, P. N., Steinbach, M., Klooster, S., Kumar, V., Myneni, R., et al. (2003). Major disturbance events in terrestrial ecosystems detected using global satellite data sets. Global Change Biology, 9, 1005−1021.
Seto, K. C., Woodcock, C. E., Song, C., Huang, X., Lu, J., & Kaufmann, R. K. (2002). Monitoring land-use change in the Pearl River Delta using Landsat TM. International Journal of Remote Sensing, 23, 1985−2004.
Song, C., Woodcock, C. E., Seto, K. C., Lenney, M. P., & Macomber, S. A. (2001). Classification and change detection using Landsat TM data: When and how to correct atmospheric effects? Remote Sensing of Environment, 75, 230−244.
SPO, 1989. Water demand and supply balance study. GAP Master Plan Study. Working Paper Series No. 15 (Revised). Nippon Koei Co. Ltd., Yüksel Proje A.S., Joint Venture. Tokyo and Ankara.
Tortajada, C., “Environmental Sustainability of Water Projects”
Doctoral Thesis Royal Institute of Technology , Stockholm, 2001.
Vogelmann, J. E., S. M. Howard, L. Yang, C. R. Larson, B. K. Wylie, and J. N. Van Driel, 2001: Completion of the 1990’s National Land Cover Data Set for the conterminous United States. Photogrammetric Eng. and Remote Sens., 67, 650-662.
Wulder,M. A., White, J. C., Goward, S. N., Masek, J. G., Irons, J. R., Herold, M., et al. (2008). Landsat continuity: Issues and opportunities for land cover monitoring. Remote Sensing of Environment, 112, 955−969.