AN ONTOLOGY FOR THE GENERALISATION OF THE BATHYMETRY ON NAUTICAL
CHARTS
Jingya Yanac, Eric Guilbertb,*, and Eric Sauxa
a
Institut de Recherche de l’ ´Ecole Navale, GIS group, Lanv´eoc-Poulmic, CC600, 29240 Brest Cedex 9, France (jingya.yan, eric.saux)@ecole-navale.fr
b
D´epartement des Sciences G´eomatiques, Pavillon Louis-Jacques-Casault, Universit´e Laval, Qu´ebec (Qu´ebec) G1V 0A6, Canada [email protected]
cDepartment of Land Surveying and Geo-Informatics, The Hong Kong Polytechnic University, Hung Hom, Kowloon, Hong Kong
Commission II, Working Group II/2
KEY WORDS:Cartography, Bathymetry, Generalization, Representation, DEM/DTM
ABSTRACT:
On nautical charts, undersea features are portrayed by sets of soundings (depth points) and isobaths (depth contours) from which map readers can interpret landforms. Different techniques were developed for automatic soundings selection and isobath generalisation from a sounding set. These methods are mainly used to generate a new chart from the bathymetric database or from a large scale chart through selection and simplification however a part of the process consists in selecting and emphasising undersea features on the chart according to their relevance to navigation. Its automation requires classification of the features from the set of isobaths and soundings and their generalisation through the selection and application of a set of operators according not only to geometrical constraints but also to semantic constraints.
The objective of this paper is to define an ontology formalising undersea feature representation and the generalisation process achieving this representation on a nautical chart. The ontology is built in two parts addressing on one hand the definition of the features and on the other hand their generalisation. The central concept is the undersea feature around which other concepts are organised. The generalisation process is driven by the features where the objective is to select or emphasise information according to their meaning for a specific purpose. The ontologies were developed in Prot´eg´e and a bathymetric database server integrating the ontology was implemented. A generalisation platform was also developed and examples of representations obtained by the platform are presented. Finally, current results and on-going research are discussed.
1 INTRODUCTION
Nautical charts provide a schematic representation of the seafloor where features are portrayed by isobaths and soundings. In or-der to address navigation requirements, navigation hazards on the seafloor such as reefs must be emphasised and relevant fairways and berths must be highlighted. Furthermore, the navigator does not see the seafloor and a precise description is not required. As a consequence, nautical charts provide a more schematic repre-sentation of the relief than topographic maps. Undersea features are portrayed on the chart based on their relevance for navigation and their meaning has to be taken into account in designing an automatic generalisation process.
Starting from the seafloor modelled by a set of soundings and isobaths extracted from the bathymetric database, a first part con-sists in simplifying the seafloor representation according to the scale of the chart (Peters, 2012). A second part consists then in selecting and emphasising undersea features according to their meaning. In practice, the cartographer would work by selecting soundings and isobaths in order to characterise these features. For example, an isobath modelling a reef is kept and may be enlarged while an isobath marking a depression may simply be omitted. Automating this part requires first features to be characterised and classified from the set of soundings and isobaths and second features to be generalised according to their relevance. Gener-alisation operators shall be chosen and applied automatically to features considering their type and generalisation constraints.
As the process relies not simply on the satisfaction of geometrical criteria related to a scale factor but also on the meaning carried by the features, a first step in developing an automated process is
the formalisation of different concepts involved in the generalisa-tion. Such formalisation can be achieved through the definition of an ontology of the generalisation process. In this paper, an ontology is introduced which is built in two parts. First, an ontol-ogy characterising undersea features is designed. This ontolontol-ogy is mainly based on previous works by (Yan et al., 2014). Sec-ond, the bathymetric information portrayed on the chart is clas-sified into different concepts including the cartographic elements drawn on the map (soundings and isobaths) and the undersea fea-tures they model, integrating the standard nomenclature of the International Hydrographic Organisation (IHO, 2008). On top of that, the ontology conceptualises the generalisation process by formalising cartographic constraints enforcing navigation rules, the measures evaluating the adherence to constraints and the op-erators enforcing these constraints. Both parts form an ontology where the central concept is the undersea feature around which other concepts are organised so that the generalisation process is not driven by geometrical constraints but by the semantic of the chart where the objective is to select the information according to their meaning for a specific purpose, navigation.
the data. Second, from the knowledge gathered in the database, a generalisation process could be designed for the automatic con-struction and update of nautical charts.
The paper is organised as follows: the next section reviews ex-isting development on cartographic ontologies describing geo-graphical information and formalising the generalisation process as well as issues related to the representation of landforms. Sec-tion 3 introduces the framework of the new ontology and de-scribes concepts involved in the feature representation and gener-alisation process. The database implementation and examples of representations obtained on the platform are presented in section 4. The final section addresses concluding remarks and on-going research.
2 ONTOLOGIES FOR CARTOGRAPHIC REPRESENTATION
Existing works on ontologies in cartography are of two kinds and were mainly conducted by national mapping agencies. On one hand, domain ontologies describing the knowledge portrayed on the map were designed by the Spanish mapping agency (IGN-E) (G´omez-P´erez et al., 2008) and the Ordnance Survey in the UK1. Both ontologies rely on several ontologies including a to-pographic ontology and a hydrological ontology. They provide a taxonomy of geographical feature types. Their objective is to deal with the heterogeneity of data sources and with large amount of cartographic data. They do not address processes involved in the construction or techniques for representation of geographical ob-jects on the map. Furthermore, they focus on topographical maps and so do not address requirements of nautical charts. Therefore, an ontology characterising undersea features is required so that features portrayed on the chart can be classified.
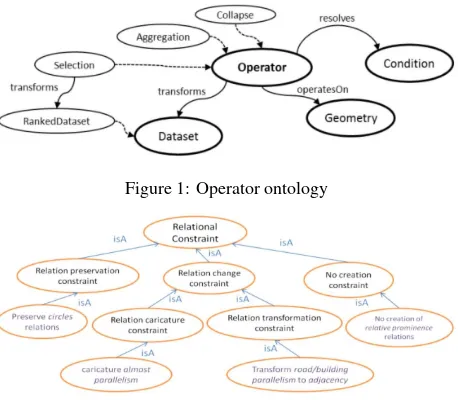
On the other hand, ontologies describing the generalisation pro-cess were defined separately focusing on the operations and constraints involved in the generalisation process. (Gould and Chaudhry, 2012) developed a generalisation ontology for on-demand mapping attempting to capture, in one-step, all the knowledge that could be used to describe the generalisation pro-cess and considered legibility during change of scale. It includes an operation ontology which organises generalisation operations and conditions, aiming at describing the properties, behaviours and relationships of generalisation operations in such a way that they can be selected and used to resolve conditions automati-cally. Figure 1 shows the operator ontology. The condition in-cludes logical conflict, congestion, high density congestion, and imperceptibility. An algorithm ontology connects the generali-sation algorithms to different feature types. For example, algo-rithm implements smoothing and applies it to the road feature type. This work is able to automatically select, sequence and execute map generalisation operations according to user require-ments however, parameter values are not set automatically. Dif-ferent algorithms performing the same generalisation operation may have different parameters or even have similar parameters but with different values according to the context. In addition, algorithms implementing several operators are not modelled yet.
(Touya et al., 2012) provide an ontology to manage spatial rela-tions and relational constraints between geographic features in the context of generalisation. It classifies spatial relations in eight categories forming a taxonomy of relations, which helps to automatically select algorithms in a process of generalisation or on-demand mapping, includes topological relationships with
1
http://www.ordnancesurvey.co.uk/oswebsite/ontology/
Figure 1: Operator ontology
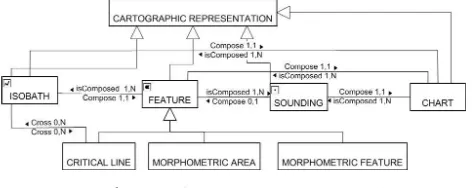
Figure 2: Relational constraint ontology
the classical 9-intersection primitives (Egenhofer and Franzosa, 1991), orientation relations such as relative orthogonality, posi-tion relaposi-tions (relative posiposi-tion and proximity), shape, size, se-mantic relations, and movement relations which can be expressed by a movement verb like “the river circles the building”. In ad-dition, generalisation constraints are gathered in a relational straint ontology. Figure 2 represents four types of relational con-straints in a hierarchical model. These ontologies help to im-prove map generalisation automation and on-demand mapping. But this work has not connected spatial relationship ontology and constraint ontology together. Relating to the whole generalisation process, generalisation operations also need to be considered in the model.
In these works, concepts describing objects portrayed on the map relate to objects stored in the topographic database without ambi-guity. For example, in the expression “the river circles the build-ing”, the river and the building already have properties including a geometry explicitly defined in the database. This does not apply to undersea features which are not modelled in the bathymetric database. One supplementary requirement is the characterisation of undersea features. As said by (Janowicz et al., 2013), “the defi-nitions of feature types are a product of human perception, cogni-tion, current state of knowledge and social agreement” and so are often domain-specific. In hydrography, a nomenclature is pro-vided by the IHO (IHO, 2008) and used in the GEBCO gazetteer of undersea feature names2. As each feature type is defined by one or two sentences, a semantic model is required to capture the meaning into a set of concepts and relationships.
On one hand, such model leads to an object-based representa-tion where each feature is a part of the seafloor corresponding to common perception but whose properties including its bound-aries are not clearly defined (Smith and Mark, 2003). On the other hand, the bathymetry is defined by a field model (and stored in the database by a discrete set of soundings and isobaths), leading to what (Mark and Smith, 2001) called the “qualitative-quantitative divide”.
The ability to integrate field and object views of the landscape is essential for rastervector data-layer integration. Ontologies have been commonly used as a tool to capture the semantic meaning behind different types of landforms and extract them from ter-rain models. Most works were mostly concerned with the char-acterisation of specific landforms such as valleys (Straumann,
2
2009), eminences (Sinha and Mark, 2010), bays (Feng and Bit-tner, 2010) and reefs (Duce, 2009) where qualitative predicates are translated into numerical variables. Such characterisation leads to the loss of the inherent semantic vagueness of landforms and the “precisification” of the classification (Bittner, 2011).
One objective of this paper is to capture the semantic meaning of features as defined by the IHO nomenclature and to describe how these features are portrayed on the chart. The portrayal de-pends on the type of representation and the rules to observe dur-ing the generalisation process. As a consequence, two ontologies are designed. The first ontology focuses only on the semantics of undersea features in the maritime context by defining quali-tative predicates associated to some feature properties, preserv-ing the semantic vagueness of the definition. In the second on-tology, the predicates are translated into quantitative properties directly related to how features are portrayed on the chart. Fea-tures are represented by sets of isobaths and soundings and have a precise definition (exact depth, crisp boundary) corresponding to how the cartographer draws and the user perceives the features on the chart. As the representation necessitates a selection and a generalisation of the features, constraints and operations are also included in the ontology.
3 CONCEPTUALISATION OF THE BATHYMETRIC REPRESENTATION
3.1 The ontology framework
The undersea feature ontology presented here extends the model defined by (Yan et al., 2014) which only focused on feature clas-sification by integrating generalisation constraints, allowing the characterisation of cartographic conflicts in the generalisation process. The authors, based on the standardised nomenclature of the IHO (IHO, 2008) built an ontology based on shape prop-erties and spatial relationships between features. The ontology follows the framework introduced by (Fonseca, 2001) (Figure 3). In the context of nautical charts and navigation, the first ontology conceptualises knowledge about undersea features and is part of the maritime domain. Therefore the application domain ontology (ADO) describes concepts that belong to the maritime domain. It is composed of a subject ontology (defining the features) and a task ontology. The latter describes activities that require or anal-yse seafloor information. In this context, the task ontology relates to navigation and its definition is beyond the scope of this paper.
The phenomenological domain ontology (PDO) deals with the representation of undersea features on the chart. The method ontology focuses on representation techniques and includes el-ements on the chart (soundings, isobaths). It is composed of a cartographic representation ontology which includes operations matching features from the ADO to the PDO and of a generalisa-tion process ontology where generalisageneralisa-tion constraints and their evaluations are formalised. Finally, the measurement ontology refers to data collection techniques (e.g. echo sounding) and, like the task ontology, is out of the scope of this work.
3.2 Ontology of undersea features
The subject ontology describes the 46 types of feature found in the IHO nomenclature (IHO, 2008). Like for any landform de-scriptions, terms are fuzzy and scale dependent. They describe the feature properties (its shape and composition) and relation-ships (mereological and topological). Properties of the undersea feature concept are summarised in Figure 4. The composition concept describes the material composing the feature with val-ues such as rock, sand, sediment and so on. Hazard indicates
Phenomenological
Figure 3: Structure of the ontology
Undersea feature
Figure 4: The undersea feature concept
whether the feature represents a danger for navigation, like a reef or a bank. The depth level is defined as a spatial property relat-ing features with different parts of the seafloor such as the conti-nental shelf or the basin which have their own geomorphological properties and form a partition of the seafloor. As an example, a levee is defined as a “depositional natural embankment bor-dering a canyon, valley or seachannel on the ocean floor”. The first terms “depositional natural” define the feature composition, “on the ocean floor” defines the depth level and “bordering a canyon, valley or seachannel” defines the topological relationship that shall be observed to characterise a levee.
The shape of a feature is defined by its saliences, leading to the definition of ashapeconcept which can be refined into different concepts describing parts of the feature:
• the tip (i.e. the extremity) type which can be assimilated to a point (as in a peak), a line (as in a ridge) or an area (as in a plateau or a bank);
• the relative spatial extent, whether the feature base is large or small;
• the vertical profile defining the overall shape and including both the morphometric class (Wood, 1996) and the type of slope (steep, gentle);
• and the horizontal profile which describes the shape of the base (elongated, equidimensional).
The reader is referred to (Yan et al., 2014) for a full description of these concepts. For example, aplateauis defined as a “flat or nearly flat elevation of considerable areal extent, dropping off abruptly on one or more sides”. Hence aplateauis composed of a “flat or nearly flat” tip, its vertical profile is an “elevation drop-ping off abruptly on one or more sides” and its relative spatial extent is “considerable”. These different terms have been for-malised into a set of concepts that are summarised in Figure 5.
Tip Type Horizontal Profile
Vertical Profile Relative Spatial Extent
Point Line Area
Slope Horizontal Plane Eminence
Depression
Shape value has Tip Type
has Horizontal Profile
has Relative Spatial Extent
hasVertical Profile Undersea Feature
Figure 5: The shape concept describing a feature, based on (Yan et al., 2014)
Figure 6: Chart elements in the method ontology
where features from the IHO correspond to the most specialised concepts at the bottom of the hierarchy, and other concepts are obtained by generalisation. For example, theSeamountand the
Hilldefined in the IHO terminology are generalised asPeak Fea-turewhich gathers all features whose vertical profile is a peak and, at the next level, the Peak FeatureandRidge Featureare generalised into Eminence Featurewhose vertical profile is an eminence. By this way, the granularity can be adjusted according to the accuracy of input data or the requirements of the applica-tion. For a full review of the feature description and hierarchy, the ontology is accessible online3.
3.3 Ontology of the representation
3.3.1 The cartographic ontology The method ontology for-malises the way undersea features are represented on the chart. Two categories of concepts are considered to describe the in-formation portrayed on the map: the graphical elements such as soundings and isobaths which are effectively drawn on the chart and the visual elements which are perceived by users based on their interpretation. These include morphometric features trans-lating undersea features of the ADO and other characteristic fea-tures such as critical lines and areas defined by different sounding densities. These concepts are represented in Figure 6. The chart concept includes metadata such as the chart scale and the sym-bology.
The method ontology also describes the processes classifying the features. They correspond to functions translating the different feature properties presented in the ADO into functions that apply to features defined by isobaths and soundings such as the area and the height of features.
3.3.2 The generalisation process ontology The generalisa-tion process ontology is the part of the method ontology which describes and manages the whole generalisation process. This on-tology integrates the cartographic onon-tology mentioned above and includes three other concepts: generalisation constraints, evalu-ation and generalisevalu-ation operevalu-ations. Generalisevalu-ation constraints
3
https://www.dropbox.com/s/vjigdrzpc6nsamw/underseaP.owl
Figure 7: Classification of generalisation constraints. For con-ciseness, most specialised constraints are omitted.
describe the chart requirements to be considered during the pro-cess. They can be classified in 6 categories (Harrie and Weibel, 2007) and are summarised below.
• Legibility constraints: chart elements must be big enough and a minimum distance must be observed between them;
• Functional constraints: a depth portrayed on the map can never be deeper than the real depth (safety constraint) and main navigation routes and berthing places must be high-lighted;
• Structural and topological constraints: relationships be-tween elements must be maintained;
• Position and shape constraints: relative and absolute posi-tion of elements must be preserved.
Constraints can be contradictory and so cannot always be satis-fied all together: if a feature is enlarged to be legible, its shape is modified. The objective of the generalisation process is to find a solution that best satisfies all constraints. Among them, some constraints are satisfied at the beginning of the process and shall be preserved (e.g. the shape and position) while others corre-spond to conflicts which must be corrected to yield a valid so-lution (e.g. the legibility). The constraint concept is therefore arranged in different concepts divided between preservation con-straints and conflicts (Figure 7). All concon-straints have not been portrayed. The whole taxonomy of constraints can also be ac-cessed online.
The generalisation process being driven by the features, con-straints are first defined at feature level. The following concon-straints are identified:
• Functional constraint: features that are relevant to naviga-tion must be emphasised. This constraint is used to choose operators according to the types of feature;
• Legibility constraint: a minimum distance between features must be observed, features must have a minimum area;
• Shape constraint: the different shape properties of the fea-ture (Figure 5) shall be preserved;
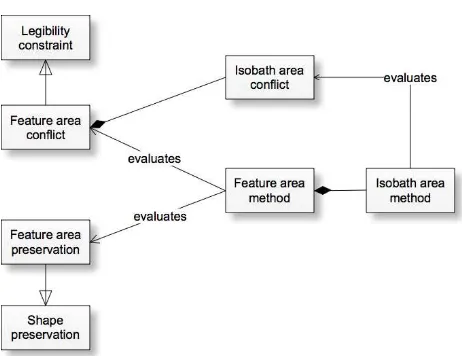
Figure 8: Example of relationships between constraints and eval-uations
As shown in Figure 6, features are composed of isobaths and soundings. Therefore, feature constraints can be decomposed into sounding and isobath constraints. For example, a feature needs to observe a minimum area to be legible. That means that the element on the chart defining the feature boundary, e.g. an isobath, must also satisfy a minimum area. This is shown on Fig-ure 8 by the fact that the Isobath Area Conflict is a component of the Feature Area Conflict.
Evaluation is the process of examining if elements satisfy con-straints by assigning a score. Evaluation is performed first to de-tect conflict and estimate if some operations are needed. Evalu-ation is also performed during an operEvalu-ation to control the pro-cess and after to assess the quality of the result. As for con-straints, evaluation is performed at both feature level and isobath and sounding level. Methods at feature level are composed of methods that apply to soundings and isobaths.
Evaluation methods are mainly geometrical: distance, area, den-sity, shape and displacement. Distance can be computed between any two kinds of elements which are disjoint, a conflict being observed if two elements are too close. Area is computed on fea-tures and on closed isobaths, also resulting in a conflict if too small. Density of soundings applies to features and groups of soundings. It can characterise conflicts if the density is too high and control sounding selection by defining a value according to the morphology (Brosset and Devogele, 2004). Shape and dis-placement are used to measure the difference between an original feature or isobath and its current position. They are used both to control a deformation as when applying continuous optimisa-tion techniques and to evaluate the quality of an operaoptimisa-tion. Non-geometrical evaluation methods relate to structural and functional constraints mainly. They are used in selecting and controlling op-erations. For example, two features can be aggregated if they are two eminences only and an isobath cannot be removed if it leads to a topological inconsistency.
An evaluation is associated to the constraint it evaluates and to the element it applies to. Depending on its type, an evaluation will return a numerical value or a boolean indicating how big a constraint violation is, such as the displacement applied on an iso-bath or whether the safety constraint is violated when removing a sounding. For example, on Figure 8, the feature area method can evaluate an area conflict or whether the area of the feature has been preserved or not. The feature being delineated by an iso-bath, the area is computed, by composition, by the isobath area method.
4 IMPLEMENTATION 4.1 System design
Both ADO and PDO ontologies were designed in Prot´eg´e 4.2 and integrated in a Virtuoso triplestore database server. Virtuoso stores all the concepts and relationships of the ontology, forming an ontology database and is also used to store the bathymetric database from which chart data are extracted. The schema of the bathymetric database is directly generated from the ontology database. Knowledge is defined as triples in the form of subject-predicate-objectexpressions so that predicates connect data with concepts, e.g.isobath I - is an instance of - Isobath concept, and data together (e.g. isobath I - is part of - feature F). Constraints and evaluation are also defined as concepts in the ontology and connected by predicates to cartographic elements. Examples of triples in the ontology database areArea conflict - is a - Legibil-ity constraint,Area measure - evaluates - Area conflictandArea measure - applies to - Feature.
The database server was connected to an existing generalisa-tion platform which was developed in C++ using Qt and CGAL libraries. The platform relies on previous works from (Guil-bert, 2013) for the identification of features where only isobaths were considered and isobath generalisation operations are imple-mented. Therefore, although all feature types are defined in the ADO, only features delineated by isobaths and forming promi-nences or depressions are considered in the representation. At its creation, the bathymetric database is populated only by isobaths and soundings. Topological relationships between isobaths and soundings are first added with a constrained Delaunay triangula-tion. Shape properties of each features are computed from their soundings and isobaths and topological relationships between the features are extracted into a feature tree. Classification requires the translation of semantic predicates defined in the ADO into geometrical measures and topological relationships that apply to properties in the PDO. The association between features in the ADO and the PDO is done by defining threshold values for properties in the PDO translating the qualitative predicates in the ADO. Association can then be done by storing the required pa-rameter values together with the predicates from both sides.
Once classification is done, the system evaluates conflicts which require generalisation. The ontology is used to infer for each fea-ture which evaluation methods shall be applied and which con-straints are evaluated. Composition relationships automatically trigger the evaluation of constraints on isobaths and soundings. For example, evaluating the distance between two features de-lineated by isobaths is done by evaluating the distance between the isobaths. At this stage, generalisation operations are not per-formed and conflicts are stored for record only.
4.2 Observations
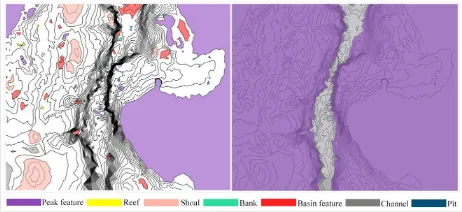
Figure 9: Results of undersea feature characterisation
Table 1: Undersea features classified from Figure 9. Features defined in the IHO terminology in bold.
Peak feature
Reef Bank Shoal Pit Channel Basin feature
25 6 4 9 34 6 17
features. Figure 9 right shows features at the top of the hierarchy. The hierarchy of feature concepts defined in the ADO was used as a decision tree to reach the highest level of precision. Seven types of feature (peak feature, reef, bank, shoal, pit, channel and basin feature) were identified and characterised (Table 1). The first four features are prominences and three of them are defined in the IHO terminology. The last three are depressions and are not in the terminology because in shallow areas, noticeable features are mainly features which represent a danger for navigation. A channel corresponds to an elongated depression. The largest one, shown on Figure 9 right indicates a navigation route and contains most of the other depressions.
Conflicts are detected by the evaluation methods and can be char-acterised by the elements involved in the conflict, the violated constraint and the score describing the importance of the viola-tion. Examples of evaluation results are given in Figure 10 where each evaluation is described by the features involved and the eval-uation score, the bigger the score the larger the violation. A score of 0 means that no conflict occurs and so no record is made in the database.
5 CONCLUSION
This paper introduces an ontology for the generalisation of the bathymetry on nautical charts. The ontology is centred on un-dersea features which are identified and to be generalised during the process. The ontology is divided into an application domain, defining the feature properties, and a phenomenological domain,
Area conflict Feature Area score
367 0
368 46
370 0
371 0
372 162
Distance conflict FID1 FID2 Distance score
364 365 200
364 366 200
365 366 200
365 370 0
366 370 0
Figure 10: Examples of conflict evaluations. A score of 0 means that no conflict occurred
addressing their representation on a chart. On top of the IHO definitions, general concepts were added to provide a descrip-tion at different granularities. Within the PDO, the generalisadescrip-tion process ontology introduces constraint, evaluation and operation concepts which describe how a generalised representation can be achieved. Features being composed of soundings and isobaths, those concepts are also defined at two levels where concepts at feature level are composed of concepts at isobath and sounding level. Currently, operations and relationships with these concepts have not been detailed however more details are available online.
One important issue in this work is the characterisation of under-sea features. The model proposed here contributes to defining a formal semantics of undersea features so as to restrict their inter-pretation. By providing two separate ontologies, a solution to the qualitative-quantitative divide albeit in a narrow context as only one standard semantic and one representation are combined.
All concepts defined in the ontology have not been implemented yet. Only features that are bounded by one or several isobaths are identified. Due to the inherent vagueness of landforms, delineat-ing undersea features with a crisp boundary is subjective however it corresponds to the representation that is given on the chart and provides a rigorous definition for shape properties. Further work can be done by representing features by one or several soundings (e.g. a seamount where only the summit is marked) or by deal-ing with plane features. The type of chart (large or small scale, coastal or offshore navigation) can also be taken into account to consider only feature classes relevant to this chart.
At this stage, the platform can detect conflicts and, by making use of the constraints, go through a list of operations and select those relevant for the conflict. Two directions are considered. First, generalisation operations need to be implemented so that plans made from the evaluation can be performed. Second, the ontology can be further developed so that generalisation plans can be inferred directly from the ontology. A multi-agent system is being developed where undersea features can perform different plans and select the best result (Zhang and Guilbert, 2011). The benefit of MAS is that features can be modelled as autonomous agents which evaluate their environment and control isobaths and sounding agents at lower levels in line with the feature-centred approach designed in the ontology.
At a more conceptual level, other nomenclatures and representa-tions can be considered. For instance, the IHO regularly updates its standards and a 3D representation may be considered. Such work may require the definition of a common ontology pattern that can be reused but also which would facilitate their integra-tion.
ACKNOWLEDGEMENTS
The work presented in this paper is funded by the Consulate Gen-eral of France in Hong Kong and by the R´egion Bretagne in France under grant 0211/ ARE 09011/00026102.
REFERENCES
Bittner, T., 2011. Vagueness and the trade-off between the clas-sification and delineation of geographic regions - an ontological analysis. International Journal of Geographical Information Sci-ence 25(5), pp. 825–850.
Duce, S., 2009. Towards an ontology for reef islands. In: K. Janowicz, M. Raubal and S. Levashkin (eds), GeoSpatial Semantics, Lecture Notes in Computer Science, Vol. 5892, Springer-Verlag, Berlin Heideberg, pp. 175–187.
Egenhofer, M. J. and Franzosa, R. D., 1991. Point-set topological spatial relations. International Journal of Geographical Informa-tion System 5(2), pp. 161–174.
Feng, C.-C. and Bittner, T., 2010. Ontology-based qualitative feature analysis: Bays as a case study. Transactions in GIS 14(4), pp. 547–568.
Fonseca, F. T., 2001. Ontology-driven geographic information systems. PhD thesis, The University of Maine.
G´omez-P´erez, A., Ramos, J., Rodr´ıguez-Pascual, A. and Vilches-Bl´azquez, L., 2008. The IGN-E case: Integrating through a hid-den ontology. In: A. Ruas and C. Gold (eds), Headway in Spatial Data Handling, Springer, pp. 417–435.
Gould, N. and Chaudhry, O., 2012. An ontological approach to on-demand mapping. In: 15th ICA Generalisation Workshop, Istanbul, Turkey.
Guilbert, E., 2013. Multi-level representation of terrain features on a contour map. Geoinformatica 17(2), pp. 301–324.
Harrie, L. and Weibel, R., 2007. Modelling the overall pro-cess of generalisation. In: W. Mackaness, A. Ruas and L. Sar-jakoski (eds), Generalisation of Geographic Information: Carto-graphic Modelling and Applications, Elsevier Science, Amster-dam, pp. 67–87.
IHO, 2008. Standardization of undersea feature names. 4th edn, International Hydrographic Organization, Monaco.
Janowicz, K., Scheider, S. and Adams, B., 2013. A geo-semantics flyby. In: Reasoning Web. Semantic Technologies for Intelli-gent Data Access, Lecture Notes in Computer Science, Vol. 8067, pp. 230–250.
Mark, D. and Smith, B., 2001. A science of topography: bridging the qualitative-quantitative divide. In: Geographic Information Science and Mountain Geomorphology, Springer-Praxis, pp. 75– 100.
Peters, R., 2012. A voronoi- and surface-based approach for the automatic generation of depthcontours for hydrographic charts. MSc Thesis, Delft University of Technology.
Sinha, G. and Mark, D. M., 2010. Cognition-based extraction and modelling of topographic eminences. Cartographica 45(2), pp. 105–112.
Smith, B. and Mark, D. M., 2003. Do mountains exist? towards an ontology of landforms. Environment and Planning B: Planning and Design.
Straumann, R. K., 2009. Experiences in developing land-form ontologies. In: R. Purves, S. Gruber, R. Straumann and T. Hengl (eds), Proceedings of Geomorphometry 2009, Univer-sity of Zurich, pp. 17–21.
Touya, G., Balley, S., Duchˆene, C., Jaara, K., Regnauld, N. and Gould, N., 2012. Towards an ontology of spatial relations and relational constraints. In: 15th ICA Generalisation Workshop, Istanbul, Turkey.
Wood, J., 1996. The geomorphological characterisation of digital elevation models. unpublished PhD thesis, University of Leices-ter.
Yan, J., Guilbert, E. and Saux, E., 2014. An on-tology of the submarine relief for analysis and repre-sentation on nautical charts. The Cartographic Journal. http://dx.doi.org/10.1179/1743277413Y.0000000050.