DETERMINING SPECTRAL REFLECTANCE COEFFICIENTS FROM
HYPERSPECTRAL IMAGES OBTAINED FROM LOW ALTITUDES
P. Walczykowski a, A. Jenerowicz a*, A. Orych a, K. Siok a
a MUT Military University of Technology, Faculty of Civil Engineering and Geodesy, Geodesy Institute,
Department of Remote Sensing and Photogrammetry –
(piotr.walczykowski; agnieszka.jenerowicz; agata.orych; katarzyna.siok)@wat.edu.pl
Commission VII, WG VII/3
KEY WORDS: hyperspectral camera, spectral reflectance coefficients, spectral characteristic, UAV, aerial, push-broom scanner, radiometric correction
ABSTRACT:
Remote Sensing plays very important role in many different study fields, like hydrology, crop management, environmental and ecosystem studies. For all mentioned areas of interest different remote sensing and image processing techniques, such as: image classification (object and pixel- based), object identification, change detection, etc. can be applied. Most of this techniques use spectral reflectance coefficients as the basis for the identification and distinction of different objects and materials, e.g. monitoring of vegetation stress, identification of water pollutants, yield identification, etc. Spectral characteristics are usually acquired using discrete methods such as spectrometric measurements in both laboratory and field conditions. Such measurements however can be very time consuming, which has led many international researchers to investigate the reliability and accuracy of using image-based methods. According to published and ongoing studies, in order to acquire these spectral characteristics from images, it is necessary to have hyperspectral data. The presented article describes a series of experiments conducted using the push-broom Headwall MicroHyperspec A-series VNIR. This hyperspectral scanner allows for registration of images with more than 300 spectral channels with a 1.9 nm spectral bandwidth in the 380- 1000 nm range. The aim of these experiments was to establish a methodology for acquiring spectral reflectance characteristics of different forms of land cover using such sensor. All research work was conducted in controlled conditions from low altitudes. Hyperspectral images obtained with this specific type of sensor requires a unique approach in terms of post-processing, especially radiometric correction. Large amounts of acquired imagery data allowed the authors to establish a new post- processing approach. The developed methodology allowed the authors to obtain spectral reflectance coefficients from a hyperspectral sensor mounted on an unmanned aerial vehicle, ensuring a high accuracy of obtained data.
* Corresponding author
1. INTRODUCTION
Nowadays remote sensing allows to obtain a number of very detailed information about investigated objects. The significant development of technology, especially in the area of electronics (i.e. sensors), aerial platforms and methodologies, enable construction of more sensitive and precise measurement devices, is the driving force behind progress in remote sensing. The foundation of modern remote sensing is spectroscopy, that is a science that allows for acquiring and analyses of electromagnetic spectra, which are results of interactions between electromagnetic radiation with objects. This science is used for all issues related to the description of matters’ structure and identification of substances and is an object of studies in the field of physic, astronomy, chemistry, genetic engineering, natural science and many. Optical spectroscopy which is commonly used in modern remote sensing, is the study of the interaction between light and matter. Thereby spectrometric measurements are measurements of photons in the function of wavelength. Because all particular particles absorb radiation in a characteristic way (depending on wavelength used and the chemical bonds making up the investigated substance), it is possible to identify objects and substances using just their spectral characteristics (Kirkbride, 2000).
Each substance reflects a different amount of radiation and with a change in wavelength the value of this varies. Spectral reflectance coefficients represented in a function of wavelength, known as spectral characteristic describes the dependence of the reflectance coefficients of an object's surface from the wavelength of the incident radiation. These characteristics allow for the identification of the vast majority of objects and are stored in a spectral libraries. Moreover, each substance has certain distinct bands of the electromagnetic spectrum in which an analysis of the reflectance allows for the assessment of the quality or condition of the tested objects (Walczykowski et al., 2013).
Spectral reflectance characteristics are usually acquired using discrete methods such as spectrometric measurements in both laboratory and field conditions. Spectral reflectance coefficients obtained with spectroradiometers and spectrophotometers are characterized by a high accuracy. However, due to the nature and structure of the instruments used for this purpose, spectral characteristics can be obtained only from one point of the investigated object at any given time, what is extremely problematic when the structure of the investigated object is not homogenous and is changing in time. Moreover, high quality spectrometers are only available for in situ (from close range) and laboratory measurements, and there The International Archives of the Photogrammetry, Remote Sensing and Spatial Information Sciences, Volume XLI-B7, 2016
XXIII ISPRS Congress, 12–19 July 2016, Prague, Czech Republic
This contribution has been peer-reviewed.
is lack of variety of aerial spectrometers. Such measurements however can be very time consuming, which has led many international researchers to investigate the reliability and accuracy of using image-based methods (e.g. Kokaly et al., 2003; Yen- Ben et al., 2006; etc.).
In literature we can find a lot of examples of determining spectral characteristics from satellite images (i.e. Landsat, CHRIS/ PROBA and MERIS, etc.) and simultaneous in situ
spectral measurements of water, vegetation, etc. (with spectroradiometers and spectrophotometers), that allow for calibration of acquired images, and therefore it is possible to obtain absolute spectral reflectance characteristics from images (e. g. Hame, 1991; Guanter et al., 2003; Segl et al., 2003; Guanter et al., 2006; Goetz, 2009; Maliki et al., 2012; Olmanson et al., 2013). As the reference panel white reference panels are also used, enabling calculation of spectral characteristics.
All mentioned methods of obtaining spectral reflectance characteristics from images require sensor calibration before image acquisition or radiometric calibration of the imagery in post- processing on the basis of reference reflectance panels. According to concept presented in this paper and (Walczykowski et al., 2013) it will be possible to obtain spectral reflectance coefficients during laboratory and in situ
measurements without using reference panels, only with the use of an imaging camera and information about lighting condition during image acquisition. The basis for obtaining the correct reflected values in each registered channel of electromagnetic radiation is the proper registration of images, which will be ensured by correct exposure parameters that would be adequate for the light intensity during the measurements. This methodology would be adequate for images acquired from low altitudes, where the influence of the atmosphere and aerosols is not so strong.
2. MEASUREMENT STATION
The main aim of this paper is to present applied methodology for determining the relationship between exposure parameters of the hyperspectral camera and light intensity in order to determine absolute spectral reflectance characteristics from the hyperspectral imagery without previous calibration of the imaging sensor. In order to perform the task, an empirical approach was selected based on a series of measurements performed under laboratory conditions. The purpose of the measurements was to analyze the impact of the exposure parameters of the camera: the exposure time, the gain value on the value of the pixel brightness- digital number (DN) of a different reference panels.
For the study one VNIR hyperspectral camera was used, produced by Headwall.
The Headwall MicroHyperspec A-series VNIR is a push- broom sensor, that allows for continuous recording of the image line camera’s control and selection of exposure parameters, i.e. the exposure time, the gain value, the number of frames per second.
Figure 1. The push-broom hyperspectral imager- the Headwall MicroHyperspec A-series VNIR
Figure 2. The measurement station
To ensure the repeatability and accuracy of conducted measurements, a number of assumptions about the measurement methods and measurement station were made.
First all calculations were done on DN values of exactly the same surface area of four reflectance reference standards – the Zenith Lite- reference panels which have 95%, 50%, 20% and 5% lambertian reflectance in 250-2500 nm range. To ensure the correctness of calculations the 4 additional reference panels: Zenith Diffuse reference panels (80%, 25%, 10% and 2.5%) were used.
Next, a constant and reliable light source was used throughout the experiment – ASD Inc Pro Lamps. These lamps have a 70W power and give constant light in the 350-2500nm range. Four lamps were used to ensure the studied reference panels were evenly illuminated from all sides.
In addition to that the constant measurements of light intensity was conducted.
Figure 3. Reference reflectance panels used in the experiment The International Archives of the Photogrammetry, Remote Sensing and Spatial Information Sciences, Volume XLI-B7, 2016
XXIII ISPRS Congress, 12–19 July 2016, Prague, Czech Republic
This contribution has been peer-reviewed.
Figure 4. Spectral reflectance characteristics of reference reflectance panels used in the experiment
3. METHODOLOGY
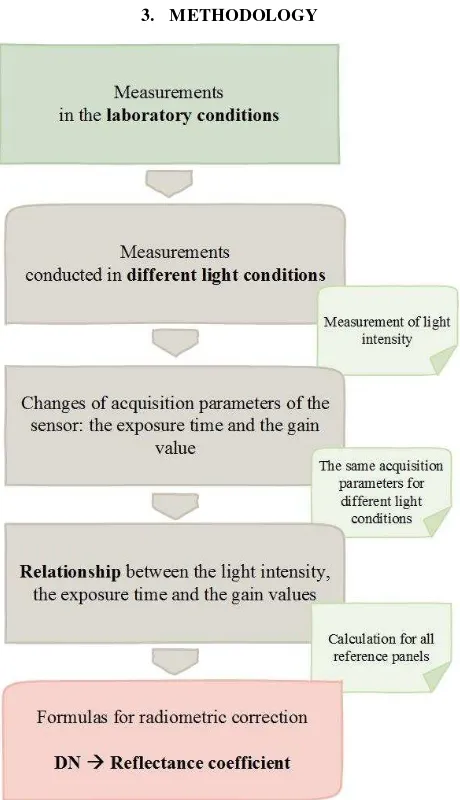
Figure 5. Methodology for determining spectral reflectance coefficients from hyperspectral image without camera
calibration
Figure 6. DN values for reference panels on the raw hyperspectral image
The main aim of this paper is to present briefly applied methodology for determining the relationship between exposure parameters of the hyperspectral camera and light intensity in order to determine absolute spectral reflectance characteristics from the hyperspectral imagery without previous calibration of the imaging sensor.
In order to perform the task, an empirical approach was selected based on a series of measurements performed under laboratory conditions. The developed methodology is based on acquisition of series of raw images- without previous sensor calibration. All measurements were conducted in the laboratory condition to ensure stable conditions of measurements. To establish the relationship between acquisition parameters, amount of light and coefficients that would allow to change DN value to reflectance coefficients, during series of measurements the amount of light was being changed. For each light intensity (that was constantly verified with light meter) the series of images had been acquired- images were acquired with different exposure times and gain levels. The same acquisition parameters were applied for all light conditions during measurements.
Due to fact that every channel of the Headwall MicroHyperspec A-series VNIR is a push- broom sensor has different sensitivity, all formulas had been developed separately for all camera’s spectral bands.
Determined formulas allowed to recalculate DN values to reflectance coefficients.
4. SUMMARY AND RESULTS
All formulas obtained after applying developed methodology allow for determining the exposure time and the gain value for every spectral band of Headwall camera, which are needed to obtain expected values of the reference panels with an accuracy ±7%. Due to great amount of noises on edges of spectral range, it was impossible to better total accuracy.
It should be take into account that all developed formulas are specific to the researched camera model and lenses. The purpose of this article is to present a methodology for determining these parameters in laboratory conditions.
The obtained accuracy of ±7% can be further increased by additional measurements in both laboratory and field conditions.
The International Archives of the Photogrammetry, Remote Sensing and Spatial Information Sciences, Volume XLI-B7, 2016 XXIII ISPRS Congress, 12–19 July 2016, Prague, Czech Republic
This contribution has been peer-reviewed.
ACKNOWLEDGEMENTS
The presented article is part of research work carried out in the research project PBS 933/2016 financed by the Military University of Technology, the Faculty of Civil Engineering and Geodesy, Department of Remote Sensing and Photogrammetry.
REFERENCES
Chang, C.-I., 2003. Hyperspectral imaging: techniques for spectral detection and classification, Kluwer Academic/Plenum Publishers, New York, 2003.
Goetz, A. F. H., 2009. Three decades of hyperspectral remote sensing of the Earth: A personal view, Remote Sensing of
Environment, Volume 113, Supplement 1, September 2009, pp.
S5-S16.
Guanter L., Alonso L., Moreno J., First Results From the PROBA/CHRIS Hyperspectral/Multiangular Satellite System Over Land and Water Targets, IEEE GEOSCIENCE AND
REMOTE SENSING LETTERS, vol. 2, no. 3, July 2005, 250-
254.
Guanter L., Ruiz-Verdú A., Odermatt D., Giardino C., Simis S., Estellés V.,Heege T., Antonio Domínguez-Gómez J., Moreno J., 2009, Atmospheric correction of ENVISAT/MERIS data over inland waters: Validation for European lakes, Remote
Sensing of Environment 2009, RSE-07524.
Hame, T., 1991. Spectral Interpretation of changes in forest using satellite scanner images, Acta Forestalia Fennica 222, pp. 1- 111.
Han L., 1997, Spectral reflectance with varying suspended sediment concentration in clear and algae- laden waters,
Photogrammetric Engineering & Remote Sensing, vol. 63, no 6,
701- 705.
Hollas J.M., 2004. Modern Spectroscopy, 4th Edition, 8-1; pp. 60-40.
Kirkbride K.P., 2000. Spectroscopy: Basic Principles,
Encyclopedia of forensic sciences, pp. 194-191.
Kokaly R.F., Despainb D.G., Clarka R.N., Livoa K.E., 2001. Mapping vegetation in Yellowstone National Park using spectral feature analysis of AVIRIS data, Remote Sensing of
Environment,Volume 84, Issue 3, March 2003, pp. 437–456.
Maliki, A. A., Owens, G., Bruce, D., 2012. Capabilities of Remote Sensing Hyperspectral Images for the Detection of Lead Contamination: a Review, SPRS Annals of Photogrammetry,
Remote Sensing and Spatial Information Sciences, Volume I-7,
2012, pp.55-60.
Olmanson, L. G:, Brezonik, P. L., Bauer, M. E., 2013. Airborne hyperspectral remote sensing to assess spatial distribution of water quality characteristics in large rivers: The Mississippi River and its tributaries in Minnesota, Remote Sensing of
Environment, Volume 130, 15 March 2013, pp. 254-265.
Segl, K., Roessner, S., Heiden, U., Kaufmann, H., 2003. Fusion of spectral and shape features for identification of urban surface
cover types using reflective and thermal hyperspectral data,
ISPRS Journal of Photogrammetry and Remote Sensing,
Volume 58, Issues 1–2, June 2003, pp. 99-112.
Walczykowski, P., Jenerowicz, A., Orych, A., 2013. Using XEVA video sensors in acquiring spectra reflectance coefficients, International Conference on Environmental
Engineering (ICEE) Selected papers, 9th International
Conference on Environmental Engineering, MAY 22-23, 2014 Vilnius, LITHUANIA
Yen-Ben, Ch., Zarco-Tejada, P. J., Riaño D., Rueda C. A., 2006. Estimating vegetation water content with hyperspectral data for different canopy scenarios: Relationships between AVIRIS and MODIS indexes, Remote Sensing of Environment
Volume 105, Issue 4, 30.12.2006,354–366
Revised June 2015
The International Archives of the Photogrammetry, Remote Sensing and Spatial Information Sciences, Volume XLI-B7, 2016 XXIII ISPRS Congress, 12–19 July 2016, Prague, Czech Republic
This contribution has been peer-reviewed.