CLOUD
CLOUD
CLOUD
CLOUD DETECTION
DETECTION
DETECTION
DETECTION METHOD
METHOD
METHOD
METHOD BASED
BASED
BASED
BASED ON
ON
ON
ON FEATURE
FEATURE
FEATURE
FEATURE EXTRACTION
EXTRACTION
EXTRACTION
EXTRACTION IN
IN
IN
IN REMOTE
REMOTE
REMOTE
REMOTE
SENSING
SENSING
SENSING
SENSING IMAGES
IMAGES
IMAGES
IMAGES
YU Changhuia,*, Yuan Yuanb,Miao Minjingb, Zhu Menglua
aSchool of Remote Sensing and Information Engineering , Wuhan University, 129# Luoyu Road, Wuhan, China,[email protected]
bSchool of Printing and Packaging, Wuhan University,129# Luoyu Road, Wuhan, China [email protected]
KEY KEY KEY
KEY WORDS:WORDS:WORDS:WORDS:Remote Sensing Image, Cloud Detection, Cloudiness, Feature Extraction, Classification, Discriminant Model
ABSTRACT: ABSTRACT: ABSTRACT: ABSTRACT:
In remote sensing images, the existence of the clouds has a great impact on the image quality and subsequent image processing, as the images covered with clouds contain little useful information. Therefore, the detection and recognition of clouds is one of the major problems in the application of remote sensing images. Present there are two categories of method to cloud detection. One is setting spectrum thresholds based on the characteristics of the clouds to distinguish them. However, the instability and uncertainty of the practical clouds makes this kind of method complexity and weak adaptability. The other method adopts the features in the images to identify the clouds. Since there will be significant overlaps in some features of the clouds and grounds, the detection result is highly dependent on the effectiveness of the features. This paper presented a cloud detection method based on feature extraction for remote sensing images. At first, find out effective features through training pattern, the features are selected from gray, frequency and texture domains. The different features in the three domains of the training samples are calculated. Through the result of statistical analysis of all the features, the useful features are picked up to form a feature set. In concrete, the set includes three feature vectors, respectively, the gray feature vector constituted of average gray, variance, first-order difference, entropy and histogram, the frequency feature vector constituted of DCT high frequency coefficient and wavelet high frequency coefficient, and the texture feature vector constituted of the hybrid entropy and difference of the gray-gradient co-occurrence matrix and the image fractal dimension. Secondly, a thumbnail will be obtained by down sampling the original image and its features of gray, frequency and texture are computed. Last but not least, the cloud region will be judged by the comparison between the actual feature values and the thresholds determined by the sample training process. Experimental results show that the clouds and ground objects can be separated efficiently, and our method can implement rapid clouds detection and cloudiness calculation.
1. 1. 1.
1. INTRODUCTIONINTRODUCTIONINTRODUCTIONINTRODUCTION
Clouds cover about 50% of the earth's surface. When acquiring remote sensing images, a large amount of clouds are recorded in the images at the same time. The existence of clouds in images not only affects the image quality but also make it difficult to extract accurate geo-spatial information from remote sensing images. In addition, due to the various thicknesses of clouds in nature it is difficult to extract the boundary between cloudy regions and cloudless regions and to label certain pixels as cloudy in digital images. Therefore, how to detect and identify the clouds of images has become the major difficulty to be solved in the process of image quality evaluation. Present there are two categories of method to cloud detection.The first category refers to multiple threshold method. The method based on the radiation characteristics of clouds and normally applied to the images generated by multispectral sensors. In images the main differences between cloud and object are their reflectance and temperature. By comparing the pre-setted thresholds of different properties and the actual values obtained from multi-channels, the cloudy regions in the images can be detected. However, the instability and uncertainty of the clouds makes this kind of method complexity and has weak adaptability. Another class called feature extraction methods. the clouds can be detected based on the principles that clouds and objects has different spatial characteristics and so has different image features. But there will be significant overlaps in some features of the clouds and ground objects, So the detection result is highly dependent on the effectiveness of the features. How to select the effective features is key to the discrimination of cloudy and clear regions.
Due to the limitations of current imaging equipment, the technology of acquiring multispectral information of remote sensing images is not mature enough; consequently, it lacks wide applicability for the cloud detection with multiple threshold method, while the method based on feature extraction is becoming the major research direction.
(a)clear image (b)cloudy image Figure 1. remote sensing images
2. 2. 2.
2. CLOUDCLOUDCLOUDCLOUD DDDDETECTIONETECTIONETECTIONETECTION MMETHODMMETHODETHODETHOD BBBBASEDASEDASEDASED ONONONON FFFFEATUREEATUREEATUREEATURE EEEEXTRACTIONXTRACTIONXTRACTIONXTRACTION ININ RININRRREMOTEEMOTEEMOTEEMOTE SSSSENSINGENSINGENSINGENSING
IIIIMAGESMAGESMAGESMAGES 2.1
2.1 2.1
2.1 CCCCloudloudloudloud DDDDetectionetectionetectionetection MethodMethod BasedMethodMethodBasedBasedBased OnOnOnOn FeatureFeatureFeatureFeature ExtractionExtractionExtractionExtraction in
in in
in RemoteRemoteRemoteRemote SensingSensingSensingSensing ImagesImagesImagesImages
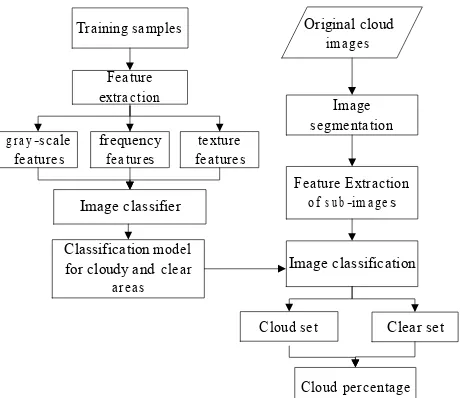
This paper presented a cloud detection method based on feature extraction in remote sensing images. The method separated the cloudy regions from the images by extracting multiple dimensional feature parameters to fully describe the different properties of the cloudy and clear areas. Firstly using the training images the method extract the feature vector to constructs the classifier based on the K-means algorithm. Then the detected images are divided into a lot of sub-images with same size. Through the feature vectors of sub-images and using
the classifier the sub-images are classified as cloudy image set and clear image set. Finally the method can give the proportions of cloudy in the detected images by compute the percentage of cloudy sub-image to the whole sub-images. The workflows of the method are illustrated in figure 2. There are two key procedures in the algorithm. One is the selection of effective image feature sets. Another is the construction of classifier.
Cloud set Clear set Feature
extraction
Image classifier Classification model for cloudy and clear
areas
Image segmentation
Image classification gra y-scale
features frequency features featurestexture
Cloud percentage Original cloud
images
Feature Extraction of s u b -image s Training samples
Figure 2. Workflow of the cloud detection method based on feature extraction in remote sensing images
2.2
2.22.22.2 FeatureFeatureFeatureFeature ExtractionExtractionExtractionExtraction
The feature parameter sets are important to construct the discriminant model of cloudy and clear images. Generally speaking, the ideal feature sets are supposed to satisfy the following principles simultaneously:
(1) Effectiveness: every feature should reflect the properties of the target to be recognized and classified to some extent; (2) Weak correlation: the correlation among different features needs to be smaller in order to reduce the mistake rate of classification;
(3) Integrality: the feature sets ought to embody all the properties of the target.
Through the observation of remote sensing images of various types, there are obvious differences between cloudy and cloudless areas in their gray-scale features, frequency features and texture features. So based three feature vectors the method makes up a feature space for remote sensing images.
2.2.1
2.2.12.2.12.2.1 Gray-scaleGray-scaleGray-scaleGray-scale featurefeaturefeaturefeature vectorvectorvectorvector
The gray information is the elementary statistics of the gray distribution in the images. The brightness of the cloudy areas is usually larger than that of the clear areas. In the meanwhile, there exist some distinctions in respect of gray distribution and changes. Therefore, it is possible to discriminate the cloudy images from the clear images roughly. By experimental analysis, the selected gray-scale features include the following four aspects.
1111)GGGGrayrayrayray----scalescalescalescale averageaverageaverageaverage
( ) (
)
i, j = image coordinates2222)GrayGrayGrayGray variancevariancevariancevariance
Gray variance is the measurement of the gray distribution uniformity for the overall image. The expression is as follows:
( )
3333)FirstFirstFirstFirst orderorderorderorder differencedifferencedifferencedifference
The first order difference describe the intensity of gray-scale changes, and the expression is as follows:
( ) (
)
where Dx,Dydenote the one-dimensional first difference in x-scale and y-x-scale
4444)HistogramHistogramHistogramHistogram entropyentropyentropyentropy
Histogram entropy comprehensively reflects the gray distribution and the orders. It’s expression represented as follows:
2.2.2 FrequencyFrequencyFrequencyFrequency featurefeaturefeaturefeature vectorvectorvectorvector
1111)High-frequencyHigh-frequencyHigh-frequencyHigh-frequency coefficientscoefficientscoefficientscoefficients ofofofof FourierFourierFourierFourier transformtransformtransformtransform
The equation of the selected transformation function is as follows:
2222)High-frequencyHigh-frequencyHigh-frequencyHigh-frequency coefficientscoefficientscoefficientscoefficients ofofofof waveletwaveletwaveletwavelet transformtransformtransformtransform
The Hal wavelet of Daubechies wavelet is selected in the paper to compute the high-frequency coefficients of wavelet transform and the expression is:
( )
The corresponding scaling function is:
( )
(
)
12.2.32.2.32.2.3 TTTTextureextureextureexture featurefeaturefeaturefeature vectorvectorvectorvector
Based on the subjective judgment of the human visual system, the geometrical textures of clouds in the remote sensing images are simple than those of the objects. Moreover, the edges of the cloudy areas tend to be fuzzy, smooth and changes slowly, and the edges of the objects are often sharp and have large gradient. As a result, the texture information and gradient information of images can be taken into consideration for the cloud detection. The texture information of images is obtained by gray level co-occurrence matrix, which extracts the texture features with conditional probability and reflects the amplitude information for the directions, intervals and changing magnitude in the images. The gradient information of images used to inspect the the parts where the gray value jumps, such as the edges and the grooves. With the integrated information of both gray-scale and gradient, the texture features can be extracted for the distinction of clouds from surfaces.
In the paper, the quadratic statistics of gray level-gradient co-occurrence matrix are chosen as the texture feature parameters of images, which contain gradient mean square error, hybrid entropy and homogeneity. Besides, the property of fractal dimension is applied to supplementary describe the irregularities of the remote sensing images. The first step is to get the gray level co-occurrence matrixH
( )
i,j from the image, and perform normalization processing to get the normalization matrixHˆ( )
i,j for the calculation of the quadratic statistics.1111)GradientGradientGradientGradient meanmeanmeanmean squaresquaresquaresquare errorerrorerrorerror
Gradient mean square error reflects the entire gray changes of images. Generally, the gray changes of textures in the areas covered by clouds are comparatively uniform and smooth.
(
)
( )
2where
T
avg = average gradient of imagewhere Lg = maximum gray scale of image
s
L = minimum gray scale of image i, j = image coordinates
( )
i jHˆ , = normalized gray level co-occurrence matrix
2222)HHHHybridybridybridybrid entropyentropyentropyentropy
Hybrid entropy indicates the complexities or heterogeneities of textures in the image and expresses the amount of information of images. Since clouds have relatively simple textures and uniform distribution, the hybrid entropies of most cloudy images are theoretically smaller than those of clear images.
( ) ( )
i j Hi j HT Lg
i s L
j ,
ˆ lg , ˆ 1
0 1
0 ∑ ∑ −
= −
= −
= (10)
3333)HHHHomogeneityomogeneityomogeneityomogeneity
Homogeneity refers to the concentration degree of the large values to the main diagonal of a square matrix, which embodies the homogeneity of variance and local changes of textures of images. The math expression is as follows:
( )
( )
∑ ∑
=− =− + −= 1
0 1
01 2
, ˆ
g L
i s L
j i j
j i H
T (11)
4444)FFFFractalractalractalractal dimensiondimensiondimensiondimension
Fractal dimension is used to measure the irregular degree or roughness of image textures. The larger the fractal dimension is, the rougher the surfaces of images are. Based on the fractional Brownian movement model, the fractal dimension values are calculated. The mathematical descriptions are as follows: SupposeX∈Rn, f
( )
X refers to a real random function ofX . If there exists a constant H (0< H <1), which makes the following expression F( )
t a distribution function irrelevant to X and∆X , such f( )
X can be referred to as the fractal Brown function.( )
t Pt f(
X X) ( )
f X tF ⎟⎟<
⎠ ⎞ ⎜
⎜ ⎝ ⎛
∆ −
∆ +
= X (12)
Where His called self-similar parameter. The expression of the fractal dimension of the image is as follows:
H n
D= +1− (13)
2.3 2.3 2.3
2.3 FeatureFeatureFeatureFeature classificationclassificationclassificationclassification ofof remoteofofremoteremoteremote sensingsensingsensingsensing imagesimagesimagesimages
As mentioned in the above discussions, the key problems of the cloud detection based on feature extraction lie in the selection of suitable features and the construction of classification model based on the feature space. The accuracy of cloud detection largely depends on precise of the discriminant model. After obtaining the feature space of the remote sensing image, a fast
and effective method, K-means unsupervised classification method, is adopted to perform training process and the class clustering centers are determined for each class. The procedures are described as follows:
1) Determine the initial feature centers Ck for each cluster.
Divide the samples of remote sensing images into k classes
(the size of k depends on the number of features selected),
and randomly choose samples as the initial cluster centers from each class,Ck=
{
Ck1,Ck2,...,Ckl}
, wherelrefers to the number of features of each cluster center;2) Compute the distances between each sample
x
i and thefeature centers Ck ,
(
)
2 1∑ −
= =
l
j ki ij
ki C x
d , the sample will be sorted into the class with minimumdkibased on the minimum
distance recognition criterion;
3) Recalculate the average values for all the samples of each cluster, and set them as the new cluster centersCkj,Ckj= N1∑j xij, xi∈Ck, where N is the sample
number belonging to the corresponding centers;
4) Repeat step 2 and step 3, and carry out iterative computation until every cluster center stops changing or changes little; 5) The final cluster centers are the results of image classification, namely the discriminant model of cloudy and clear images. In the specific cloud detection method, kis 2, which means all the images are classified into either cloudy class or clear image class. The result of image classification is the two cluster centers and their corresponding feature values.
3. 3. 3.
3. EXPERIMENTSEXPERIMENTSEXPERIMENTSEXPERIMENTS ANDANDANDAND RESULTSRESULTSRESULTSRESULTS
The cloud detection method of remote sensing images in the paper is composed of two phases: training stage for cloud samples and detection stage for test images. In the experiment, 1024 training samples obtained by the first civil high-definition survey satellite “ZY 3” with spatial resolution 64×64 pixels are used, and 30 “ZY 3” satellite images in 8-bit BMP format with spatial resolution 1024×1024 pixels are chosen as the test images. Each test image is divided into the sub-images with the size 32×32, thus every test image is made up with 1024 sub-images.
Both training sample and test images include two types of set: cloudy class and clear class. The cloudy class possesses images under different cloud conditions, such as thin clouds, cirrus cloud, cumulus, etc. The clear class covers a variety of images with diverse geographic characters, such as ocean, mountain, farmland, city and desert. The workflow of the experiment is explained in details as follows:
1) Training samples. Based on the features extracted from the training samples, employ K-means unsupervised classification algorithm to get the discriminant model for cloud detection; 2) Segmenting image. Divide the test image into sub-images and count the number of sub-image as m;
5) Cloudiness calculation. After finishing judging all the sub-images, count the number of sub-images with label 2 as n, and the cloudiness of the image is the ratio between n and m, that is cloud=m/n. Meanwhile, the detected image is available to output.
We evaluate the cloud detection results using people’s subjective comparisons and judgment. For the 30 test images contain 30720 sub-images, the final result showed that 2876 of them were misjudged, among which 1012 cloudy sub-images were classified as clear and 1864 clear sub-images were sorted into the cloudy set. The precision rate of the cloud detection method was about 90%.
There are several reasons accounting for the mistake judgment. One is that there exist mixing areas of features in the process of classification, which brings difficulties in the identification of clouds. Another reason might be that the size of sub-image is too small. With insufficient data information, the feature extracted is not significant enough to describe the properties of image, thus leading to the wrong judgment. However, if the size of sub-image is too large, some of them might only contain few clouds which can hardly reflected by the feature parameters and cause the misclassification.
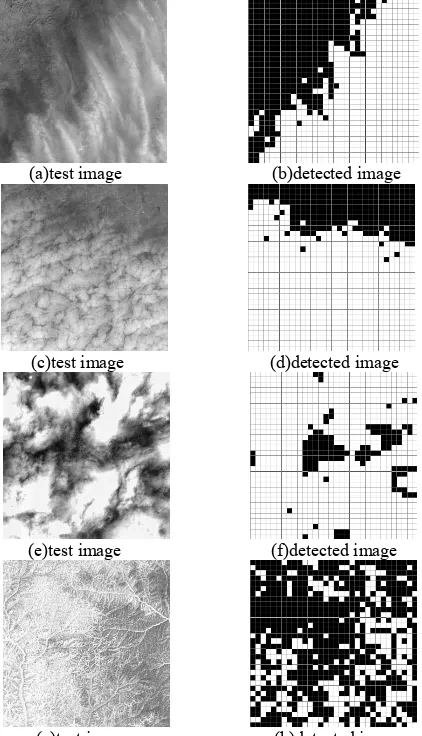
(a)test image (b)detected image
(c)test image (d)detected image
(e)test image (f)detected image
(g)test image (h)detected image Figure 3. Cloud detection results of some test images
4.
4.4.4. CONCLUSIONCONCLUSIONCONCLUSIONCONCLUSIONSSSS
The experiment results indicate that the proposed method is capable of reasonable discrimination between cloudy and
clear-sky areas effectively. Using the method the cloud can be fast detected. For many cloud free images which share the similar features with the cloudy images, such as great desert, images with fog and snow, large areas of smoke, etc. the probability of misjudgment for the cloud detection method based on feature exaction is relatively high. Currently, a possible effective way worth studying is to acquire a series of dynamic continuous images. Through the changes of two continuous images, the cloud can be detected effectively.
REFERENCES REFERENCESREFERENCESREFERENCES
Haruma Ishida, Takashi Y. Nakajima, 2009. Development of an unbiased cloud detection algorithm for a spaceborne multispectral imager.Journal of Geophysical Research, 114, pp. 1-16.
Calbo, Josep, Jeff Sabburg, 2008. Feature extraction from whole-sky ground-based images for cloud-type recognition. Journal of Atmospheric and Oceanic Technology, 25(1), pp. 3-14.
Zhou Quan, 2010. The Classification of Remote Sensing Cloud Images Based on Multiscale Features. University of Science and Technology of China.
Mark S.Nixon, Alberto S.Aguado, 2010. Feature extraction & image processing. Publishing House of Electronics Industry, pp. 121-132.
Xia Deshen, Jin Sheng, Wang Jian, 1999. Fractal Dimension and GGCM Meteorology Cloud Pictures Recognition. Journal of Nanjing University of Science and Technology, 23(4), pp. 289-292.
Cao Qiong, Zheng Hong, Li Xingshan, 2007. A Method for Detecting Cloud in Satellite Remote Sensing Image Based on Texture. Acta Aeronautica Et Astronautica Sinica, 28(3), pp. 661-666.
P. Tzoumanikas, A. Kazantzidis, A.F. Bais, et al, 2013. Cloud Detection and Classification with the Use of Whole-Sky Ground-Based Images.Springer Atmospheric Sciences, pp. 349-354.
Bao Jian, Li Xiaorun, 2008. Unsupervised classification of remote images using K-mean algorithm. Mechanical and Electrical Engineering Magazine, 25(03), pp. 79-80.
ACKNOWLEDGEMENTS ACKNOWLEDGEMENTSACKNOWLEDGEMENTSACKNOWLEDGEMENTS