3D BUILDING CHANGE DETECTION USING HIGH RESOLUTION STEREO IMAGES
AND A GIS DATABASE
G. R. Dini1, K. Jacobsen1, F. Rottensteiner1, M. Al Rajhi1,2, C. Heipke1
1 Institute of Photogrammetry and GeoInformation, Leibniz University Hannover,
dini@ipi.uni-hannover.de
2 Ministry of Municipal and Rural Affairs (MoMRA), Riyadh, KSA, mnalrajhi@yahoo.com
Commission VII, WG VII/5
KEY WORDS: Three-dimensional, Building, Change Detection, HR Satellite Images, Multitemporal, Urban Region
ABSTRACT
In this paper, a workflow is proposed to detect 3D building changes in urban and sub-urban areas using high-resolution stereoscopic satellite images of different epochs and a GIS database. Semi-global matching (SGM) is used to derive Digital Surface Models (DSM) and subsequently normalised digital surface models (nDSM, the difference of a DSM and a digital elevation model (DEM)), from the stereo pairs at each epoch. Large differences between the two DSMs are assumed to represent height changes. In order to reduce the effect of matching errors, heights in the nDSM of at least one epoch must also lie above a certain threshold in order to be considered as candidates for building change. A GIS database is used to check the existence of buildings at epoch 1. As a result of geometric discrepancies during data acquisition caused by different view directions and illumination conditions, the outlines of existing buildings do not necessarily match even in non-changed areas. Consequently, in the change map, there are streaking-shaped structures along the building outlines which do not correspond to actual changes. To eliminate these effects morphologic filtering is applied. The mask we use operates as a threshold on the shape and size of detected new blobs and effectively removes small objects such as cars, small trees and salt and pepper noise. The results of the proposed algorithm using IKONOS and GeoEye images demonstrate its performance for detecting 3D building changes and to extract building boundaries.
1. INTRODUCTION
1.1 Introduction
Monitoring and managing urban sprawl is of crucial importance in regional planning and is an important pre-requisite for sustainable development of urban environments. Buildings are the most important features in urban and suburban areas, thus automatic monitoring of building change, especially in damage assessment and disaster situations, has recently received attention in photogrammetry and remote sensing. Optical images provide a wide range of information for detection of building changes either directly (spatial, spectral, radiometric and temporal information) or indirectly through height information generated from stereo images using image matching. High resolution stereo images from space provide appropriate tools to detect changes in residential areas (Im and Jensen, 2005),(Zhang and Gruen, 2006).
A wide range of image processing and computer vision techniques including spectral indices (e.g., NDVI), geometric (e.g., shape and size) and height information (e.g. DSM, differential DSMs) have been developed for change detection based on remotely sensed images and geospatial databases (Im and Jensen, 2005), (Chaabouni-Chouayakh and Reinartz, 2011), (Bouziani et al., 2010), Champion (2007). There are two main strategies which are considered in change detection algorithms using remote sensing data: change enhancement emphasises image differences without any information about the type of
change (i.e., changed and un-changed pixels). The second approach is known as ‘‘from–to’’ strategy that monitors the land use changes during a period of time by determining the change from land use A to land use B (Im and Jensen, 2005).
In this paper, the first approach along with additional refinement is applied for stereo images of different epochs in order to detect building changes based on height changes. A GIS database containing building footprints can optionally be used to enhance the results. We do not aim at accurately delineating buildings outlines, instead the proposed approach is meant to act as a reliable alarm system for detecting changes, while delineation is assumed to be performed manually at a later stage. In the next section a short review of the literature is given. Section 2 describes the type of data used in our study. Section 3 contains a description of our approach. Experimental results are reported in section 4, section 5 concludes the paper. This paper continues and extends the work of Alobeid et al. (2011).
1.2 State-of-the-art
Change detection using high resolution stereoscopic images is an important task in updating urban areas. Champion (2007) matches high resolution aerial images for generating a DSM in order to update the building layer of a 2D cadastral database. He subdivided the detection of changes into two main steps, automatic verification of the database and detection of new buildings. In the first step, all buildings of the database are
tested to check whether they match with extracted features from images. To quantify the checking procedure, a similarity measurement is defined using robust geometric criteria. In the second step, a digital elevation model (DEM) is automatically generated from the DSM. From the difference of DSM and DEM an above-ground mask is derived. From this mask buildings are generated and compared with the existing database in order to detect new buildings. According to the author, the actual delineation of building outlines is not very accurate, mainly due to shadows.
Malpica and Alonso (2010) developed an approach for urban change detection integrating multi-spectral satellite imagery, LiDAR point clouds and a GIS database. SVM (support vector machine) was used to classify the image, resulting in a probability layer for buildings. By intersecting the classification result with the GIS building layer the authors found an increase in the built up area of a few percent.
Tian et al (2010) used stereoscopic satellite imagery, to detect height changes by computing the difference between the DSMs generated at different epochs. A rectangle was fitted to each extracted blob assumed to be a building. However, most blobs are highly curved, so the direction of the rectangle edges cannot be computed reliably.
2. DESCRIPTION OF INPUT DATA AND PRE-PROCESSINHG
Two pan-sharpened stereo pairs from IKONOS-2 (epoch 1) and GeoEye-1 (epoch 2), acquired on May-24, 2008 and Sept.-15, 2009 with ground sampling distances (GSD) of 1m and 50cm respectively, and depicting a suburb of Riyadh the capital of Saudi Arabia, are used in our study. The slant angle is 11° toward West for both and the base-to-height ratio is similar with 1:1.75 for IKONOS and 1:1.51 for GeoEye. Figure 1 shows parts of the images used for our study.
In addition we have at our disposal a GIS database showing all the buildings existing in the area in May 2008. Reference data for the building change detection study were generated
Figure 1. Sample of building changes (a) and (c): GeoEye 2009, (b) and (d): IKONOS 2008
manually by delineating and comparing the buildings visible at the two epochs.
Image orientation was provided by means of Rational Polynomial Coefficients. For the subsequent DSM generation we use semi-global matching (SGM, Hirschmüller, 2008). We thus need to transform the images into epipolar geometry (or at least something close to it, since for line images epipolar geometry in the strict sense does not exist). In our case it was sufficient to rotate the images around the viewing direction resulting in the x-axes of both image coordinate systems being parallel to the base, followed by a shift of 2.5 pixels in y-direction.
As mentioned image matching was carried out using SGM (Hirschmüller, 2008) resulting in DSMs for both epochs. The grid spacing was set to 1m for both DSM to have comparable conditions.
3. BUILDING CHANGE DETECTION USING DSM SUBTRACTION
This section deals with the detection of building changes by comparing the DSMs of the two epochs. We quickly found that simply taking the difference between both datasets did not yield useful results, mainly since georeferencing on the basis of rational polynomial coefficients (RPC) was not accurate enough (see Figure 2, a threshold of 2.5m for the absolute difference was used to show height changes). We thus applied a shift in all three coordinates to the second DSM with respect to the first. It was computed automatically using 3D least squares image matching similar to (Heipke et al., 2002) and amounted to 7.2m in X, 1.7m in Y and 1.3m in Z.
Figure 2. (a) IKONOS DSM, (b) GeoEye DSM, (c) and (d) binary change maps with D-DSMs larger than 2.5m: (c) before
(red), and (d) after (blue) shift elimination
After shift elimination, the differences in height were computed for each position in object space, see equation 1.
(i,j) t2 (i,j) t1 (i,j)
H H H
Δ = − (1)
where
H represent the height change
and the DSM values for position (i, j) in the first and the second epoch, respectively. We call the result a Difference-DSM or D-DSM and created a binary map by keeping only heights with absolute values larger than 2.5m.
Moreover, DEMs were generated for each epoch by filtering the DSMs according to (Niemeyer et al 2010), and normalised digital surface models (nDSM) were computed as the point-by-point difference between DSM and DEM. Only heights above a threshold (we also used 2.5m here) were considered as building blobs in the nDSM, in this way accumulation of matching errors in the D-DSM is reduced. For epoch 1 these blobs were additionally compared to the existing GIS building layer and where kept only, if they covered at least 75% of a GIS building object.
Ideally, positive and negative change values in the D-DSM indicate construction and demolition of buildings. The used threshold of 2.5m corresponds to the floor height of buildings. This threshold eliminates non-building changes caused by cars, low shrubs as well as other small changes not corresponding to buildings and reduces the information to potential building changes. However, height changes may also be caused by dumps, land excavation or different filling heights of petrol tanks. In addition vegetation and in particular trees normally pose problems when just subtracting height values, although in Saudi Arabia, this issue did not prevail.
It becomes clear when comparing Figures 2 (c) and (d), that although applying the shift results in a major improvement, even after proper georeferencing areas around the buildings show apparent height differences above the chosen threshold. This is mainly due to well-known image matching artefacts stemming from occluded areas and different shadows due to differences in view and illumination direction: the DSM is widened with respect to the actual building in shadow and occluded areas (e.g. Alobeid et al., 2010; Le Bris and Chehata, 2011, see also Figure 3).
Figure 3. (a) Sample DSM of image matching, (b) corresponding image with cross section line, (c) schematic cross
section from the side (red: DSM, black: original object)
Therefore, the 3D change map has to be refined appropriately. Shape and size information can play an important role, as does the normalised difference vegetation index which is known to be able to separate vegetated from sealed areas. Additional challenges due to occlusions of buildings by trees have to be dealt with separately.
Most of the false change alarms have an elongated shape; however some of them are small blobs like salt-and-pepper noise. In order to improve the results we use morphological filtering. The filter mask is chosen based on the usual minimum size and width of a building, we chose a size of 50m2 and a width of 4m.
Figure 4 shows a diagram of the method for 3D building change detection.
Figure 4. Diagram of 3D building change detection
4. EXPERIMENTAL RESULTS
4.1 Binary D-DSM
In this section we present first preliminary results of the described method using the test data from Saudi Arabia. The area has a size of 550 meters on each side (0.30 Sq. Km).
Figure 5. D-DSM of the whole area as a binary map after applying a height threshold of 2.5m
Input
As described in chapter 3 an initial D-DSM was computed from the input data. A threshold of 2.5m for the absolute difference was then used for each pixel individually, which as expected significantly reduced the amount of potential change. The resulting binary D-DSM is depicted in Figure 5.
A first visual check revealed that while most building changes are contained in the D-DSM, there are also a number of false alarms. Some refer to potential building activity and represent excavations, others refer to matching errors, probably due to poor contrast.
An example of errors in the D-DSM is shown in Figure 6. The green boxes in the superimposed to the GeoEye images are correct building changes, but the red boxes are false alarms: the upper one is a group of parked trucks and the lower one belongs to a dump caused by a building under construction.
Figure 6. Two samples of the D-DSM – left: IKONOS image (epoch 1), centre: GeoEye image (epoch 2), right: D-DSM. See
text for further explanation.
4.2 D-DSM refinement
For the reasons explained above, candidates for building change from the D-DSM had to pass two more tests as described in chapter 3: first, in at least one epoch a blob must be detectable in the nDSM; and second, in epoch 1 detected building blobs needed confirmation from the GIS building layer: a blob must cover at least 75% of the GIS building object, otherwise it was deleted.
Figure 7 shows the nDSM of the IKONOS and GeoEye images, Figure 8 depicts the results of comparing the nDSM of epoch 1 with the GIS building layer. The resulting binary change map after all height checks can be seen in Figure 9.
Figure 7. nDSM of epoch 1(left, red) and epoch 2 (right, green) as binary maps after applying a height threshold of 2.5m.
Figure 8. (a) IKONOS DSM of the whole scene, (b) IKONOS DSM superimposed with height blobs from nDSM in red, (c) GIS objects covered (yellow) and not covered (red) by
height blobs, the latter being candidates for demolished buildings, (d) blobs (red) not covered by GIS objects, being
candidates for new buildings.
Figure 9. D-DSM as binary map after refinement by height information
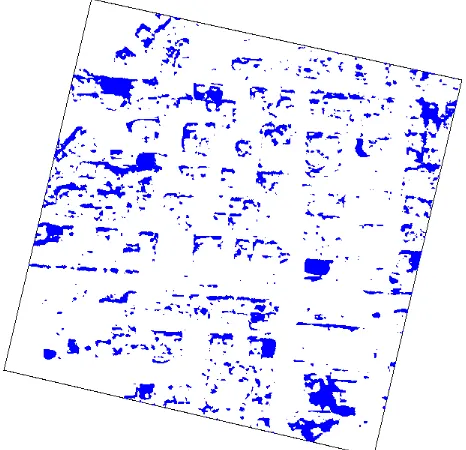
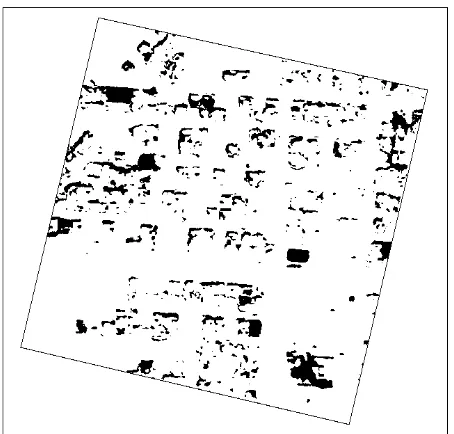
As shown in figure 7, there are still a number of change candidates with rather strange shape and size, making it necessary to further reduce false alarms. As described in chapter 3 we use morphological filtering for deleting small and thin areas. The size of the filter mask used was set to four meters, this value was found empirically. The result is depicted in Figure 10, the areas in red are those which are finally considered as building change. Note that box fitting or any other means to consider the fact that buildings are normally rectangular to further reduce potential false alarms has not been applied yet.
Figure 10. Change map after refinement by morphologic opening. The 16 areas in red constitute building change.
4.3 Quantitative Evaluation of Proposed Approach
In order to evaluate the performance of our approach, we captured all building changes between the two epochs manually. We found 12 newly constructed but no demolished building.
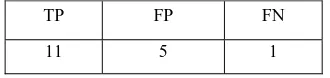
The results of a comparison of our results against the manual acquisition are contained in table 1. TP (True Positive) refers to the number of changed building (constructed or demolished) that are extracted correctly, FP (False Positive) indicates building changes incorrectly extracted by the approach; whereas FN (False Negative) is the number of missed changes.
TP FP FN
11 5 1
Table 1. Quantitative evaluation of proposed method
As can be seen in table 1 we were able to automatically extract 11 of the 12 new constructions (a TP was declared if 75% of the area of the new building was covered by pixels indicating change). While we still need to reduce the number of FP, we note that there is only one FN in the results. As we had pointed out, our system is supposed to act as an alarm system, thus FP can be quickly deleted by a human operator.
5. CONCLUSIONS AND FUTURE WORK
In this paper we have described an approach for automatically detecting building change from stereoscopic high resolution satellite images of two epochs and have shown preliminary results. Due to the ground resolution of only 1m some problems occur in properly detecting changes and delineation of change footprints is not possible. Besides refining the current workflow, e.g. by making use of the better spatial resolution of the GeoEye DSM and by improving the DEM extraction, in future work we plan to reduce the number of false alarms by introducing more shape information for the buildings and building changes such as requiring them to be rectangular. In addition we want to be able to handle more complex building ground plans and changes of building parts, e. g. new annexes
of an existing building. Another area of future work will comprise a more sophisticated consideration of the existing GIS data. Accurate georeferencing of the GIS data to the DSMs is one topic, a more detailed comparison between extracted blobs and the building ground plan is another one. The tasks will probably require a finer image resolution, as was also found by Rottensteiner (2008) and Champion (2009). Further, we also consider the possibility to use radiometric image information. Once the false alarm rate is further reduced, we aim to use the approach in an alarm system for building updates.
ACKNOWLEDGEMENTS
The authors thank the German Academic Exchange Service (DAAD) for financial support of this research. We are also grateful to Dr. Alobeid for valuable discussions and for providing software and technical support.
6. REFERENCES
Alobeid A., Jacobsen K., Heipke C., 2010: Comparison of Matching Algorithms for DSM Generation in Urban Areas from IKONOS Imagery, PE&RS 76 (9), 1041-1050.
Alobeid A., Jacobsen K., Heipke C., Al Rajhi M., 2011: Building Monitoring with Differential DSMs. In: IntArchPhRS 38 (4/W19).
Bouziani, M., Goïta, K., and He, D., 2010: Automatic change detection of buildings in urban environment from very high spatial resolution images using existing geodatabase and prior knowledge: ISPRS Journal of Ph. and RS 65, 143-153.
Chaabouni-Chouayakh, H., and Reinartz, P., 2011: Towards Automatic 3D Change Detection inside Urban Areas by Combining Height and Shape Information: PFG 4, 205-217.
Champion, N., 2007: 2D Building Change Detection from High Resolution Aerial Images and Correlation Digital Surface Models. In: IntArchPhRS 36 (3/W49A).
Champion N., 2009: Detection of unregistered buildings for updating 2D databases, EuroSDR Off. Publ. No. 56, 7-54.
Heipke, C., Koch, A., and Lohmann, P., 2002: Analysis of SRTM DTM - Methodology and Practical Results: Journal of the Swedish Soc. for Ph. and RS, 69-80.
Im, J., and Jensen, J.R., 2005: A change detection model based on neighborhood correlation image analysis and decision tree classification: Rem. Sens. of Environment 99, 326-340.
Le Bris, A., and Chehata, N., 2011: Change detection in a topographic building database using submetric satellite images. In: IntArchPhRS 38 (3/W22).
Malpica, J.A., and Alonso, M.C., 2010: Urban changes with satellite imagery and LiDAR data, In: IntArchPhRS 38 (8).
Niemeyer, J.; Rottensteiner, F.; Kühn, F.; Soergel, U., 2010: Extraktion geologisch relevanter Strukturen auf Rügen in Laserscanner-Daten. In: DGPF Jahrestagung, 298-307.
Rottensteiner F., 2008: Automated updating of building databases from digital surface models and multi-spectral images. In: IntArchPhRS 37 (B3A) 265-270.
Tian, J., Chaabouni-Chouayakh, H., Reinartz, P., Krauss, T., and d’Angelo, P., 2010: Automatic 3D Change Detection Based On Optical Satellite Stereo Imagery. In: IntArchPhRS 38 (7B). False Positives (FP)
Zhang, L., and Grün, A., 2006: Multi-image matching for DSM generation from IKONOS imagery. ISPRS JPhRS 60, 195–211.