AUTOMATIC 3D BUILDING MODEL GENERATION FROM LIDAR AND IMAGE
DATA USING SEQUENTIAL MINIMUM BOUNDING RECTANGLE
E. Kwak a*, M. Al-Durgham b, A. Habib a a
Dept. of Geomatics Engineering, University of Calgary, 2500 University Drive, Calgary, T2N 1N4, AB, Canada - (ekwak, ahabib)@ucalgary.ca
b
Dept. of Civil Engineering, University of Toronto, 35 St. George Street, Toronto, M5S 1A4, ON, Canada - [email protected]
Commission III, WG III/4
KEY WORDS: LiDAR, Photogrammetry, Building, Modeling, Automation
ABSTRACT:
Digital Building Model is an important component in many applications such as city modelling, natural disaster planning, and aftermath evaluation. The importance of accurate and up-to-date building models has been discussed by many researchers, and many different approaches for efficient building model generation have been proposed. They can be categorised according to the data source used, the data processing strategy, and the amount of human interaction. In terms of data source, due to the limitations of using single source data, integration of multi-senor data is desired since it preserves the advantages of the involved datasets. Aerial imagery and LiDAR data are among the commonly combined sources to obtain 3D building models with good vertical accuracy from laser scanning and good planimetric accuracy from aerial images. The most used data processing strategies are data-driven and model-driven ones. Theoretically one can model any shape of buildings using data-driven approaches but practically it leaves the question of how to impose constraints and set the rules during the generation process. Due to the complexity of the implementation of the data-driven approaches, based approaches draw the attention of the researchers. However, the major drawback of model-based approaches is that the establishment of representative models involves a manual process that requires human intervention. Therefore, the objective of this research work is to automatically generate building models using the Minimum Bounding Rectangle algorithm and sequentially adjusting them to combine the advantages of image and LiDAR datasets.
1. INTRODUCTION
The importance of up-to-date and accurate geospatial information has been emphasized with the increasing demand for Geographic Information Systems (GIS). Digital Building Model (DBM) is one of the important components among the geospatial information especially in urban areas. They are required as an input in many applications such as city modelling, natural disaster planning, and aftermath evaluation. With the development of sensor technology and the increase of user requirements, many different approaches for efficient building model generation have been proposed (Rottensteiner et al., 2005; Habib et al., 2010; Huang and Sester, 2011). They can be categorised according to the data source used, the data processing strategy, and the amount of human interaction (Vosselman and Maas, 2010).
In terms of data source, aerial imagery and LiDAR data are among the most commonly used sources to obtain 3D building models which can provide good vertical accuracy from laser scanning and good planimetric accuracy from aerial images. Due to the limitations of using single source data, integration has been already recommended since it preserves the advantages of the involved datasets. Using only aerial imagery provides reliable results based on a photogrammetric approach, but the low degree of automation during the matching process is a main limitation especially in case of occlusions. Partial or complete occlusions are common problems for images over urban areas. LiDAR systems provide direct 3D positional information eliminating the need for a matching process, but the derived boundaries do not represent the actual building boundaries due to the low sampling rate of airborne LiDAR data. This makes LiDAR
data not sufficient as a stand-alone source. The advantages of the integration of LiDAR and image datasets for the building reconstruction are already well summarised in many researches (Cheng et al., 2008; Demir et al., 2009; Awrangjeb et al., 2010; Habib et al., 2010).
The most used data processing strategies are the data-driven and the model-driven ones. Data-driven approaches which are also called bottom-up processes often rely on LiDAR data and do not make assumptions regarding the building shapes. Theoretically one can model any shape of buildings using data-driven approaches, but practically it leaves the question of how to impose constraints and set the rules during the generation process (Brenner, 2005). Due to the complexity of the implementation of the data-driven approaches, model-based approaches, i.e., top-down processes, draw the attention of the researchers. It predefines building models using model parameters, and the model parameters are updated using information derived from existing data. Complex building models can be constructed by combining small sets of model primitives depending on the desired level of detail. While it provides robust computation, establishing the representative models requires manual interaction (Tseng and Wang, 2003). Therefore, the objective of this research work is to automatically generate building boundaries using the minimum number of models while combining the advantages of image and LiDAR datasets. In this paper, the focus of reconstruction is on complex structures, which comprise a collection of rectangular primitives. The assumption is that most of the existing buildings, especially in urban areas, can be reconstructed using combination of rectangular shapes. To meet this objective, the proposed
methodology utilizes rectangular models which are derived from LiDAR data and are adjusted during the model-based image fitting process.
The structure of this paper is as follows: after a detailed explanation of the proposed methodology (Section 2), preliminary results are presented in Section 3. Section 4 presents concluding remarks.
2. METHODOLOGY
As mentioned in the previous section, LiDAR data is a good source to detect buildings and generate initial boundaries based on the data-driven approaches. However, the quality of the derived boundaries is affected by the point density of the LiDAR data. Therefore, post-processing to regularise the boundary is required. The most popular approaches for the regularization include imposing constraints such as regularity, parallelism of buildings’ sides, connectivity between lines, and integrating the boundaries with images (Brenner, 2005; Dorninger and Pfeifer, 2008). sets of rectangles which will be used as input for the model-based image fitting. Recursive Minimum Bounding Rectangle (MBR) is introduced to generate initial rectangular models (Section 2.2), and then the initial models will be adjusted during a sequential MBR adjustment (Section 2.3). 2.1 Initial LiDAR processing: building detection
First, to detect the possible buildings which can be used as initial building models, this research uses the segmentation methodology proposed by Lari et al. (2011). The segmentation process identifies individual regions with similar attributes and extracts useful features - in this case planar rooftops. This methodology starts with organising the LiDAR points using kd-tree structure to speed up the process. The proposed methodology considers varying point densities by calculating local point densities which determines the size of the neighbourhood. The points are classified as planar points or rough points using the neighbouring points during an iterative plane fitting, and these are grouped based on their proximity. The clustering procedure will be carried out on the grouped neighbouring points that have been classified as being part of planar surfaces. After the segmentation procedure, ground / non-ground classification is performed to filter out the ground points (Lari and Habib, 2012). Planar, non-ground group of points whose size and height are larger than predefined thresholds, are considered as possible buildings. Finally, the Modified Convex Hull algorithm is applied to generate boundaries (Sampath and Shan, 2007). As mentioned before, the initial traced boundaries from LiDAR data show irregular characteristics that need to be regularised. In this research, the regularisation will be carried out using rectangular models based on a model-based approach. The choice of the model parameters and decomposition of the complex buildings into rectangular models in an automatic way will be discussed in the following sections.
2.2 Selection of model: Rectangular model
Traditionally, building models are defined using six pose parameters: three of which define the model’s origin using buildings cannot be observed at the same time. On the other hand, the vertical accuracy of LiDAR data is higher than the horizontal one. Therefore in this research the heights of the buildings are determined from LiDAR; this simplifies the box model down to a rectangular model. The heights of the buildings and the vertical positions of the reference points are calculated based on the plane parameters from the segmentation. Also, the rotation angles which determine the slope and aspect of the building rooftops with respect to the object space are derived using the surface normal information from the LiDAR data. The final parameters in this research then become the three out of six pose parameters (i.e., the horizontal positions of the reference point and one rotation angle for the orientation of the building) and the two out of three shape parameters (the length and width of the building). The justification of this choice of the final model parameters is explained in detail in Habib et al. (2011). The chosen model parameters will be adjusted using edge pixel information from available images through a least-square adjustment.
2.3 Initial model parameter generation: Recursive MBR
This section discusses how to derive the initial model parameters automatically as input parameters for the model-based image fitting. Since rectangular models are chosen as the basic model, the MBR algorithm is applied to regularise the initial LiDAR-derived boundaries and decompose them into rectangles. MBR is the rectangle with minimum area among the rectangles of arbitrary orientation which contain all the vertices of a LiDAR boundary (Freeman and Shapira, 1975; Chaudhuri and Samal, 2007). MBR generation of a simple rectangular building is described in Habib et al. (2011). For complex buildings which are comprised of multiple rectangles, the MBR algorithm can be applied recursively. First, the MBR algorithm is applied to the initial LiDAR-derived boundary points and the 1st level MBR is generated. Then the initial boundary points, which do not overlap with the 1st level MBR, are found and then projected onto the sides of the 1st level MBR. Using the non-overlapping boundary points and their projected counterparts, the MBR algorithm is applied again to derive the 2nd level MBR(s). The same procedure is repeated until there is no LiDAR boundary point left. As a result of the recursive MBR, different MBR levels are derived and by alternating subtraction and addition of each level, the final shape can be generated. However, to improve the horizontal accuracy of the final product, these MBRs are used as initial models for the model-image fitting. Next section describes how these different levels of MBRs are adjusted sequentially during the image fitting process.
2.4 Sequential MBR adjustment using imagery
The MBRs derived from LiDAR give a good approximation for the adjustment. The main objective of the model-based
image fitting is to minimize the normal distance between the initial LiDAR-derived model and image edge information by refining the model parameters. Habib et al. (2011) already confirmed the feasibility of the image fitting process using simple rectangular buildings. For complex buildings, different levels of MBRs are derived from LiDAR data using the recursive MBR procedure described in Section 2.3. These MBRs will be adjusted sequentially to improve the boundaries. The 1st level MBR is adjusted using the edge pixels extracted from the images, and only edges from the actual building boundaries will be considered for the adjustment. After the 1st level MBR adjustment, the next level MBR is adjusted while incorporating the results from the previous level, and this process continues until all the MBR levels are adjusted. The results are presented in the Section 3.
3. EXPERIMENTAL RESULTS
To test the proposed methodology, two buildings have been selected. Figure 1 shows image and LiDAR data of the selected buildings. The building shapes differ in terms of complexity which means they are represented using different MBR levels. The first selected building, T-shape, is comprised of two MBR levels, and the second building includes more than two MBR levels. The buildings are located on the campus of British Colombia Institute of Technology (BCIT) in Canada. Multiple aerial images and airborne LiDAR data both captured from flying heights of 540 m and 1,150 m are available. The ground sampling distances for the images are 5 and 10 cm, and the LiDAR point densities are 1.5 and 4.0 pts /m2 depending on the flying height.
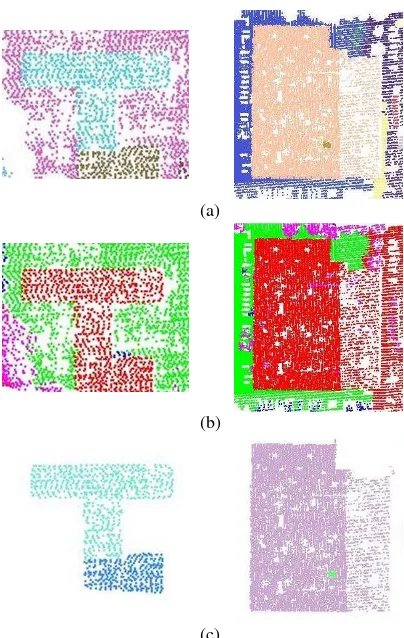
Figure 1. Aerial images (a), (c), and LiDAR data displayed according to the heights (b), (d), of selected buildings The proposed plane segmentation methodology successfully distinguishes the rooftops of the test buildings. The results are shown in Figure 2. Figure 2(a) shows the clustering results, and Figure 2(b) presents the ground / non-ground classification result. The red colour represents non-ground planar points, the green colour - ground planar points, the pink colour - non-ground rough points, and the blue colour - ground rough points. Groups of planar non-ground points whose height is greater than 4 m and size is larger than 10 m2 are hypothesized as buildings (Figure 2(c)). Lastly, Boundary tracing is performed on the building hypotheses. Figure 3
shows the traced boundaries of the test buildings projected onto the imagery.
(a)
(b)
(c)
Figure 2. Plane segmentation results (a), ground / non-ground classification (b), and building hypotheses generation (c)
Figure 3. Initial LiDAR boundaries of the buildings projected onto the imagery
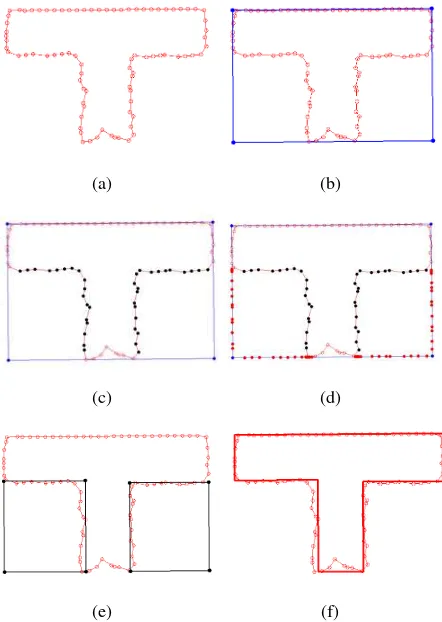
Figure 4 and Figure 5 demonstrate the step-by-step procedures of the recursive MBR algorithm for the two test buildings. For the first building, the 1st level MBR, i.e., the blue rectangle in Figure 4(b) is derived from the initial LiDAR boundary (Figure 4(a)). Figure 4(c) shows the non-overlapping initial LiDAR boundary points in black circles together with the 1st level MBR. These points are projected onto the 1st level MBR sides as shown in Figure 4(d) (red circles), and then using these points, the MBR algorithm is applied one more time. In this case, two 2nd level MBRs, i.e., the rectangles in black colour, are derived as seen in Figure 4(e). The final building shape can be obtained by subtracting the 2nd level MBRs from the 1st level MBR (Figure 4(f)).
(a) (b)
(c) (d)
(a) (b)
(c) (d)
(e) (f)
Figure 4. Recursive MBR procedure of the first building The second test building includes 3 MBR levels. Figure 5 illustrates the recursive MBR results of the second test building. The initial LiDAR boundary points and the 1st level MBR are presented in Figure 5(a) and Figure 5(b), respectively. Figure 5(c) displays the non-overlapping points in black circles with the 1st level MBR, and Figure 5(d) shows their projection onto the 1st level MBR in red circles. The 2nd level MBR, i.e., the black rectangle in Figure 5(e), is derived using the points in Figure 5(d). The same procedure is repeated to find the non-overlapping LiDAR points with the 2nd level MBR (i.e., pink circles in Figure 5(f)) and their projection onto the 2nd level MBR (i.e., red circles in Figure 5(g)). Figure 5(h) shows the 3rd level MBR in green color. The final shape can be derived by alternating subtraction and addition of different levels (1st level MBR – 2nd level MBR + 3rd level MBR) as seen in Figure 5(i).
(a) (b)
(c) (d)
(e) (f)
(g) (h)
(i)
Figure 5. Recursive MBR procedure of the second building Before following the Boolean operation of different MBR levels, the rectangular models determined from the LiDAR data undergo a refinement process using the sequential adjustment. Figure 6 shows the two MBR levels (red and yellow) derived from LiDAR data and the final adjusted MBRs after the model-image fitting projected onto the image. The adjustment was performed using two aerial images that cover the building. Please note that there is no limitation in terms of number of images used. The use of a single image produces satisfactory results; however, the use of more images provides various views of the building which decreases the chance of occlusion.
(a) (b)
Figure 6. Initial MBRs (a) and adjusted MBRs (b) of the first building projected onto the image
As seen in Figure 5, three MBR levels are derived from the second test building. The three levels of initial models and their adjustment results are depicted in Figure 7 where the different colors represent the different MBR levels.
(a) (b)
Figure 7. Initial MBRs (a) and adjusted MBRs (b) of the second building projected onto the image
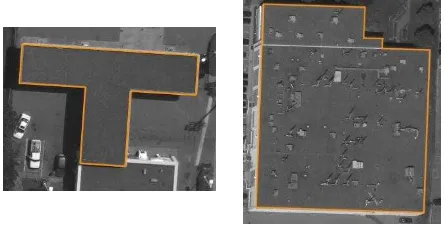
At last, the final shape of each building which is the result from the Boolean operation of the adjusted MBRs is projected onto the image (Figure 8).
Figure 8. Final shape of the building projected onto the image 4. CONCLUSIONS AND FUTURE WORK
This paper presented a robust approach to generate building models automatically from LiDAR and imagery by proposing the recursive MBR and the sequential MBR adjustment. Experimental results demonstrate how the recursive MBR algorithm decomposes buildings into rectangular models automatically and models are adjusted sequentially. The final model can be achieved by alternating the Boolean operation of subtraction and addition from each level of adjusted MBRs. This methodology can be applied to more complex buildings with more MBR levels. While the proposed approach provides high level of automation and accuracy, it can model only the types of buildings which decompose into rectangles. Future work includes increasing the applicability of the
proposed algorithm for other building shapes in order to obtain complete building models and maintain the high accuracy and automation level.
ACKNOWLEDGEMENTS
This work was supported by the Canadian GEOIDE NCE Network (IV-17) and the National Science and Engineering Council of Canada (Discovery Grant). The authors would like to thank McElhanney Consulting Services Ltd, BC, Canada for providing the real dataset and technical feedback. Last but not least, this work could not be accomplished without the help of Zahra Lari and Ivan Detchev.
REFERENCES
Awrangjeb, M., Ravanbakhsh, M., and Fraser, C.S., 2010. Automatic detection of residential buildings using LiDAR data and multispectral imagery. ISPRS Journal of Photogrammetry & Remote Sensing, 65, pp. 457-467.
Brenner, C., 2005. Building reconstruction from images and laser scanning. International Journal of Applied Earth Observation and Geoinformation, Vol 6, Issues 3-4, pp. 187-198.
Chaudhuri, D., and A. Samal, 2007. A simple method for fitting of bounding rectangle to closed regions. Pattern Recognition, 40, pp. 1981-1989.
Cheng, L., Gong, J., Chen, X., Han, P., 2008. Building boundary extraction from high resolution imagery and LIDAR data. International Archives of the Photogrammetry, Remote Sensing and Spatial Information Sciences, 37 (Part B3), pp. 693- 698.
Demir, N., Poli, D., Baltsavias, E., 2009. Extraction of buildings using images & LIDAR data and a combination of various methods. International Archives of the Photogrammetry, Remote Sensing and Spatial Information Sciences, 38 (Part 3/W4), pp.71-76.
Dorninger, P., N. Pfeifer, 2008. A comprehensive automated 3D approach for building extraction, reconstruction, and regularization from airborne laser scanning point clouds. Sensors, 8 (11), pp.7323–7343.
Freeman, H., and R.Shapira, 1975. Determining the minimum-area encasing rectangle for an arbitrary closed curve. Communications of ACM, Vol. 18, Num. 7.
Habib, A., R. Zhai, and C. Kim, 2010. Generation of complex polyhedral building models by integrating stereo-aerial imagery and LiDAR data. Photogrammetric Engineering and Remote Sensing, Vol. 76, 609-623.
Habib, A., E. Kwak, and M. Al-Durgham. 2011. Model-based automatic 3D building model generation by integrating LiDAR and Aerial images. Archives of Photogrammetry, Cartography and Remote Sensing, Vol. 22, pp. 187-200.
Huang, H., and M. Sester, 2011. A Hybrid Approach to Extraction and refinement of Building Footprints from Airborne LIDAR data. ISPRS Workshop on Geospatial Data Infrastructure: from data acquisition and updating to smarter services, Guilin, China, Vol. XXXVIII-4/W25, pp. 153-158.
Rottensteiner, F., Trinder, J., Clode, S., Kubik, K., 2005. Using the Dempster Shafer method for the fusion of LIDAR data and multi-spectral images for building detection. Information Fusion, 6 (4), pp.283-300.
Sampath, A. and J. Shan, 2007. Building boundary tracing and regularization from airborne LiDAR point clouds. Photogrammetric Engineering and Remote Sensing, 73(7): 805-812.
Tseng, Y.H, and S. Wang, 2003. Semiautomated Building Extraction Based on CSG Model-Image Fitting. Photogrammetric Engineering and Remote Sensing, 69(2), pp. 171-180.
Vosselman, G., and H.G. Maas., 2010. Airborne and Terrestrial Laser Scanning. Whittles Publishing, Scotland, UK.
Lari, Z., A. Habib, and E. Kwak, 2011. An adaptive approach for segmentation of 3D laser point cloud. ISPRS Workshop Laser Scanning 2011, Calgary, Canada, Aug 2011.
Lari, Z., and A. Habib, 2012. Segmentation-based classification of laser scanning data. ASPRS 2012 Annual Conference, Sacramento, California, March, 2012.