APPLICATION OF A NEW POLARIMETRIC FILTER TO RADARSAT-2 DATA OF
DECEPTION ISLAND (ANTARCTIC PENINSULA REGION) FOR SURFACE COVER
CHARACTERIZATION
S. Guillasoa∗, T. Schmidb, J. L´opez-Mart´ınezc, O. D’Hondta
a
Technische Universit¨at Berlin, Computer Vision and Remote Sensing, Berlin, Germany - [email protected] bCIEMAT, Madrid, Spain - [email protected]
c
Universidad Aut´onoma de Madrid, Spain - [email protected]
KEY WORDS:SAR, Antarctica, Surface characterization, Geomorphology, Soils, Polarimetry, Speckle Filtering, Image interpretation
ABSTRACT:
In this paper, we describe a new approach to analyse and quantify land surface covers on Deception Island, a volcanic island located in the Northern Antarctic Peninsula region by means of fully polarimetric RADARSAT-2 (C-Band) SAR image. Data have been filtered by a new polarimetric speckle filter (PolSAR-BLF) that is based on the bilateral filter. This filter is locally adapted to the spatial structure of the image by relying on pixel similarities in both the spatial and the radiometric domains. Thereafter different polarimetric features have been extracted and selected before being geocoded. These polarimetric parameters serve as a basis for a supervised classification using the Support Vector Machine (SVM) classifier. Finally, a map of landform is generated based on the result of the SVM results.
1. INTRODUCTION
Ice-free land surfaces of the Northern Antarctica Peninsula region are under the influence of freeze-thaw cycling effects on differ-ent pardiffer-ent materials. This is mainly due to the particular climatic conditions of the so called Maritime Antarctica and because this region is one the the fastest warming areas of the southern hemi-sphere. This contributes to a complex distribution of surface fea-tures and soils that are closely related to their abiotic and biotic characteristics.
The use of remotely sensed data is important to detect, study and quantify land surfaces. In order to overcome the problem of harsh weather conditions as well as the limited accessibility to the areas in this region, the use of synthetic aperture radar (SAR) data is particularly interesting (Schmid, 2012).
The objective of this work is to characterise land surface cover within selected ice-free areas on Deception Island, using fully polarimetric RADARSAT-2 data (C-band), presented in section 2. The strategy of this study is proposed in section 3. where the workflow is presented. Section 4. explains in details the new speckle filter, its results and presents the list of all polarimetric features that will be extracted from the so-called coherency ma-trix, and the classification scheme that has been applied, using fields data information acquired during several campaigns and a stack of previously selected features, a supervised classification algorithm (Support Vector Machine - SVM) is applied in order to identify the different type of land surface cover present in the scene. Section 5. presents our results and discussion concerning this work.
2. STUDY AREA
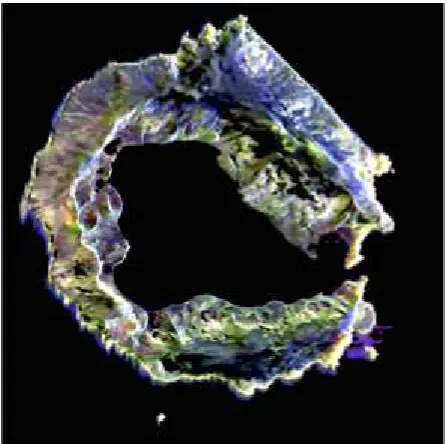
The study area is carried out over Deception Island (approx. 62◦ 58′S, 60◦39′W), a volcanic island of about 72 km2located in the South Shetlands archipelago, with an altitude rising to a max-imum of 576 m a.s.l. The location of the site is shown in the Fig-ure 1 (a) and (b). A RADARSAT-2 false-coloFig-ured SAR image is
∗Corresponding author
Figure 1: Location of the studied area within (a) Antarctica and (b) the northern Antarctic Peninsula region, including the loca-tion of the Deceploca-tion Island.
presented in Figure 2. The island is a flooded caldera, the volcano is active and its last eruption occurred in 1970. Deception Island has been object of many studies in particular regarding its ge-omorphology and geological evolution (L´opez-Mart´ınez, 2002). The variety of surfaces and the active processes in the island make its analysis by means of remote sensing technics of great interest in terms of identifying characteristics and detecting changes of surface land covers.
3. MATERIALS AND METHODS
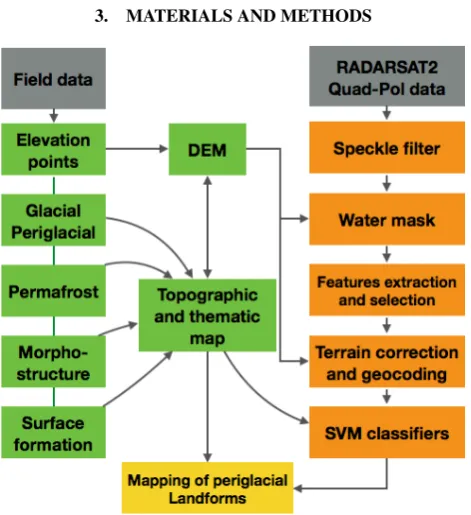
Figure 3: Full processing chain used in this study. The orange boxes are the ones mainly addressed and described in this paper.
The Figure 3 represents the processing chain applied in this study. Field data were obtained during several campaigns starting in the 1990s and a most recent one in 2012/2013 aimed at obtaining thematic maps (L´opez-Mart´ınez, 2000; Smellie, 2000) and sur-face cover data as ground truth information and for validating classification results. A digital elevation model (DEM) and the location of the different surface types have been compiled in a georeferenced database. The final aim of this work is to asso-ciate representative surface covers with satellite images in order to classify them and to analyse their change through the time. This could used combined with the knowledge about distribution of geomorphological features in ice-free surfaces of the region (e.g. L´opez-Mart´ınez, 2012), to detect surface characteristics in remote not visited areas.
Fully polarimetric RADARSAT-2 (C-band, Single Look Com-plex) images were acquired from the Canadian Space Agency 2014, over the entire area of Deception Island (see Figure 2). The SAR images have been processed as follows: from the single look complex (SLC) images, a scattering vector has been formed, and its elements combined to form a coherency matrix, which is the basis for many polarimetric treatments. We have applied a new polarimetric speckle filter in order to reduce the speckle effect in the data but also to improve the quality of the resulting coherency matrix. Indeed, this filter is edge preserving but allows a strong smoothing of the homogenous areas. The goal of this new filter is to improve the surface characterisation performed by means of a supervised classification procedure.
From the DEM, a water mask has been extracted and applied to the dataset. Thereafter different polarimetric features have been extracted. Selected features having a very high variability have been selected and generating a separable feature spaces when classifying the data. In a next step, data have been geocoded using the nearest neighbour interpolator in order to keep the orig-inal value of each feature. The supervised SVM classifier was ap-plied by using training areas that have been extracted from field campaign and measurements. Finally we obtain a map of surface units.
In the following section below, the main steps concerning the use of SAR image are detailled.
4. EXTRACTION OF POLARIMETRIC FEATURES
4.1 Polarimetric SAR data
Polarimetric SAR systems measure the relation between the trans-mitted and received electromagnetic wave in two orthogonal po-larisations in the form of a scattering matrix (Lee, 2009)
S=
whereH andV denote horizontal and vertical polarisation, re-spectively. The reciprocity assumption in the mono-static case leads tosH V =sV H. For the analysing purpose, it is convenient
to represent the scattering information in the form of a target vec-tor
whereP represents the Pauli basis.
On distributed targets, which are particularly relevant in the case of our land surface study, the information contained in the scatter-ing vectorkP is generally considered in a statistical framework.
It is admitted that the target vectorkfollows a complex circular
d-variate Normal distribution (Goodman, 1963) characterised by its uses of the second order momentΣ =E[kk†]that contains information about power and relative phase between polarimetric channels. When the scattering vector expressed in the Pauli basis, the matrixΣ=Tis usually called coherency matrix (although it is technically a covariance matrix).
TheΣhas to be estimated from the data over several independent samples. The covariance matrix is expressed as
ˆ
and is obtained by an operation called multi-looking that consists in taking the average of contiguous pixels. To improve the estima-tion accuracy, it is necessary to increase the number of samples, leading to a loss of spatial structure of the data.
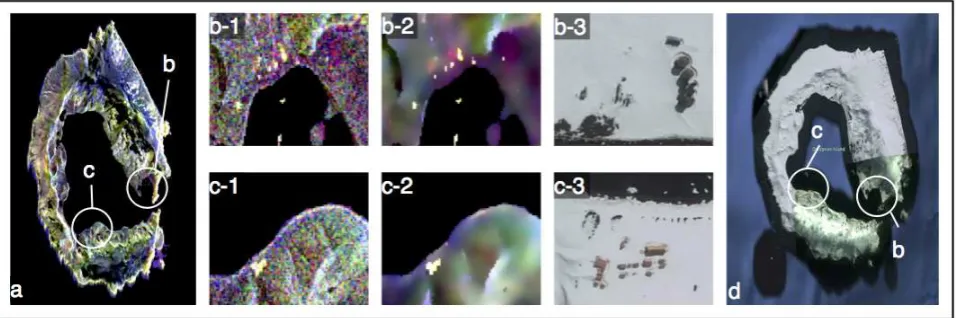
Figure 4: Visual comparison and interpretation of applying the PolSAR-BLF filter to RADARSAT-2 data of Deception Island. (a) Filtered SAR image with the location of 2 man-made structures (b) and (c). (b-1,2,3) correspond to Whalers’ Bay, where several old abandonned tanks become clearly visible after applying the filter, (b-3) is the corresponding Google Earth image. (c-1,2,3) correspond to the location of the Spanish Gabriel de Castilla Station. The station is visible in the unfiltered image and the PolSAR-BLF filter is preserving the edge of the station, as the optical image provided by Google Earth shown in (c-3). (d) is the Google Earth image of Deception Island with the location of the selected areas (b) and (c).
4.2 PolSAR-BLF: Polarimetric Bilateral filter
It has been shown that the PolSAR Bilateral Filter was a useful tool to estimate the covariance matrix from noisy data (D’Hondt, 2013). The filter allows a high amount of speckle filtering in ho-mogeneous areas and a good restoration of edges and determin-istic scatterers while preserving the polarimetric information.
The estimated covariance at locationx0is computed by
perform-ing a weighted sum of the sample covariance matrices at each positionxiinside a sliding windowW:
˜ Σ(x0) =
X
xi∈W
wiΣˆ(xi) (4)
The weightswiare expressed by defining a similarity measure
based on a matrix distanced(., .)
wi(xi) = f
s(||xi−x0||2)fr[d(R(xi),R(x0)]
P
xi∈Wfs(||xi−x0||2)fr[d(R(xi),R(x0)]
(5)
where the functionsfsandfrhave a Gaussian shape.
The distance between two matricesΣ1andΣ2is
d(R1,R2) =||log[R
−1 2
1 R2R
−1 2
1 ]||F (6)
wherelog()is the matrix logarithm and||.||F is the Frobenius
norm.
Figure 4 shows the results of applying our filter over the entire island and over two selected areas having man-made structures (Figure 4(b) and (c)). In both cases, we see that the man-made structures become more visible after applying the filter, but also the edge of the structures are preserved. The interpretation of the image has been done with the help of Google Earth (Figure 4(d)).
4.3 Polarimetric Feature Extraction
Polarimetric feature extraction has been extracted from the well known H/A/alpha decomposition of the (3×3) complex coherency matrixT. From this decomposition, based on an eigendecompo-sition of the coherency matrix, we have extracted the following parameters (using PolSARpro, Pottier, 2010):
• Anisotropy:A
• Anisotropy 12 (over higher eigenvalues):A12
• Scattering angle:α,α1,α2,α3
• Scattering angle:β,β!,β2,β3
• Entropy:H
• Entropy/Anisotropy combination: (1−H)(1−A), (1−
H)A,H(1−A),HA
• Scattering angle:δ,δ1,δ2,δ3
• Double bounce eigenvalue relative difference:DERD
• Scattering angle:γ,γ1,γ2,γ3
• Lueneburg Anisotropy:LA
• Pseudo-probability:p1,p2,p3
• Polarisation Asymmetry:P A
• Polarisation Fraction:P F
• Radar Vegetation Index:RV I
• Shannon Entropy:SE
• Single bounce eigenvalue relative difference:SERD.
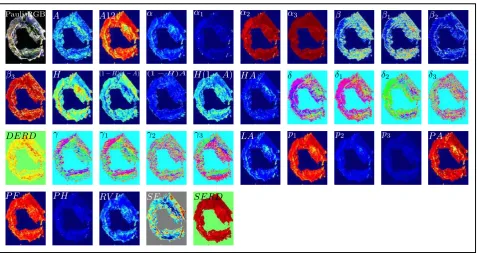
An illustration of all the extracted polarimetric features obtained from RADARSAT-2 data are shown in Figure 5.
SERD
A
Pauli RGB A A12 α α1 α2 α3 β β1 β2
β3 H p1´Hqp1´Aq p1´HqA Hp1´Aq HA δ δ1 δ2 δ3
DERD γ γ1 γ2 γ3 LA p1 p2 p3 P A
P F P H RV I SE
Figure 5: Polarimetric features of Deception Island extracted from RADARSAT-2 polarimetric data.
A
Pauli RGB
A
A
12
H
p1´Hqp1´Aq
H
p
1
´
A
q
δ
δ
1
δ
2δ
3γ
γ
1γ
2γ
3RV I
SE
Figure 6: Manual selection of the polarimetric features of Deception Island based on their variability.
4.4 Support Vector Machine Classification
Thereafter, polarimetric features have been geocoded thanks to the use of an external DEM. A supervised classification with 9 classes was performed using the Support Vector Machine classi-fication routine in PolSARpro based on the different feature ex-tracted above (Pottier, 2010). For each class, between 10 and 20 training areas were selected for the supervised classification. The training sites were then selected in PolSARpro to carry out the Support Vector Machine classification without the additional fil-tering procedure. From the classification results, a map indicating the different surface units was generated.
5. RESULTS AND DISCUSSION
These preliminary results show that SAR backscattering proper-ties using co-polarised or cross-polarised images (HH, HV, VV, VH) can identify different surface covers that are mainly related to physical properties. Different polarimetric parameters have
been extracted using the POLSARPRO software. Among other parameters, entropy (H), alpha (alpha), Anisotropy, the H(1-A) parameters, and the Shannon-Entropy was extracted. Alpha and entropy indicate the dominant presence of one scattering mecha-nism per resolution cell, however Anisotropy and Shannon-entropy shows strong differences according to their spatial location and are essential for implementing the SVM classifier to Deception Island (Figure 7). The classification result shows the identifica-tion of complex and relatively small scale geo-morphological fea-tures such as periglacial landforms that indicate the presence of permafrost for the different study areas.
ACKNOWLEDGEMENTS
This work was supported by the RADARSAT-2 Science and Op-erational Applications Research Program (SOAR) from the Cana-dian Space Agency and MacDonald, Dettwiler and Associates Ltd. Geospatial Services Inc., Canada, that provided satellite data through the SOAR–5169 project granted to the Universidad The International Archives of the Photogrammetry, Remote Sensing and Spatial Information Sciences, Volume XL-7/W3, 2015
D’Hondt
–
–
35
‘S
40
‘S
35
‘S
40
‘S
Figure 4.
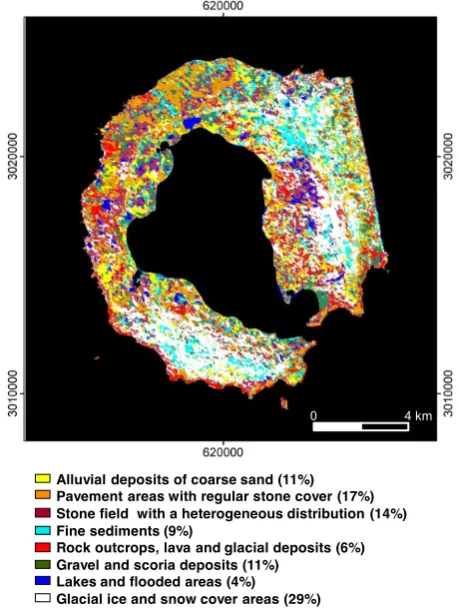
Surface cover classification of Deception
0 4 km
Alluvial deposits of coarse sand (11%) Pavement areas with regular stone cover (17%) Stone field with a heterogeneous distribution (14%) Fine sediments (9%)
Rock outcrops, lava and glacial deposits (6%) Gravel and scoria deposits (11%)
Lakes and flooded areas (4%) Glacial ice and snow cover areas (29%)
–
Figure 7: Surface cover classification of Deception Island (RADARSAT-2 acquisition 16 February 2014).
Aut´onoma de Madrid, Spain. This is a contribution to the projects CTM2011-26372 and CTM2014-57119-R of the Spain National R&D National Plan.
REFERENCES
D’Hondt, O., Guillaso, S. and Hellwich, O., 2013. Iterative bilat-eral filtering of polarimetric SAR data. Accepted for publication in IEEE J. Sel. Topics Appl. Earth Observ.
Goodman, N. R., 1963. Statistical analysis based on a certain multivariate complex gaussian distribution (an introduction). The Annals of Mathematical Statistics 34, pp. 152177.
Lee, J. and Pottier, E., 2009. Polarimetric Radar Imaging: From Basics to Applications. Optical Science and Engineering, Taylor & Francis.
L´opez-Mart´ınez, J., Serrano, E., Rey, J., Smellie, J. L. 2000. Ge-omorphological Map of Deception Island. BAS Geomap Series, Sheet 6-B, 1:25000. Cambridge, British Antarctic Survey.
L´opez-Mart´ınez, J., Smellie, J. L., Thomson, J.W., Thomson, M.R.A. Eds. 2002. Geology and Geomorphology of Deception Island. BAS Geomap Series, Sheets 6-A and 6-B Cambridge, British Antarctic Survey. 77 p.
L´opez-Mart´ınez, J. ,Serrano, E., Schmid, T., Mink, S., and Lin´es, C. 2012. Periglacial processes and landforms distribution in the South Shetland Islands (Northern Antarctic Peninsula region).
Geomorphology, Vol. 155-156, pp. 62-79.
Pottier, E. 2010. Recent advances in the development of the open source toolbox for polarimetric and interferometric polarimetric SAR data processing: the PolSARpro v4.1.5 software. In Inter-national Geoscience and Remote Sensing Symposium (IGARSS). Honolulu, Hawaii, USA, IEEE, pp. 2527–2530.
Schmid, T., L´opez-Mart´ınez, J., Koch, M., Maestro, A., Ser-rano, E. and Lin´es, C. 2012. Geomorphological mapping in the Antarctic Peninsula region applying single and multipolarization RADARSAT-2 data. Canadian Journal of Remote Sensing, 38(3), pp. 367-382.
Smellie, J. L. and L´opez-Mart´ınez, J. 2000. Geological Map of Deception Island. BAS Geomap Series, 6-A. E. 1:25 000. Cam-bridge, British Antarctic Survey.