APPLICATION OF LIDAR DATA AND 3D-CITY MODELS
IN VISUAL IMPACT SIMULATIONS OF TALL BUILDINGS
K. Czyńska
Cyber Urban Center, Faculty of Civil Engineering and Architecture West Pomeranian University of Technology Szczecin, Poland
Commission VI, WG VI/4
KEY WORDS: Tall Buildings, 3D Isovists, Visual Impact, LIDAR, 3D City Models, Computational Urban Analysis.
ABSTRACT:
The paper examines possibilities and limitations of application of Lidar data and digital 3D-city models to provide specialist urban analyses of tall buildings. The location and height of tall buildings is a subject of discussions, conflicts and controversies in many cities. The most important aspect is the visual influence of tall buildings to the city landscape, significant panoramas and other strategic city views. It is an actual issue in contemporary town planning worldwide. Over 50% of high-rise buildings on Earth were built in last 15 years. Tall buildings may be a threat especially for historically developed cities – typical for Europe. Contemporary Earth observation, more and more available Lidar scanning and 3D city models are a new tool for more accurate urban analysis of the tall buildings impact. The article presents appropriate simulation techniques, general assumption of geometric and computational algorithms – available methodologies and individual methods develop by author. The goal is to develop the geometric computation methods for GIS representation of the visual impact of a selected tall building to the structure of large city. In reference to this, the article introduce a Visual Impact Size method (VIS). Presented analyses were developed by application of airborne Lidar / DSM model and more processed models (like CityGML), containing the geometry and it’s semantics. Included simulations were carried out on an example of the agglomeration of Berlin.
1. TALL BUILDINGS DEVELOPMENT
In a perspective of last two decades the increase of high-rise development on Earth is clearly visible. Globally, over 50% such investments were built 21c. (in last 15 years). Tall buildings become more and more popular also in Europe (Musiał, 2012). However, they may be a significant threat, especially for historically developed cities with precious urban and architectural monuments and relics (Van der Hoeven and Nijhuis, 2011; McNeill, 2005). The planned location and height of new tall buildings have to include values of existing urban structures of a city and its cultural heritage. Therefore, analyses that enable precise simulation of the impact of investment planned on the cityscape are crucial. Mistakes in locating tall buildings frequently result from the inability to foresee the impact of a new building on a city. Due to their powerful visual impact, tall buildings can be seen from a distance of several kilometers and still significantly influence the city landscape. An example of such projects is the axis of Ludwigstrasse in Munich, where at the end of the street we can see a tall building above the historical Victory Gate (fig.1). In fact, the building is more than three kilometers away from the gate.
Apart from the height, the intensity of a visual impact of a tall building in the cityscape is determined by a number of factors, such as topography, density of urban structure as well as its composition and the height of existing buildings (Czyńska, 2014). The necessity to take those factors into consideration at the same time makes the process of analyzing tall buildings in the city structure a difficult geometrical staff that can hardly be solved without resorting to digital tools. The development of an analytical support is crucial considering rapid changes in contemporary European cities. The planning process requires
available and fast analysis and imaging of effects caused by planned investment which applies to an individual tall building or their clusters. It is important for defining zones of protected city landscape, as well as improved city development.
2. SPATIAL DATA IN CITYSCAPE ANALISES Processed spatial data are the basis for creating digital tools for analyzing various issues pertaining to the city landscape, including the impact of tall buildings. Recent advances in the areas of remote sensing have allowed for an efficient and effective way of directly capturing 3D structural information of large-scale areas (Poullis and You, 2009). With the use of software like ENVI LiDAR we can perform an automated feature identification and adjust data structure, precision and format to our needs. Point clouds from airborne LIDAR are an excellent source of information about a city. They contain data not only about buildings but also green, technical infrastructure and other development, which is important for examining the actual complexity of a city, in particular landscape aspects. All development elements around buildings comprise a city landscape and one of factors determining findings of visual analyses. An advantage of those technologies is objective measurement and precision with which the actual city structure is reflected.
and cheaper than ready-made vector 3D city models. According to the INSPIRE directive (Infrastructure for Spatial Information in the European Community) digital materials of geographic information became available all over the European Union. This creates better opportunities for analyzing urbanized space.
The article concentrates on a selected aspect of city landscape analysis, namely tall buildings. The method presented is defined as the Visual Impact Size (VIS) and enables imaging of visual impact of tall building and assessing the impact on a city landscape. Part of includes studies were implemented using a
computer program (C++) developed by author with P. Rubinowicz, which enables emulation VIS and related isovists simulations. The program interprets vector 3d models of cities in the CityGML format using semantics of the standard to optimize algorithms. In parallel, comparative research was carried out using ArcGIS with the 3D Analyst application by ESRI. In this particular case, research was based on using the Digital Surface Model (DSM), easily available while applying remote detection LIDAR technology. All simulations are made using the first and the second tool and apply to just one city, precisely Berlin.
Figure 1. Axial view of Ludwigstrasse in Munich with Victory Gate at its end and a tall building above it. The distance between the building and the gate is about 3.0 km (marked with arrow)
3. VISUAL IMPACT SIMULATIONS 3.1 Isovist 3d theory
An important reference point for analyzing visual aspects of tall building impact on a city landscape is the isovist theory. Assumptions of the method are known since Benedikt (1979). Visual perception of a city is a dynamic process. Relations between buildings change together with the point of observation. These relations are analyzed against lines of buildings and visual planes. A photography of a skyline shows a part of the impression only (limited to one point in space). For planning purposes, a relevant synthesis is necessary – determining the sum of visibility fields for all city. In the case of tall buildings, it involves marking all area in the city from which a given building can be seen. The visual field is described as isovist 3d. In literature such area are called viewsheds or isovists (Turner et. al. 2001), although there are certain semantic differences between them (Wietkamp, 2011).
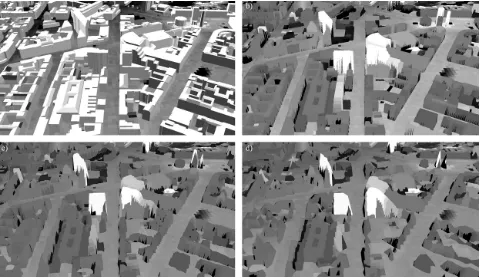
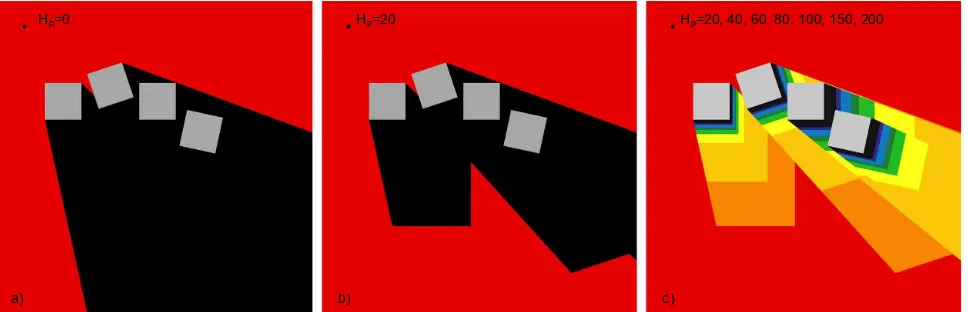
For the majority of potential applications of isovists, reducing the simulation to two dimensions only is sufficient. However, visual analyses of tall buildings requires introducing an isovist in its full form of a 3d space. 3d isovist defines the real field of view, which can be seen from a vantage point with a circular rotation of 360 degrees and from the ground to the sky. Adding the vertical dimension helps to better simulate the physical environment observed from the vantage point (Morello and Ratti, 2009). Differences between isovist 2d and 3d are presented in Figure 3. A test scene comprises four cuboid blocks. For isovists 2d the area marked red is the visual field (fig. 3a). In the case of isovist 3d a measurement point is elevated and located 20m above ground level. The visual area significantly increases in comparison with isovist 2d (fig. 3b). A number of simulations can be performed for various heights. An example of the method used in urban space is the analysis of a tall building in the center of Berlin (fig. 4). The simulation enables examining the impact of different heights of a given building on its visual impact area.
3.2 Visual Impact Size (VIS) method
The Visual Impact Size method is based on findings of analyses referred to above. The method was developed already in 2007 and then gradually advanced by author (Czyńska, 2009). The method aims at showing a total impact of a tall building in a city for all altitudes examined at the same time. This leads to
developing a single visual impact map (VIS) which facilitates interpretation of results and their application in planning. A novelty of the method is imaging of not only real visual impact range but also imaging of the impact power (expressed in intensity of color used). Objectives of the method are presented in fig. 3c. Several thresholds are assumed (in this case: 20, 40, 60, 80, 100, 150 and 200 m) for which the analysis was performed. They correspond to consecutive heights of a tall building. Colors used in the map reflect the strength of exposition of a planned building in space. It is the most visible from areas marked red and less form dark blue.
Examples of how the Visual Impact Size method is used in a real space of a city are included in fig. 5. Similarly to fig. 4, the analysis was performer for the center of Berlin. A hypothetical tall building was placed at the closure of Unten den Linden Street within the Museum Island. The analysis provides information where the planned building is well exposed and can be seen in whole (fields marked red), or only to a limited extent (fields marked blue). The VIS simulation reflects a real impact of the building in a city landscape (see also: Yamano, 2005). Conclusions of VIS analyses are important for further analysis of planned investment and in a wider context for creating a vision for developing tall buildings and defining landscape protection areas. The method was actually applied in planning while developing studies for Szczecin and Lublin, Poland, (2005-2011), described in greater detail in section 3.4.
Findings of the VIS analysis are usually presented in 2D GIS maps. They can be translated into axonometric and perspective projections. A geometrical basis for VIS-map emulation includes examining visibility of certain sets of points. However, due to the range of data to be processed, optimization of the algorithm is crucial for efficient processing of data providing digital description of urban space. In the case of Berlin, the city model covered more than 500 thousand buildings. The impact zone of a tall building may extend beyond administrative boundaries of a city, which in the case of Berlin could be examined while analyzing the impact of Berliner Fernsehturm. Partial results can be obtained using the ray-tracing method (Ozimek and Ozimek, 2008) and certain GIS programs. The simulation for the center of Berlin (fig. 5) was developed based on ESRI. Other VIS analyses referred to in the article are based on a computer program (C++) developed by the author with P. Rubinowicz.
Figure 3. Differences between isovist 2d and 3d: a) plane 2d isovist, where visible area is marked with red; b) 3d isovist for measurement point at 20m above ground; c) Visual Impact Size method (VIS) for several thresholds
Hp=0 Hp=20 Hp=20, 40, 60, 80, 100, 150, 200
Figure 4. Visual impact of building in center of Berlin for various heights: 40, 60, 80, 100, 150, and 200 m. The sequence shows growing visual field depending on building height.
Figure 5. Analyses of Visual Impact Size (VIS) for tall building in center of Belin (a chart explains the results of analyses). Analysis was calculated on a basis of DSM model
3.3 VIS & urban composition
Planning of new tall buildings necessitates analyzing the urban structure of a city at various scales: from global, including the impact of a building on the space of the entire city, partial external exposition within skylines, to internal views of public space (squares and streets) (Zwoliński, 2014). Analyses referred to in Section 3.2. showed a wide impact area of a tall building in a city. This section includes examples of simulations using the VIS method for smaller areas. The research focused on analyzing the tall building visual impact on the composition of urban development. Selection of areas was determined by possibilities of visual absorption imaging for particular types of urban tissue, from different city development periods influenced by various planning policies.
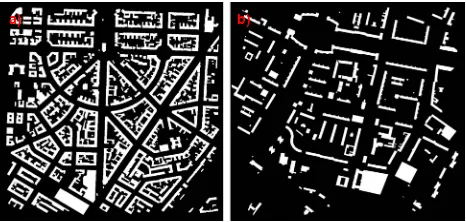
Comparative studies covered two sections of Belin of similar surface area (1.0 km2), various density of buildings and completely different composition. Area type A (fig. 6a) is a part of the Friedenau District. It composition is concise and quite intensive. The height of buildings is table and varies between 20 and 23 m. Development lines divide the space into clearly separated squares and streets (25m in width). Area type B
(fig. 6b) is a part of the Friedrichshein District. It is typical example of the post-WWII urban development. A major part of the district includes large pre-fabricated slab buildings. In the north, large scale pompous socialist architecture was developed in the 1950s. It is an area of a dense spatial structure and larger distances between buildings. Height differences are significant and range from 20m to 55m.
Figure 6. Test areas in Berlin that underwent Visual Impact Size analysis (VIS): a) parts of Friedenau District (about 1.0 km2);
b) part of Friedrichshein District (about 1.0 km2) b)
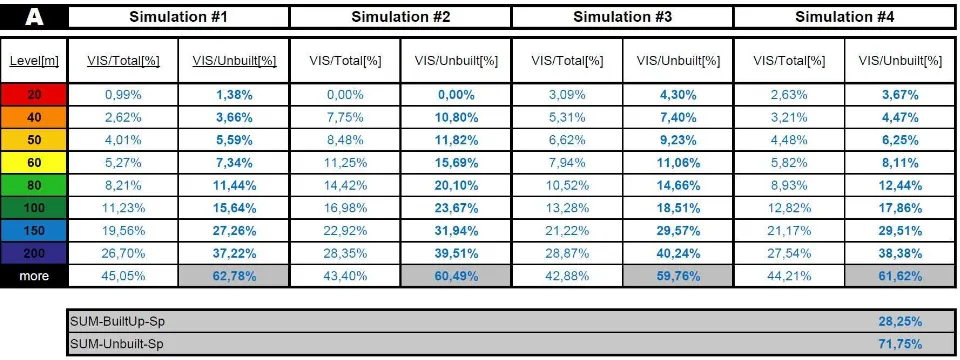
The sequence of VIS simulations for area A (fig. 7) showed a major relation between the urban composition and a tall building. In such a dense urban structure with developed land occupying 28% of the area and 72% of land occupied by streets, squares and backyards, visibility of a tall building depends very much on selecting an appropriate location. If a tall building is situated at the cross roads of long a straight streets axes its visual impact is significant. In simulations #2 and #3, the impact (from 20 m to 50 m – from red to yellow) is much larger than in other instances. This is confirmed in table 1. For altitudes of 40 and 50m the size of VIS areas in undeveloped locations is several percentage points higher than in other simulations (Cf. simulations #1 and #4). Good visibility of a tall building at lower altitudes guarantees a better overall visibility of a building. According to simulations #2 and #3, for the height of 200m a building could be seen from about 40% of all undeveloped areas, which is 3 percentage points higher than in the case of other simulations (tab. 1).
In the case of area B, it is worth noticing a different proportion between developed and undeveloped areas (12.5% to 87.5%). With such a loose spatial structure we can see stronger visual impact than in area A regardless the location of a tall building (fig. 8, simulations #1-4). The overall visibility of a building at the altitude of 20m is as much as 67% for all undeveloped areas. In other words, the building will not be seen from just
33% of areas (tab. 2). This is directly linked with the urban composition, which in this part of the city is quite random. Squares and streets are not clearly distinct from the overall composition. It seems that the arrangement of buildings in space is in line with the principle of their even distribution in an orthogonal system without highlighting any axis. An exception is the northern part of that area. When we set the test point in the middle of the square (fig. 8, simulation #1), the visual impact is significantly stronger for altitudes of 20m to 50m. Similarly in area A, wide and straight axes of streets contribute to a better exposure of a building. Comparing with simulation #2, the impact area for the altitude of 20m ends within the square with radial streets. This is also reflected in the size of the visual impact area (tab. 2).
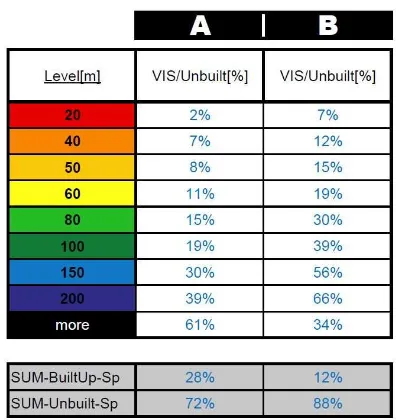
The comparative analysis for the two areas of Berlin confirmed an important relationship between the size of the impact area and the density of urban structure. A list of major average values for a series of simulations is included in table 3. The ratio of developed and undeveloped land in areas A and B differs significantly. It translates into reverse proportions of exposition areas for a tall building. In area A, a building of 200 m in height can be seen from 39% of undeveloped land, whereas in area B 66%. Consequently, areas from which the building cannot be seen are 61% and 34% respectively for area A and B.
Figure 7. VIS simulations for area “A” (Berlin Friedenau)
Figure 7. VIS simulations for area “A” (Berlin Friedenau)
Table 2. VIS simulations for area B
Table 3. Comparison of VIS simulations for area A and B
3.4 Application of VIS in planning
Professional experience and solving specific planning problems had a major impact on developing the Visual Impact Size method. The VIS method has been used by author of the article for several years. The first applications in urban planning date
back to 2007-2008. At that time, author together with a larger team of researchers (Czyńska et. al., 2007) developed guidelines for 10 potential locations of tall buildings in Szczecin, Poland. Locations of those buildings were predetermined and corresponded with specific investment plots in the city. The studies aimed at examining the possibility of erecting tall buildings on those plots, determining their maximum height and showing their impact on the city skyline.
The analyses were based on a 3d model (also developed by author with P. Rubinowicz) for the center of Szczecin comprising about 17 thousand LoD1 and LoD2 buildings, land topography, arrangement of streets, bridges and shipyard and port infrastructure. A solution resulting from the analysis was adding blocks of tall buildings planned to the model and developing their visualizations from different locations in the city. It turned out, however, that the method was inefficient. Defining the range of tall building impact intuitively was imprecise. Each of locations examined showed their individual features and impact on the city skyline, and in the case of heights above 100m the visual impact area covered dozens of locations all over the city, which for practical reasons were hard to determine.
development of tall buildings would be detrimental to the city landscape (Czyńska, 2014; Czyńska et.al., 2007). The study was based on the VIS method. The emulation of computer simulations was then time consuming. Calculations and processing of findings for each location took several days/hours. Later author together with P. Rubinowicz focused on expediting the process, optimizing algorithms and possibility of processing different data reflecting the 3d structure of the city.
At the moment, the VIS emulation for smaller areas of a city (up to 1 km2) is possible in real time (calculations take several seconds). It is also possible to study large agglomerations (400-500 km2). A major direction for developing the method is to reverse objectives and focus on assessing the landscape absorption capacity in terms of tall buildings rather than a mere analysis of specific locations for planned tall buildings. In general, this is the objective of the 2TaLL project (Application of 3d Virtual City Models in Urban Analyses of Tall Buildings). Results of the simulation can be confronted with other methods, such as VPS (Visual Protection Surface). Finally, the research focuses on the urban tissue with its complexity while taking into consideration its fractal dimension (Rubinowicz, 2014).
4. CONCLUSIONS
The development of remote detection in natural and urbanized environment provided new possibilities for applying results in spatial and urban planning. The continuous development of technology enable better description of a city structure as well as more precise ortophotomaps and 3d models of higher accuracy and more complete semantics. Accessibility of spatial data is growing and the cost of processing is reduced significantly. However, even the best digital picture of a city can only be a starting point for further analytical applications. The use of new remote landscape detection technologies has improved in areas where effects of the simulations are important and its results are not debatable. We may refer to such examples as acoustic analyses, solar analyses (assessing possibility of establishing photovoltaic panels on top of roofs), and developing radar sensor networks (Łubczonek, 2009).
The issue of locating tall buildings in a city and assessing consequences in terms of their impact, discussed in the article, can be a part of a wider discourse. It is a very relevant issue as indicated by objective data, namely the number of tall buildings planned. In the case of historical cities, the assessment of tall building impact and protection of historical landscape features are crucial while issuing planning permits. This applies to a number of European cities, where in recent years we have observed a significant increase in interest to build tall buildings (e.g. in Helsinki – Korkea Rakentaminen, 2011). It is a subject of discussions, arguments and controversies which frequently reflect a dilemma between developing a new image of a city and restrictive protection of its historical landscape.
The Visual Impact Size method discussed in the article enables analyzing the tall building visual impact to the extent possible. Computer simulations produce maps showing impact of individual tall buildings and locations of their exposition in a city. The application of the method is possible using full 3d models of a city as well as using simpler, cheaper and available DMS models. The quality of findings depends on the scale of analysis. In many instances, in particular while examining a
wider tall building impact area, the use of surface models produces good results. An important direction for developing the method is to speed up simulation to provide for more interactive assessment of the phenomenon. The research aims at creating a possibility for analyzing urban compositions as regards the capacity of a landscape to absorb tall buildings and designating optimized locations for such facilities.
ACKNOWLEDGEMENTS
The article was prepared within the research project 2TaLL: Application of 3D Virtual City Models in Urban Analyses of Tall Buildings, funded by a Norwegian Financing Mechanism. Digital model of Berlin provided by Berlin Partner GmbH. Software solutions in cooperation with P. Rubinowicz. I gratefully acknowledge all the support. All illustrations prepared by author.
REFERENCES
Benedikt, M. L., 1979. To take hold of space: isovist fields. In
Environment and Planning B: Planning and Design, Vol. 6, pp. 47-65.
Czyńska, K., 2010. Tall buildings and harmonious landscape. In: Space and Form no 13, pp. 267-280.
Czyńska, K., 2014. Geometrical Aspects of City Skyline – Tall Building Analysis. In: Schröcker, H.-P. and Husty, M. (eds.),
Proceedings of the 16th International Conference on Geometry and Graphics, Innsbruck: Faculty of Engineering Science, pp. 519–530.
Czyńska, K., Marzęcki, W., Rubinowicz, P., 2007. Analyses of visual impact and definition of spatial guidelines for high buildings in Szczecin, Urban Study commissioned by Department of Spatial Planning, City of Szczecin, Poland.
Korkea Rakentaminen Helsingissä, Kaupunkimittausosasto,
Helsinki 2011, ISSN 1235 4104
Łubczonek, J., Stateczny, A., 2009. Aspects of spatial planning of radar sensor network for inland waterways surveillance. In:
Proceedings of the 6th European Radar Conference, Rome,
pp. 501-504.
McNeill D., 2005. Skyscraper geography. In: Progress in
Human Geography 29, 1, p. 41-55. doi:
10.1191/0309132505ph527oa
Morello, E., Ratti, C., 2009. A digital image of the city: 3D isovists in Lynch’s urban analysis. In: Environment and Planning B: Planning and Design 36(5), pp. 837-853.
Musiał R., 2012. Supertall buildings – present and future components of the landscapes of big cities in Europe. In:
Ozimek, P., Ozimek, A., 2008. Visibility method for landscape analyses in historical city center environment. In: Buhmann, Pietsch, Heins (Eds.) Digital Design in Landscape Architecture, Wichmann Verlag Heidelberg, pp. 380-391.
Poullis, C., You, S., 2009. Automatic reconstruction of cities from remote sensor data. In: Computer Vision and Pattern Recognition, CVPR 2009. IEEE Conference, pp. 2775-2782.
Rubinowicz, P., 2013. Cyber Urban Design. In: Archivolta
3(59), Cracow, pp. 58-65.
Rubinowicz, P., 2014. Exploring the Complexity. Digital Turn Towards Geometry in Contemporary Architecture and Urban Planning. In: Schröcker, H.-P. and Husty, M. (eds.),
Proceedings of the 16th International Conference on Geometry and Graphics, Innsbruck: Faculty of Engineering Science, pp. 393-404.
Turner, A., Doxa, M., O’Sullivan, D., Pen, A., 2001. From isovist to visibility graphs: a methodology for the analysis of architectural space. In: Environment and Planning B: Planning and Design. Vol. 28, pp. 103-122.
Van der Hoeven, F., Nijhuis, S., 2011. Hi Rise, I can see you! Planning and visibility assessment of high building development in Rotterdam. In: Research in Urbanism Series. Vol. 2, pp. 277-301.
Weitkamp. G., 2011. Mapping landscape openness with isovist. In: Research in Urbanism Series. Vol. 2, pp. 205-223.
Yamano, T., Yoshikawa, S., 2005. Cityscape analysis and simulation with three-dimensional urban model. In:
Proceedings of the 9th International Conference on Computers
in Urban Planning and Urban Management (CUPUM2005).
London: University College of London, pp. 1-14.
Zwoliński, A., 2014. A day in a shadow of high-rise – 3D parameterization and use of public space around PŻM / Hotel Radisson building complex in center of Szczecin. In: