USING THE LANDSAT DATA ARCHIVE TO ASSESS LONG-TERM REGIONAL
FOREST DYNAMICS ASSESSMENT IN EASTERN EUROPE, 1985-2012
S. Turubanova a*, P. Potapov a, A. Krylov a, A. Tyukavina a, J.L. McCarty b, V.C. Radeloff c, M.C. Hansen a
a Department of Geographical Sciences, University of Maryland, College Park, MD 20742, United States - [email protected] b Michigan Tech Research Institute, Ann Arbor, MI 48105, USA
c SILVIS Lab, Department of Forest and Wildlife Ecology, University of Wisconsin-Madison, Madison, WI 53706, USA
KEY WORDS: Landsat archive, forest cover, forest cover dynamics, Eastern Europe, logging, wildfire
ABSTRACT:
Dramatic political and economic changes in Eastern European countries following the dissolution of the “Eastern Bloc” and the collapse of the Soviet Union greatly affected land-cover and land-use trends. In particular, changes in forest cover dynamics may be attributed to the collapse of the planned economy, agricultural land abandonment, economy liberalization, and market conditions. However, changes in forest cover are hard to quantify given inconsistent forest statistics collected by different countries over the last 30 years. The objective of our research was to consistently quantify forest cover change across Eastern Europe from 1985 until 2012 using the complete Landsat data archive. We developed an algorithm for processing imagery from different Landsat platforms and sensors (TM and ETM+), aggregating these images into a common set of multi-temporal metrics, and mapping annual gross forest cover loss and decadal gross forest cover gain. Our results show that forest cover area increased from 1985 to 2012 by 4.7% across the region. Average annual gross forest cover loss was 0.41% of total forest cover area, with a statistically significant increase from 1985 to 2012. Most forest disturbance recovered fast, with only 12% of the areas of forest loss prior to 1995 not being recovered by 2012. Timber harvesting was the main cause of forest loss. Logging area declined after the collapse of socialism in the late 1980s, increased in the early 2000s, and decreased in most countries after 2007 due to the global economic crisis. By 2012, Central and Baltic Eastern European countries showed higher logging rates compared to their Western neighbours. Comparing our results with official forest cover and change estimates showed agreement in total forest area for year 2010, but with substantial disagreement between Landsat-based and official net forest cover area change. Landsat-based logging areas exhibit strong relationship with reported roundwood production at national scale. Our results allow national and sub-national level analysis of forest cover extent, change, and logging intensity and are available on-line as a baseline for further analyses of forest dynamics and its drivers.
1. INTRODUCTION
Dramatic socio-economic changes after the breakdown of Soviet state-run, “planned” economy in Eastern Europe significantly altered forest management in the region. The legal framework of forest management changed due to land privatization, reduction of state control, and changes in forest use regulations (Lazdinis et al., 2004; Strimbu et al., 2005; Torniainen et al., 2006; Vanwambeke et al., 2012). In terms of economics, price liberalization, modification of forest consumer network and processing infrastructure had significant effects coupled with the expansion of the European Union expansion, changes in markets, and the recent global economic crisis (Kuemmerle et al., 2009; Wendland et al., 2011; Olofsson et al., 2011). Among countries, most of these changes were multidirectional and not time-synchronous (Kuemmerle et al., 2006). To relate effects of socio-economic changes to forest dynamics consistent time-series of forest cover change are required for the entire region. Such information, however, is not available from national statistical data. Many Eastern European countries changed their national or administrative boundaries after the late 1980s, and their government agencies responsible for forest monitoring were reformed, making analysis of archival data complicated. Moreover, forest data collected at national level is often inconsistent among countries due to differences in forest inventory methods (which also changed dramatically during the few last decades) and varying definitions of what constitutes a forest (Seebach et al., 2011;
Tomppo et al., 2010). Time series of spatially consistent satellite observations, such as the one collected by the Landsat program since mid-1980s, may serve as alternative data source to measure regional-to-global forest dynamics (Wulder et al., 2008). Satellite-based analysis allows wall-to-wall consistent mapping of land-cover change beyond national and administrative boundaries, producing multi-temporal data well suited to study socio-economic effects on land-cover, carbon pools, and ecosystem dynamics. Landsat archive data, however, were collected by different sensors under different atmospheric conditions and require special methods and tools for image calibration and compositing (Hansen & Loveland 2012).
paper, we describe data processing methodology, results, and perform inter-comparisons between satellite-based forest assessments and available national forest inventory and forest management data.
2. DATA AND METHODS
The analysis was performed within Eastern European countries that formed the “Eastern Bloc” until the end of the 1980s, including the European part of the former Soviet Union, former Yugoslavia, former Czechoslovakia, Poland, Bulgaria, Romania, and Hungary.
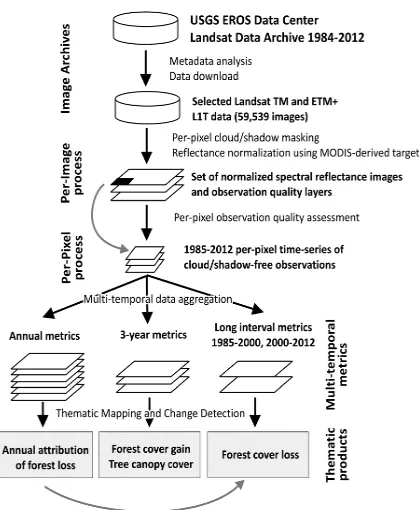
We downloaded and processed all Landsat TM and ETM+ data from the U.S. Geological Survey (USGS) Earth Resources Observation and Science (EROS) Data Center data archive. Only images processed to L1T standard (terrain corrected) within growing season (defined using MODIS NDVI time series, see Potapov et al., 2011) were used for analysis. In total, we analyzed 59,539 Landsat images from 1984 to 2012. We processed images using our standard workflow (Fig. 1) converting sensor data to top-of-atmosphere spectral reflectance, applying per-pixel cloud/shadow masking, and performing reflectance normalization using MODIS-based surface reflectance composite as normalization target (Potapov et al., 2014).
Figure 1. Algorithm for Landsat archive data processing and characterization. See Potapov et al., 2014 for details
To facilitate forest cover and change mapping, Landsat time-series data were transformed into a regionally consistent set of multi-temporal metrics (Hansen et al., 2003). We employed three sets of metrics: long-interval metrics (1985-2000 and 2000-2012) for forest cover change mapping; three-year interval metrics (1984-86, 1999-2001, and 2010-12) for decadal forest canopy cover mapping; and annual metrics for change detection date allocation (Fig. 1). For annual metrics, the dataset included median, minimum and maximum reflectance values of cloud-free growing season observations. For
multi-year metrics, all growing season cloud-free observations within the selected date range were used and summarized as: (i) reflectance values representing maximum, minimum and selected percentile values (10, 25, 50, 75 and 90% percentiles) using per band and band ratio rank orders and values associated with rank orders of NDVI and brightness temperature values; (ii) mean reflectance values for observations for selected percentiles (for the max-10%, 10-25%, 25-50%, 50-75%, 75-90%, 90%-max, min-max, 10-75-90%, and 25-75% intervals); and (iii) the slope of the linear regression of band reflectance value versus image date. These metrics have been shown to perform well for forest cover dynamics mapping in boreal and temperate environments (Potapov et al., 2011; 2014).
Regional forest cover extent was mapped for three dates: 1985, 2000, and 2012. We used a regression tree model (Breiman et al., 1984) to map tree canopy cover. The model was derived using 1999-2001 three-year multi-temporal metrics set as the independent variable and global tree canopy cover dataset (Hansen et al., 2013) as the dependent variable. We implemented the same model to derive tree canopy cover for circa year 1985 and 2012, thus obtaining consistent estimates through time. To map forest cover as land-cover category, a single threshold of tree canopy cover product (49%, consistent with Potapov et al., 2011) was used to derive regional forest cover time-series.
Forest cover loss was defined from a land-cover perspective, as areas where tree cover was removed or reduced below the 49% threshold. Areas of forest cover loss were mapped using supervised classification algorithm (classification trees) applied to long-interval metrics. Separate models were used for 1985-2000, with training digitized by experts, and for 2000-2012, the results of global forest cover loss product (Hansen et al., 2013) were used as training data. Forest cover loss was attributed to a given year of change event using trend analysis of annual NDVI and tree canopy cover derived from annual multi-spectral metrics. In addition, we attributed forest cover loss according to the disturbance agent: fire, windfall, or other. The “other” thematic class includes primarily logging and clearing, and scattered natural disturbance (like insect infestation). We mapped forest cover gain by examining tree canopy cover for years 1985, 2000, and 2012, and defining gain as areas that increased their forest canopy cover above the 49% threshold. Forest gain was mapped separately within areas of forest cover loss 1985-2012 (to assess forest recovery after disturbance) and within non-forest areas of 1985 (to quantify recovery of pre-1985 disturbance and afforestation within abandoned agriculture lands).
Table 1. Accuracy measurements for the regional forest cover change products
Validation confirms the high accuracy of our products, although the region-wide Landsat-based products demonstrate certain change detection omission (Tab. 1). The producer’s accuracy for forest loss and gain (88% and 75%, respectively) was lower than the user’s accuracy (89% and 91%). We found that classification errors were found nearly exclusively within one pixel along the change/no change interface. Our results confirmed previous findings (Tyukavina et al., 2013) that a simple two-strata design should be avoided for change map validation because it may result in an incorrect accuracy measurements. We also performed a comparison of sample-based validation of forest cover loss results between the global product (Hansen et al., 2013) and our product. Applying regional rather than continental (in case of global product) classification model improved user’s and producer’s accuracy from 65% and 68%, respectively, for the global product, to 94% and 88% for our regional product.
Figure 2. Difference of national and regional annual logging area relative to Soviet era (1985-1988)
3. RESULTS AND DISCUSSION
Our consistent, region-wide analysis revealed substantial changes in the forest cover of Eastern Europe from 1985 to 2012. The total forest cover area increased from 216 million ha in 1985 to 226 million ha in 2012, representing +4.7% net forest area gain. At the national level, forest cover increased in all Eastern European countries except Estonia and Latvia. On the sub-national level, however, additional hotspots of net forest cover loss were detected, e.g. within most populated regions of Russia: Moscow and Saint Petersburg.
Almost 11% of the 1985 forest cover experienced disturbances, with an average disturbance rate of 0.41% of total forest area per year. Temporal trend of forest cover loss within the region followed a general pattern of slowing down after the breakdown of Soviet economy during 1990s, and increased after the early 2000s. Average annual loss from year 2007 to 2012 was 22% higher than that during Soviet era. The change rates of annual forest loss attributed to logging were different among countries and regions (Fig. 2). While most of the countries experienced a negligible change or even a decline in
forest cover loss after the breakdown of Soviet Union in 1990s, logging intensity in some countries (Slovakia, Estonia, Latvia, and Lithuania) increased immediately after the breakdown, possibly due to faster transition to market economy. During early 2000s annual logging area increased in all countries except Russia. Most of the countries doubled their logging area compared to Soviet times; Estonia increased logging intensity three-fold, and Latvia almost by a factor of four. The global economic crisis in late 2000s affected timber harvesting differently. Central European (Slovakia, Czech Republic, and Poland) and Baltic countries kept increasing their logging rates, while in other countries annual logging area remained the same or even decreased.
While timber harvesting increased compared to Soviet times throughout the region, it remained lower than the pre-1990 rate in European Russia. However, the harvesting intensity trends are different at regional level. The Central region, containing most of the European Russia population and the home of the main timber processing enterprises, experienced increase in timber harvesting analogous to other Eastern European countries. On the contrary, logging intensity within other regions remained lower or equivalent to Soviet times.
User’s accuracy of change class
Producer’s accuracy of change class Forest cover loss
1985-2000
89.9% 90.0%
Forest cover loss
2000-2012
94.3% 88.2%
Forest cover gain (after loss 1985-2012)
98.3% 96.9%
Forest cover gain (within 1985 non-forest)
To understand relative forest cover change within Eastern European countries in a pan-European context, we compared annual forest loss rate among Eastern and Western European countries. While such comparison could not be performed using our dataset, we employed the Hansen et al., (2013) global forest cover and 2000-2012 loss product available through Global Forest Watch Web Portal (http://www.globalforestwatch.org/). We used the tree canopy cover 2000 layer above a 50% threshold to obtain forest area for 2000 as well as annual gross forest cover loss datasets. As the Global Forest Change product does not allow forest cover loss disaggregation by disturbance type, we assumed that most of the stand-level disturbance within Central and Northern European countries were due to forest harvesting. The result of our comparison shows that the rate of clear-cutting is similar between Scandinavia and Baltic states, and between Eastern and Western Central European countries (Fig. 3). All countries exhibit increase in logging intensity in the mid-2000s. After the global economic crisis, however, logging rates decreased in most of the countries except the Baltic states. By 2012, selected Eastern European countries showed higher logging rates compared to their Western neighbors. Gross forest cover rate in Latvia was higher than in Scandinavia countries since the beginning of 2000s with Estonia and Lithuania gross forest cover rate surpassing Scandinavia countries’ rates by 2012. In Poland, Slovakia, and Czech Republic, forest cover loss rates were higher than in Germany and Austria during the 2000s. Several factors may be responsible for high logging intensity in Eastern European countries: land restitution and market opening, trade liberalization after joining the European Union, intensification of timber processing, removal of Soviet forest protection restrictions, and the maturing of forest plantations established immediately after WorldWar II in areas of degraded and burned forests (Brukas et al., 2009; Lazdinis et al., 2004). Current intensity of forest loss caused a net reduction of forest cover area in Estonia and Latvia by 2% and 4%, respectively. Forest cover declines indicate that such logging intensity may be above sustainable forestry limits. Further spatial and socio-economic analysis is required to understand the causes and consequences of current logging intensity rates in these countries.
Figure 3. Annual gross forest cover loss (4-years average) as percent of year 2000 forest cover for groups of selected countries. Data from Hansen et al., 2013, downloaded from
http://www.globalforestwatch.org/
Timber harvesting was the main driver of forest cover dynamics in Eastern Europe, while extent of large natural disturbances was relatively low and comprised less than 10% of
the total forest loss area. However, the frequency and extent of wildfires and windfalls significantly increased during late 2000s. The percent of total forest loss attributed to wildfires increased from 1.5% of total forest loss in the 1980s to 11.3% during the 2007-2012 interval. Of the total forest loss area, 29% was attributed to wildfires in year 2011, when most of the damage for the extreme 2010 fire season in European Russia was detected. Increase of wildfire extent and frequency is related to increase in drought frequency and may be a consequence of long-term climate change within the region (Schelhaas et al., 2003; Groisman & Soja, 2009; Seidl et al., 2011).
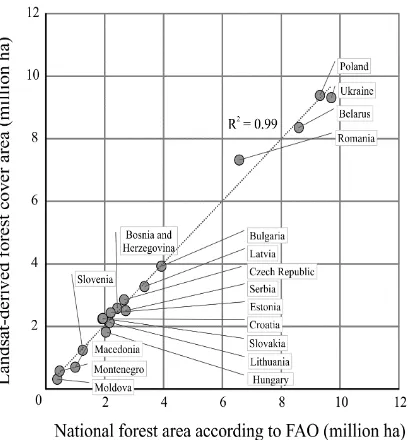
Figure 4. Inter-comparison between Landsat-based forest cover area for 2010 and FAO Forest Resource Assessment 2010
forest area (FAO, 2010)
Forest cover usually re-established quickly after clearcutting or natural disturbance, either through plantation or natural regeneration. More than a half (58%) of all the disturbance from 1985-2012 recovered into forest by 2012. Within the 1985-1988 stand-level disturbances, forest recovery occurred on 85% of the area. In year 2012, young forests established after forest disturbances and on abandoned agriculture lands represent 15% of the total forest cover. Only 12% of the areas of forest loss prior to 1995 had not yet recovered by 2012. Afforestation of abandoned agriculture lands played a significant role in overall forest area increase, with almost 6.5 million ha of new forests established since 1985. In many countries afforestation of former cropland areas outweighed the effect of increased logging intensity, thus leading to net gain of forest cover area. Our results, however, show only areas where dense (above 49% tree canopy cover) forests established over abandoned agriculture areas. Where the afforestation process in abandoned areas is slow due to a lack of seed sources, high frequency of fires, or a dense sod layer prohibiting seedling establishment were not mapped as forest gain in our results.
shows strong agreement with a r2 of .99 despite possible differences in forest definitions. However, we detected considerable differences between Landsat-based and official national net forest cover change estimations (Fig. 5). We compared 1985-2012 Landsat-based net forest cover change data with official forest cover change between 1990 and 2010 (Forest Europe., 2011). While we observe the same pattern of forest cover area increase at the regional level, the national estimates for several countries are either underestimate forest
Figure 5. Inter-comparison between Landsat-based and official (Forest Europe., 2011) net forest cover change estimates
area increase (Poland, Ukraine, Hungary, Croatia, Czech Republic) or overestimating forest area increase (Belarus, Bulgaria, Serbia, Lithuania, Macedonia, Estonia, Latvia). Omission of certain tree cover gain areas (dense orchards, afforestation over abandoned lands) from official statistics may explain forest increase underestimation compare to Landsat-based results. The overestimation of net forest gain by national agencies may be explained by the fact that forest regeneration usually included into national reporting in an early stage, before young forest cover become visible on satellite images. In contrary with official statistics, our data shows the net forest cover loss in Baltic states, Estonia and Latvia, which experienced high and increasing rates of logging operations.
To show the value of area-based logging intensity estimates derived from Landsat data, we compared average 2009-2011 annual Landsat-based logging area with official roundwood production statistics for year 2010 (Forest Europe., 2011). Our result showed strong correlation between these parameters for former USSR republics and for other Eastern European countries (Fig. 6). However, we noticed substantial difference between these two groups of countries. The average volume per hectare of Landsat-detected forest loss was 211 m3 in former USSR republics and 524 m3 in other countries. We suppose that the difference is related to methods of roundwood production measurement, differences in climate and soil quality, and may also be related to a proportion of selective logging (which were not mapped by this Landsat product) in total forest felling. Nevertheless, the strong relationship between forest loss and roundwood production statistics found by this data inter-comparison shows possibility for timber production estimation from satellite-derived data.
4. CONCLUSION
The primary goal of our project was to create a spatially and temporally consistent geospatial dataset depicting forest cover dynamics within Eastern European countries over nearly three decades (1985-2012). For our analysis, we used land-cover based definitions of forest cover, gross forest cover loss and gain, to overcome differences among the forest definition used by different national and international forest monitoring agencies (FAO, 2000). Remote sensing-based products that employ biophysical criteria of forest cover (defined according to tree canopy cover thresholds without attribution to specific land cover categories and land use) are better suitable for carbon loss monitoring that forest inventory data which are based on land use definitions (DeFries et al., 2002; Burges et al., 2012; Harris et al., 2012; Tyukavina et al., 2013). Regional products that are based on a consistent, normalized set of inputs derived from long-term satellite archive are the only data source that allows for consistent forest change monitoring at the international level, alleviating the need for harmonization procedures commonly applied to regional and national forestry inventory data (Levers et al., 2014). Our long-term monitoring results clearly manifest the effects of changes in forest management after the breakdown of Soviet “planned” economy on forest cover disturbance and recovery dynamics. These results are well suited to provide baseline for regional socio-economic researches. Our comparison with official data demonstrated the utility of Landsat-based archive in consistent land-cover change characterization. The future of our approach relies on free-of-charge, consistent satellite data supply from Landsat and Landsat-like (e.g., Sentinel) missions.
ACKNOWLEDGMENT
The project was supported by NASA Land-Cover/Land-Use Change Program research grants NNX13AC66G and NNX12AG74G. We greatly appreciate help in fieldwork from our colleagues E. Boren, M. Doktorova, M. Dubinin, A. Manisha, and A. Purekhovsky.
REFERENCES
Baumann, M., Ozdogan, M., Kuemmerle, T., Wendland, K. J., Esipova, E., Radeloff, V. C., 2012. Using the Landsat record to detect forest-cover changes during and after the collapse of the Soviet Union in the temperate zone of European Russia.
Remote Sensing of Environment, 124, 174–184.
Breiman, L., Friedman, J.H., Olshen, R.A., Stone, C.J., 1984.
Classification and regression trees. Monterey, California:
Wadsworth and Brooks/Cole.
Brukas, V., Linkevičius, E., Činga, G., 2009. Policy drivers behind forest utilisation in Lithuania in 1986-2007. Baltic Forestry, 15(1), 86–96.
Burgess, R., Hansen, M., Olken, B. A., Potapov, P., Sieber, S., 2012. The Political Economy of Deforestation in the Tropics.
The Quarterly Journal of Economics, 127(4), 1707–1754.
DeFries, R. S., Houghton, R. A., Hansen, M. C., Field, C. B., Skole, D., Townshend, J., 2002. Carbon emissions from tropical deforestation and regrowth based on satellite
observations for the 1980s and 1990s. Proceedings of the National Academy of Sciences, 99 (22), 14256–14261.
FAO [Food and agriculture organization of the United Nations] (2000) On definitions of forest and forest change. FAO FRA 2000, working paper 33. FAO, Rome
FAO, 2010. Global forest resources assessment 2010. Rome: UNFAO.
Forest Europe, UNECE and FAO: State of Europe’s Forests 2011. Status and Trends in Sustainable Forest. Ministerial Conference on the Protection of Forests in Europe, 2011.
Griffiths, P., Kuemmerle, T., Baumann, M., Radeloff, V. C., Abrudan, I. V., Lieskovsky, J., Hostert, P., 2014. Forest disturbances, forest recovery, and changes in forest types across the Carpathian ecoregion from 1985 to 2010 based on Landsat image composites. Remote Sensing of Environment, 151, 72– 88.
Groisman, P., Soja, A. J., 2009. Ongoing climatic change in Northern Eurasia: justification for expedient research.
Environmental Research Letters, 4(4), 045002.
Hansen, M. C., Loveland, T. R., 2012. A review of large area monitoring of land cover change using Landsat data. Remote Sensing of Environment, 122, 66–74.
Hansen, M. C., Defries, R. S., Townshend, J. R. G., Carroll, M., Dimiceli, C., Sohlberg, R. A., 2000. Global percent tree cover at a spatial resolution of 500 meters: first results of the MODIS vegetation continuous fields algorithm. Earth Interactions, 10.
Hansen, M. C., Potapov, P. V, Moore, R., Hancher, M., Turubanova, S., Tyukavina, A., Townshend, J. R. G., 2013. High-resolution global maps of 21st-century forest cover change. Science, 342, 850–3.
Harris, N. L., Brown, S., Hagen, S. C., Saatchi, S. S., Petrova, S., Salas, W., Lotsch, A., 2012. Baseline map of carbon emissions from deforestation in tropical regions. Science (New York, N.Y.), 336(6088), 1573–6.
Kuemmerle, T., Kozak, J., Radeloff, V. C., Hostert, P., 2009. Differences in forest disturbance among land ownership types in Poland during and after socialism. Journal of Land Use Science, 4(1-2), 73–83.
Kuemmerle, T., Radeloff, V. C., Perzanowski, K., Hostert, P., 2006. Cross-border comparison of land cover and landscape pattern in Eastern Europe using a hybrid classification technique. Remote Sensing of Environment, 103(4), 449–464.
Lazdinis, M., Carver, A., Carlsson, L., Tõnisson, K., Vilkriste, L., 2004. Forest policy networks in changing political systems: Case study of the Baltic states. Journal of Baltic Studies, 35(4), 402–419.
Olofsson, P., Foody, G. M., Herold, M., Stehman, S. V., Woodcock, C. E., Wulder, M. A., 2014. Good practices for estimating area and assessing accuracy of land change. Remote Sensing of Environment, 148, 42–57.
Olofsson, P., Kuemmerle, T., Griffiths, P., Knorn, J., Baccini, A., Gancz, V., Woodcock, C. E., 2011. Carbon implications of forest restitution in post-socialist Romania. Environmental Research Letters, 6(4), 045202.
cover loss in Democratic Republic of the Congo, 2000-2010, with Landsat ETM+ data. Remote Sensing of Environment, 122, 106–116.
Potapov, P. V., Turubanova, S. A., Tyukavina, A., Krylov, A. M., McCarty, J. L., Radeloff, V. C., Hansen, M. C., 2014. Eastern Europe’s forest cover dynamics from 1985 to 2012 quantified from the full Landsat archive. Remote Sensing of Environment, 159, 28–43.
Potapov, P., Turubanova, S., Hansen, M. C., 2011. Regional-scale boreal forest cover and change mapping using Landsat data composites for European Russia. Remote Sensing of Environment, 115(2), 548–561.
Schelhaas, M.-J., Nabuurs, G.-J., Schuck, A., 2003. Natural disturbances in the European forests in the 19th and 20th centuries. Global Change Biology, 9(11), 1620–1633.
Seebach L., Strobl P., San Miguel-Ayanz J., Gallego J., Bastrup-Birk, A., 2011. Comparative analysis of harmonized forest area estimates for European countries. Forestry, 84, 285-299.
Seidl, R., Schelhaas, M.-J., Lexer, M. J., 2011. Unraveling the drivers of intensifying forest disturbance regimes in Europe.
Global Change Biology, 17(9), 2842–2852.
Stehman, S. V., 2012. Impact of sample size allocation when using stratified random sampling to estimate accuracy and area of land-cover change. Remote Sensing Letters, 3, 111-120.
Strimbu, B. M., Hickey, G. M., Strimbu, V. G., 2005. Forest conditions and management under rapid legislation change in Romania. The Forestry Chronicle, 81(3), 350–358.
Torniainen, T. J., Saastamoinen, O. J., Petrov, A. P., 2006. Russian forest policy in the turmoil of the changing balance of power. Forest Policy and Economics, 9(4), 403–416.
Tomppo, E., Gschwantner, Th., Lawrence, M., McRoberts, R.E., 2010. National forest inventories. New York: Springer (DOI 10.1007/978-90-481-3233-1).
Tyukavina, A., Stehman, S. V, Potapov, P. V., Turubanova, S. a, Baccini, A., Goetz, S. J., Hansen, M. C., 2013. National-scale estimation of gross forest aboveground carbon loss: a case study of the Democratic Republic of the Congo. Environmental Research Letters, 8(4), 1–14.
Vanwambeke, S. O., Meyfroidt, P., Nikodemus, O., 2012. From USSR to EU: 20 years of rural landscape changes in Vidzeme, Latvia. Landscape and Urban Planning, 105(3), 241–249.
Wendland, K. J., Lewis, D. J., Alix-Garcia, J., Ozdogan, M., Baumann, M., Radeloff, V. C., 2011. Regional- and district-level drivers of timber harvesting in European Russia after the collapse of the Soviet Union. Global Environmental Change,
21(4), 1290–1300.
Wulder, M. A., White, J. C., Goward, S. N., Masek, J. G., Irons, J. R., Herold, M., Woodcock, C. E., 2008. Landsat continuity: Issues and opportunities for land cover monitoring.