Rapid Disaster Analysis based on SAR Techniques
C.H. Yang*, U. Soergel
Technische Universität Darmstadt, Institute of Geodesy, Germany - (yang, soergel)@geod.tu-darmstadt.de
KEY WORDS: Disaster Analysis, SAR, Change Detection, Curvelet Filtering, Morphological Approach
ABSTRACT:
Due to all-day and all-weather capability spaceborne SAR is a valuable means for rapid mapping during and after disaster. In this paper, three change detection techniques based on SAR data are discussed: (1) initial coarse change detection, (2) flooded area detection, and (3) linear-feature change detection. The 2011 Tohoku Earthquake and Tsunami is used as case study, where earthquake and tsunami events provide a complex case for this study. In (1), pre- and post-event TerraSAR-X images are co-registered accurately to produce a false-color image. Such image provides a quick and rough overview of potential changes, which is useful for initial decision making and identifies areas worthwhile to be analysed further in more depth. In (2), the post-event TerraSAR-X image is used to extract the flooded area by morphological approaches. In (3), we are interested in detecting changes of linear shape as indicator for modified man-made objects. Morphological approaches, e.g. thresholding, simply extract pixel-based changes in the difference image. However, in this manner many irrelevant changes are highlighted, too (e.g., farming activity, speckle). In this study, Curvelet filtering is applied in the difference image not only to suppress false alarms but also to enhance the change signals of linear-feature form (e.g. buildings) in settlements. Afterwards, thresholding is conducted to extract linear-shaped changed areas. These three techniques mentioned above are designed to be simple and applicable in timely disaster analysis. They are all validated by comparing with the change map produced by Center for Satellite Based Crisis Information, DLR.
* Corresponding author.
1. INTRODUCTION
The works presented here have been conducted in the framework of RapidMap project funded by CONCERT-Japan. The aim of RapidMap is to investigate methods of extracting useful information to identify disaster damages near real time by utilizing Remote Sensing and Geographic Information Science. The contributions come from scientific groups of European countries and Japan. More information and achievements can be found on the RapidMap website: http://rapidmap.fbk.eu/. This paper presents the contributions with respect to SAR works in RapidMap. They are divided into three parts: (1) initial coarse change detection, (2) flooded area detection, and (3) linear-feature change detection. They are designed under the sake of rapid disaster analysis in practical application.
The 2011 Tohoku Earthquake and Tsunami disaster, which occurred on March 11, 2011 in Japan, is taken as case study. It is abbreviated to Tohoku event for simplicity in the following context. The Tohoku event hit the Pacific coast of Japan and induced serious destruction especially in the Tohoku region. More details are provided by Center for Satellite Based Crisis Information (ZKI, 2011a).
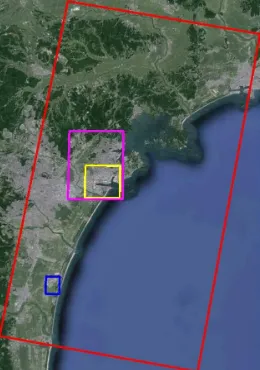
The study area shown in Figure 1 is situated around Sendai, Japan. It was severely damaged by the tsunami. This study area is chosen for two major reasons. Firstly, the first post-event TerraSAR-X (TSX) image was taken just one day after the tsunami occurred. Therefore, most damages caused by flooding are assumed to be captured by this image. Secondly, the diversity of land covers is abundant, including airport, port, industrial zone, residential district, farmland, forest etc. Hence, this study area is a good subject for testing various approaches of change detection.
Figure 1. Study area in Sendai area, Japan. The vertical axis coincides with north-south direction. The red square indicates the border of TSX image acquired on March 12, 2011 (one day after the tsunami). The Sendai harbor (yellow square) is chosen as the cutout of false-color image in section 2.2. With respect to linear-feature change detection using Curvelet-based approach, the pink square indicates the composite study area in section 4.3, and the blue square encircles an area of interest in section 4.4.
Three approaches of change detection based on SAR techniques using spaceborne data are presented in this paper. In case of disaster, rapid extraction of useful information from accessible data is needed for rescue operation and decision making. In (1) two TSX amplitude images are used as red, green and blue bands of a false-color image. The allocation way depends on the anticipated presentation of visual pattern in change. Discrepancies in scattering coefficients of corresponding pixels between these two TSX images cause color variations of The International Archives of the Photogrammetry, Remote Sensing and Spatial Information Sciences, Volume XL-3/W2, 2015
different degrees. False-color image provides a quick and rough overview over changes. The analysis on false-color image is useful for initial decision making and to identify areas worthwhile to be analyzed further in more depth. However, there are two intrinsic shortcomings existing. Firstly, many changes of no interest appear across within the scene, for instance, due to farming activity, traffic, or speckle. This situation makes both visual and automatic recognitions difficult. Secondly, since just any change is highlighted there is no discrimination with respect to the type of change and which kind of object was affected.
We turn now to an important tsunami-specific task: the detection of flooding. In this study, thresholding and morphological filtering are applied to extract such areas. Due to characteristics of SAR system such as side-looking viewing geometry and long wavelength, specular reflection occurs at the water surface. Thus, flooded areas appear darker than the other types of land cover in SAR image. This implies that flooded areas can be extracted from the post-event TSX image rather easily. In Section 3 this approach is presented.
The third approach deals with the extraction of changes which appear as linear connected pattern in the difference images. Such pattern might be caused by damaged buildings or roads. In order to filter only such locations we apply Curvelet filtering
All the results in this study have been validated by comparing with a thematic map of change detection - "TerraSAR-X Change Analysis of Sendai Area, Japan" (ZKI, 2011b). This reference data will be shortly called thematic map in the following context. Albeit the presented approaches are not actually up-to-date, they are chosen and investigated considering simplicity, efficiency and effectiveness. The major objective to bring these contributions is to propagate the outperformances of SAR technique in disaster analysis.
2. INITIAL COARSE CHANGE DETECTION 2.1 Pre- and Post-event TSX Images
Orbit 42
Beam Strip_003
Acquisition Mode Stripmap
Polarization HH
Orbit Direction Descending
Looking Direction Right Average Incidence
Angle 37
Table 1. System parameters for the pre- and post-event TSX images
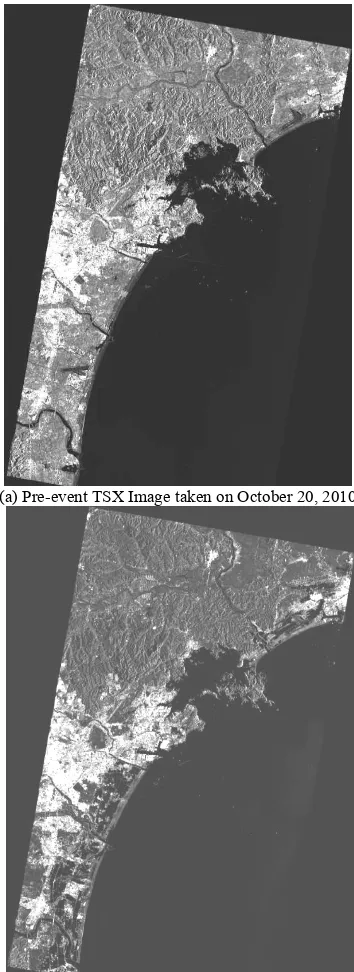
The pre- and post-event TSX images (Figure 2) used in this study have been acquired on October 20, 2010 and March 12, 2011, respectively. The corresponding system parameters are listed in Table 1. The time interval of both TSX images is 143 days, which is not optimal with respect to temporal de-correlation. Nevertheless, this pair is still useful because the post-event TSX image was taken just one day after the Tohoku event. Therefore, the destruction caused by the earthquake and tsunami is assumed to be captured completely.
(a) Pre-event TSX Image taken on October 20, 2010
(b) Post-event TSX Image taken on March 12, 2011 Figure 2. Pre- and post-event TSX images acquired respectively on October 20, 2010 (a) and March 12, 2011 (b). These two TSX images have been accurately co-registered and radiometrically calibrated.
As shown in Figures 2(a) and 2(b), the scattering coefficients in settlements are higher than the other areas. Due to flooding, the coastal areas (supposed to be flooded) in the post-event TSX image (Figure 2b) appear very dark. The main reason is the increased specular reflection at water surfaces near the shore. Another reason might be seasonal effects, e.g. plant phenology. A deeper exploration of the mechanism causing this scenario is out of the scope of this paper. Actually, after the Tohoku event within few days, there were indeed other available spaceborne images from optical sensors except radar system. However, these optical images suffer either from clouds or other The International Archives of the Photogrammetry, Remote Sensing and Spatial Information Sciences, Volume XL-3/W2, 2015
atmospheric effects. Thus, these optical images hardly provide useful ground information for disaster analysis as the TSX images used in this study. This fact shows the advantage of using radar data in disaster analysis.
2.2 False-Color Image
The first step in generating false-color image is to accurately co-register the pre- and post-event TSX images followed a radiometric calibration. The approaches proposed by (Holecz et al., 1993) and (Holecz et al., 1994) are used here.
(a)
(b)
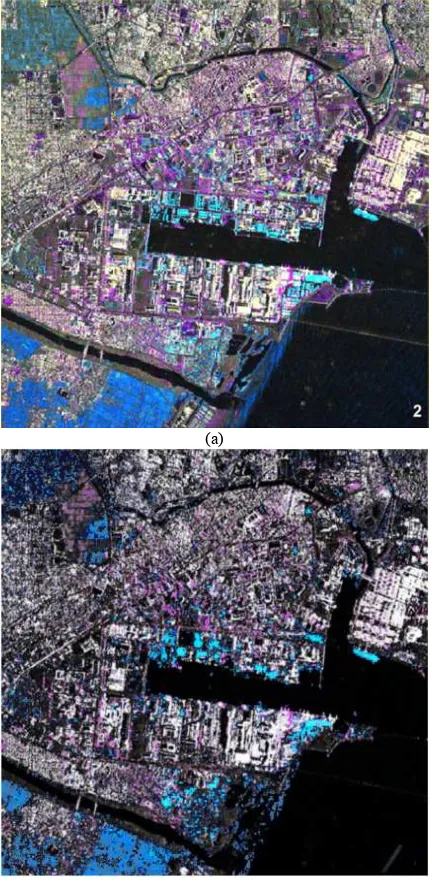
Figure 3. (a) Cutout of the thematic map around Sendai harbor. (Magenta: deposited debris due to the tsunami; Bright blue: Tsunami-affected infrastructure; Dark blue: flooded area) (b) Cutout of false-color image with the same range and same color meanings as (a).
After co-registration and radiometric calibration, the pre-event TSX image is inserted into blue band, the post-event one is assigned into red and green bands, and consequently a false-color image is generated. In this paper, a cutout (Figure 3(b)) of
this false-color image around the Sendai harbor is zoomed in for detailed discussion. The range of this cutout is shown within the yellow square in Figure 1.
Figure 3 shows the comparison between the thematic map and the false-color image in Sendai harbor area. It is obvious that the change patterns out of these colors are consistent, which validates the color image. Actually, generating such false-color image can be done efficiently depending on how much effort is made to polish it. In the authors’ experience, a rough false-color image can be done possibly in half an hour given a pair of pre- and post-event SAR images and suitable tools have been prepared already. In short, generating false-color image for initial disaster analysis is concluded as promising and practical in reality.
3. FLOODED AREA DETECTION
In terms of flood disaster, flooded area detection is very crucial to assist in disaster analysis, rescue and logistics. It is rather simple to detect flooded area from SAR image. The reason is that such smooth water on flood area appears darker than surrounding area as a result of side-looking viewing geometry and long wavelength of SAR system.
(a) (b)
Figure 4. (a) The flooded areas along the coasts are marked by blue in the thematic map. (b) The detected flooded areas (blue) by using morphological approaches in this study. Both red squares indicate the range of the study area.
In this study, global thresholding is applied in the post-event TSX image at first step to extract the tacit flooded area. This step is quite effective because the flood areas appear relatively dark as seen in Figure 2(b). Although the mountainous areas appear quite dark too, they are still slightly brighter than flooded areas. Thus, the discrimination between flooded and mountainous areas is feasible by thresholding. Afterwards, dilation and erosion operations are applied to obtain large connected flooded areas. As a matter of fact, morphological operations could cause false-alarms as well. The trade-off should be dependent on a priori information and empirical operation. For example, the tsunami is known to be the cause of the flooded areas in this case. Thus, the morphological operations can be restricted to low lands close to the shore..
Finally, the detected flooded areas marked by blue are displayed in Figure 4(b), and the counterparts in the thematic map are shown in Figure 4(a). After comparison, it is observed that the detected flooded areas are consistent with the marked flooded areas in the thematic map. This validates that using The International Archives of the Photogrammetry, Remote Sensing and Spatial Information Sciences, Volume XL-3/W2, 2015
morphological approaches with SAR image is an effective way to detect flooded area.
4. LINEAR-FEATURE CHANGE DETECTION 4.1 Curvelet Filtering
Curvelet transformation decomposes a given image into a sum of so-called Curvelets, which are characterized by linear features in different scales, orientations, and positions. More details can be found in (Candès and Donoho, 2004), (Candès et al., 2006) and (Starck et al., 2010).
In application of Curvelet transformation to image, the magnitude of Curvelet coefficient depends on the strength of a linear-feature in specific scale, orientation and position. Because we are interested in objects larger than a minimum size, we look for large Curvelet coefficients of courser scales. In contrast, in case of irregular-features, e.g. point-like noise, the corresponding signals are distributed mainly over finer scales. In fact, other techniques like Wavelet transform can also separate irregular-features into Wavelet coefficients of finer scales. The distinction of Curvelet transform from others is its sensitivity for linear-features.
4.2 Process
The absolute difference value in the difference image indicates the change degree within one pixel during the pre- and post-events. Apparent linear-features indicate highlighted changes of man-made structures, e.g. building, bridge and infrastructures. Contrarily, irregular-features are regarded as false alarms in this case. These false alarms can be either noise or changes of irregular-feature. The range of difference values is stretched to form a single-band grayscale image. As a result changes would appear saliently either brighter or darker for visual inspection and for subsequent Curvelet filtering.
The aim of Curvelet filtering is to downweight the Curvelet coefficients of finest scale in the transformed difference image. After Curvelet filtering, the contributions of irregular-features to the initial difference image are diminished. Then inverse Curvelet transformation is applied to retrieve the difference image retaining linear-features but suppressing irregular-features.
Finally, thresholding is used to extract the significant linear-feature changes from the Curvelet-filtered difference image. Those difference values, above and below upper and lower thresholds, respectively, are extracted as the linear-feature changes. Two study cases are addressed in the following sections 4.3 and 4.4.
4.3 Study Case of Composite Area
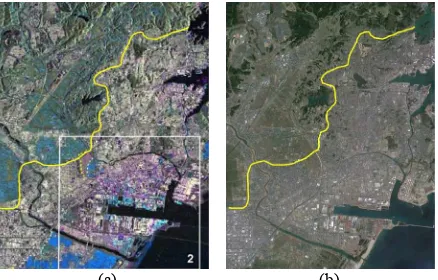
A composite area near the Sendai harbor is selected as the study area to demonstrate the proposed Curvelet-based approach. Figure 5 shows the overview of this composite area in the thematic map as well as Google Earth image. This composite area contains harbor, factories, houses, farmlands, forests, shores etc. According to the thematic map, most of the change areas are situated in the flood-influenced areas along the coasts, including destroyed buildings, structural damages in the Sendai harbor and flood cover. Most of them are assumed to present linear-features in the difference image. Oppositely, fewer changes can be found in the flood-free area covering
settlements, farmlands and mountainous areas. Such changes were caused by arbitrary factors not related to the Tohoku event. Most of them look like irregular-features in the difference image. The changes in the flood-free area and the irregular-feature changes in the flood-influenced area are considered as false alarms in this case. The aim is to exclusively extract the linear-feature changes without false alarms.
(a) (b)
Figure 5. (a) Cutout from the thematic map within a composite area. The meanings of the symbolic colors are described in the caption of Figure 3. The frame of this area can be seen within the pink square in Figure 1. The yellow line specifies the boundary between the free (top-left part) and flood-influenced (down-right part) areas. (b) The counterpart of (a) with the Google Earth image overlaid for overview of ground situation.
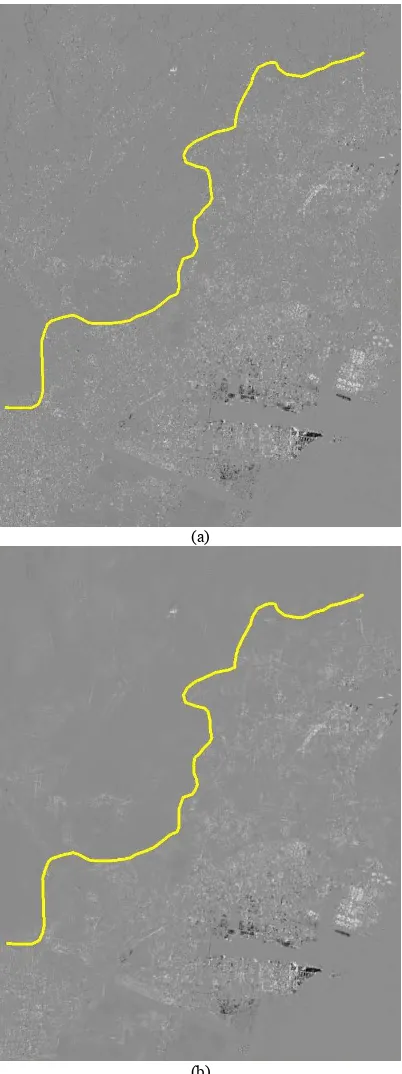
Figure 6(a) indicates the stretched difference image where the nominal changes spread across the whole scene inclusive of flood-free and flood-influenced areas. The changes are highlighted by bright and dark grayscale values here. Figure 6(b) shows the result of applying Curvelet filtering to the stretched difference image. The distinction between Figures 6(a) and 6(b) is visually clear. The false alarms in Figure 6(b) are filtered out quite effectively either across the free area or in the flood-influenced area. Only the linear-feature changes are preserved. In short, the aim of Curvelet filtering has been achieved in this step.
The same thresholding is used to extract the linear-feature changes in both the difference images with and without Curvelet filtering. Both resultant extracted changes, which are marked by whites, are displayed in Figure 7. In the case without Curvelet filtering (Figure 7(a)), many false alarms exist throughout the entire scene. Since no filtering of any kind is applied, all types of change and false alarms have been extracted at all.
In contrarily, the linear-feature changes have been exclusively extracted in the case with Curvelet filtering as shown in Figure 7 (b). The false alarms in the flood-free area are almost gone. Herein one small group consisting of few pixels was remained. They might essentially be linear-feature change from man-made structures. Exploring the reason is out of the scope of this paper. In the flood-influenced area, the extracted linear-feature changes can be clearly separated from the false alarms. Compared Figures 5(a) with 7(b), the areas of deposited debris (magenta) in the former conform to the extracted linear-feature changes in the latter.
(a)
(b)
Figure 6. (a) The (stretched) difference image of the pre- and post-event TSX images. The yellow line indicates the boundary between the flood-free and flood-influenced areas. The bright and dark areas indicate the nominal changes caused by various reasons; otherwise, the common gray areas are interpreted as the unchanged areas. (b) The difference image resultant of Curvelet filtering on the one shown in (a).
The demonstrations described in this section prove the practical utility of proposed Curvelet-based approach. Another interesting case will be addressed in the next section 4.4.
(a)
(b)
Figure 7. The extracted change areas (white) by Curvelet-based approach (b) and without Curvelet filtering (a). The yellow line indicates the boundary between the free and flood-influenced areas.
4.4 Study Case of Detecting Damaged Bridge
(a)
(b)
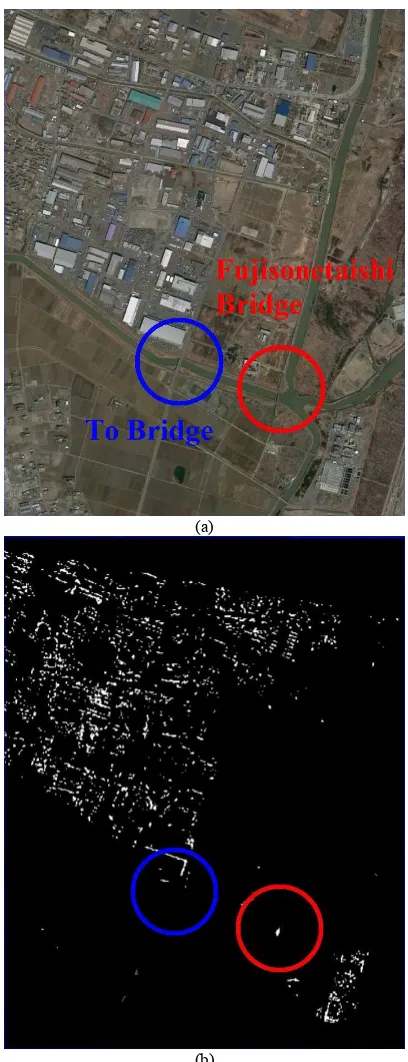
Figure 8. (a) Google Earth image imposed within the study area for detecting damaged bridge using Curvelet-based approach (section 4.4). To and Fujisonetaishi Bridges are encircled by blue and red circles, respectively. An industrial area (Sendai Kuko Iwanuma Rinku Kogyo Danchi) is situated in the top-left part surrounded by farmlands and waterways. The location of this study area is indicated by a blue square in Figure 1. (b) The extracted linear-feature changes (white) by Curvelet-based approach in the study area (a).
For disaster management, it is important to rapidly determine the state of infrastructure. For example, whether or not roads and bridges are still in good condition after disaster? In this section two bridges are taken as subjects to demonstrate Curvelet-based approach in detecting damaged bridge. The study area imposed by a Google Earth image is shown in Figure 8(a). An industrial area is situated in the top-left part surrounded by farmlands and waterways. The two bridges in discussion are To Bridge (in blue circle) and Fujisonetaishi Bridge (in red circle). The thematic map shows that Fujisonetaishi Bridge was affected more seriously by the Tohoku event than To Bridge. The reason can be found in Figure 9 where a cutout covering Fujisonetaishi Bridge from the Google Earth image acquired on March 14, 2011 is shown. This image reveals that a lot of debris accumulated on and around the Fujisonetaishi Bridge. In this study, Fujisonetaishi Bridge is arguably defined as damaged bridge due to the tsunami.
Figure 9. The ground scene of Fujisonetaishi Bridges in the Google Earth image acquired on March 14, 2011 (three days after the Tohoku event).
The pre- and post-event TSX images within the study area (Figure 8) are shown in Figures 10(a) and 10(b), respectively. Due to the difference in scattering coefficients caused by the flooding, many false alarms are anticipated in the pure difference image without Curvelet filtering. According to the thematic map, this study area was completely covered by flood. This fact can be also perceived in Figure 10(b) where the plains appear darker than Figure 10(a). However, where and what kind of the changes in built-up areas are hard to determine by comparing Figures 10(a) and 10(b). The conditions of the two bridges in discussion cannot be clarified either. The following context will demonstrate the distinction of Curvelet-based approach in highlighting linear-feature changes but suppressing false alarms.
The difference image is shown in Figure 11(a). The changes of any type, which are highlighted by bright and dark grayscale values, spread over the entire study area. Curvelet filtering was applied to this difference image to extract the linear-feature changes without the false alarms. The filtered difference image is illustrated in Figure 11(b). Compared to Figure 11(a), the The International Archives of the Photogrammetry, Remote Sensing and Spatial Information Sciences, Volume XL-3/W2, 2015
irregular features are filtered out but the linear features are retained completely.
(a)
(b)
Figure 10. The pre-event (a) and post-event (b) TSX images within the study area (Figure 8). These two TSX images have been accurately co-registered and radiometrically calibrated. The blue and red circles indicate the locations of To and Fujisonetaishi Bridges respectively.
(a)
(b)
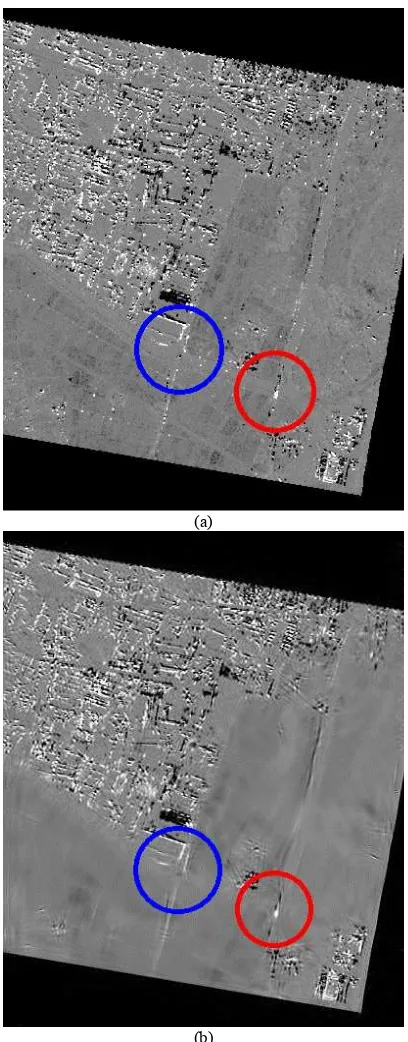
Figure 11. (a) The (stretched) difference image of the pre- and post-event TSX images within the study area (Figure 8). (b) The difference image shown in (a) after Curvelet filtering. The blue and red circles indicate the locations of To and Fujisonetaishi Bridges respectively.
Finally, thresholding was applied to the filtered difference image to pick out the linear-feature changes. The result is shown in Figure 8(b). The pattern of linear-feature changes is consistent with the thematic map. Most linear-feature changes distribute in the industrial area of top-left part as well as the built-up area of down-right corner. Fujisonetaishi Bridge, which is known to be a damaged bridge, is correctly recognized by The International Archives of the Photogrammetry, Remote Sensing and Spatial Information Sciences, Volume XL-3/W2, 2015
Curvelet-based approach. On the other side, To Bridge is correctly sorted as no manifest change. In conclusion, this study case validates the feasibility of Curvelet-based approach in detecting damaged bridge. Both results in sections 4.3 and 4.4 prove the application of Curvelet-based approach in disaster management.
5. CONCLUSIONS
The results with respect to SAR work in RapidMap are presented in this paper. The contributions include (1) initial coarse change detection, (2) flooded area detection, and (3) linear-feature change detection. All proposed approaches are designed based on simplicity, efficiency and effectiveness. They are demonstrated and validated based on the pre- and post-event TSX images under the case study of the Tohoku event. In (1), false-color image is proven to be a simple way of providing quick overview of disaster area. The effort in (2) verifies that flooded area is easy to be extracted from the post-event SAR image using thresholding and morphological approaches. The results in (3) demonstrate that Curvelet-based approach can be used to effectively extract linear-feature changes, e.g. destroyed building and damaged bridge, with reduced false alarms. More information can be found on the RapidMap website: http://rapidmap.fbk.eu/.
ACKNOWLEDGEMENTS
The authors gratefully acknowledge the support from RapidMap project funded by Concert-Japan and the international cooperators. More information and achievements can be found on the RapidMap website: http://rapidmap.fbk.eu/.
REFERENCES
Candès, E. and Donoho, D., 2004. New tight frames of Curvelets and optimal representations of objects with piecewise C2 singularities. Communication on Pure and Applied Mathematics., vol. LVII, pp. 219-266.
Candès, E., Demanet, L., Donoho, D. and Ying, L., 2006. Fast Discrete Curvelet Transforms. Multiscale Model. Simul., vol. 5, no. 3, pp. 861-899.
Holecz, F., Meier, E., Piesbergen, J. and Nuesch, D., 1993. Topographic effects on radar cross section. SAR Calibration Workshop, CEOS Calibration Sub-Group, Noordwijk.
Holecz, F., Meier, E., Piesbergen, J., Wegmueller U. and Nuesch D., 1994. Radiometric calibration of airborne SAR imagery. IGARSS Symposium, Pasadena.
Schmitt, A. and Brisco, B., 2013. Wetland monitoring using the Curvelet-based change detection method on polarimetric SAR imagery. Water, vol. 5, no. 3, pp. 1036-1051.
Starck, J., Murtagh, F. and Fadili, J.M., 2010. Sparse Image and Signal Processing: Wavelets, Curvelets, Morphological Diversity. Cambridge University Press.
ZKI, 2011a. “Earthquake and Tsunami in Japan”, http://www.zki.dlr.de/article/1893.
ZKI, 2011b. “TerraSAR-X Change Analysis of Sendai Area, Japan”, http://www.zki.dlr.de/map/1934.