D E NS E I M A G E M A T C H I NG W I T H T W O ST E PS O F E X PA NS I O N
Z uxun Z hang
a
, J ia’nan He
a
, S han Huang
a
, Y ansong D uan
a,
*
a
S chool of R emote S ensing and Information E ngineering, W uhan University, No.129 L uoyu R oad, W uhan, C hina - zhangzx@ cae.cn, (hjn2010, huangsh)@ whu.edu.cn
C ommission I I I , W G I I I /1
K E Y W OR D S : D ense Image Matching, T wo F rames, E xpansion, S eed-and-Grow, No Geometric C onstraint, A daptive
A B S T R A C T :
D ense image matching is a basic and key point of photogrammetry and computer version. In this paper, we provide a method derived
from the seed-and-grow method, whose basic procedure consists of the following: F irst, the seed and feature points are extracted, after
which the feature points around every seed point are found in the first step of expansion. T he corresponding information on these feature points needs to be determined. T his is followed by the second step of expansion, in which the seed points around the feature
point are found and used to estimate the possible matching patch. F inally, the matching results are refined through the traditional correlation-based method. Our proposed method operates on two frames without geometric constraints, specifically, epipolar
constraints. It (1) can smoothly operate on frame, line array, natural scene, and even synthetic aperture radar (S A R ) images and (2) at the same time guarantees computing efficiency as a result of the seed-and-grow concept and the computational efficiency of the
correlation-based method.
1. I NT R OD UC T I O N
D ense image matching is an important step of 3D reconstruction
and many other applications, with which the depth of or corresponding information on a pixel is determined. It has been
one of the research hotspots in both photogrammetry and computer version for a long time. D ense image matching is
challenging because of occlusions, blurred boundaries of objects, low or repetitive textures, and illumination changes. Moreover,
the calculation speed is another obstacle, either because of the number of images or the size of images or because of the
requirements of real-time applications.
T he goal of dense image matching is to rebuild a 3D scene model
from 2D images. T o achieve this goal, the corresponding relationship of two or more images captured from different
viewpoints of a scene must be rebuilt. T he key and inherent problem of dense i mage matching is the extraction of
corresponding features or points from different images. T o the best of our knowledge, the problem of mismatching in the area
of low-texture and disparity discontinuities is far from being solved. R easonable prior constraints are used in matching
algorithms to obtain better match results.
T he existing algorithms can be divided into local and global methods, according to S charstein and S zeliski (S charstein and
S zeliski, 2002). L ocal methods are based on the disparity consistency constraint, which requires determining a suitable
window shape, window size, and weight of each pixel in the window. Image-segmentation information is also used as prior
knowledge in some methods, but the matching results of those approaches heavily depend on the segmentation results of an
image. T o reduce the parallax search range, local methods
frequently adopt various constraints, which results in a strong dependence on prior knowledge. A t the same time, they are
sensitive to the ambiguous areas caused by low texture and occlusion.
* C orresponding author
Global methods are based on the piecewise continuous constraint
and coherence constraint. T hese algorithms realize the global optimal matching by minimizing the energy function through
different ways, such as, dynamic programming (B irchfield and T omasi, 1999), belief propagation (K laus et al., 2006), and graph
cut (Hong and C hen, 2004; K olmogorov and Z abih, 2001),
MicMac (Pierrot-D eseilligny and Paparoditis, 2006) . Some semi-global methods also exist, such as semi-semi-global matching (S GM)
(Hirschmüller, 2005; Hirschmüller, 2008) and matching cost
with a convolutional neural network (Žbontar and L eC un, 2015),
which mini mize the energy function through the cost aggregation of multi-directions. T he common features of global and semi-global methods are their adoption of various constraints in the
procedure of cost matrix calculation and their usually time- or
memory-consuming mini mization of the energy function ( e.g., graph cut based method and SGM, respectively) . T hus, these
methods are not capable of directly operating on large i mages, unless supplemented with additional procedures, such as
partitioning, which leads to other problems, and cannot be used in practical surveying and mapping production.
In particular, most of the existing approaches (1) depend on the
geometric information of photography, especially, epipolar geometric information, ( 2) may be influenced when the camera
has severe distortion, and (3) cannot automaticall y adapt to the variances in sensor types ( from frame to line array) and imaging
types ( from optical to radar images) .
In this paper, we introduce a method based on two steps of expansion and inspired by the seed-and-grow method (A dams
and B ischof, 1994; Sharma et al., 2011; W ang et al., 2013; Y in et al., 2014) . It determines the corresponding information on all
the feature points of an image through two steps of expansion over a small number of seed and feature points. It also exhibits
good performance over the area of disparity discontinuities.
Given the idea of expansion, our method can easily deal with two frames without epipolar constraints. In other words, our method
does not need exterior and interior parameters of images, which in turn makes our method operate smoothly on frame aerial, line
array, synthetic aperture radar, and natural scene images (Haala,
2013; C avegn et al., 2014; S harma et al., 2014). Our method also guarantees fast calculation speed.
2. F O R M UL A T I O N
In this section, we describe the proposed integrated approach step
by step and explain why we choose the Harris corner detector (A zad et al., 2009) as the feature extraction method, scale
invariant feature transform (S IF T ) matching (L owe, 1999; L owe, 2004) as the seed points matching method and normalized
cross-correlation (NC C ) ( T sai and L in, 2003) as the matching cost used in the expansion step of our approach.
F igure 1 illustrates the workflow of our two steps of expansion (T S E ) method somewhat similar to patch-based multi-view
stereo (PMV S ) (F urukawa and Ponce, 2010) . F irst, the seed points are extracted from separately extracted features of the base
and the matching image using the feature matching method (e.g., S IF T matching) and are then used to estimate the location and
size of the pre-matching patch (i.e., the first and the second step of expansion) . F inally, the traditional correlation-based method
is used to obtain the final refined matching.
F igure 1. Pipeline of the proposed method
2.1 E xtr action of S eed and F eatur e P oints
S eed points are used to estimate the initial location and parallax search range of the possible matches. A lthough our method does
not rely on the location accuracy of seed points ( which is explained later), we still need to find a robust approach that can
easily handle changes in illumination, rotation, zoom, and other such conditions. F urthermore, the efficiency of the approach is
also required, which is important in considering the overall computing efficiency of our method. Only a small number of
seed points are needed, so that the feature matching method is the first choice.
T he feature points, whose parallax needs to be determined, are
extracted only from the base image. T he Harris corner detector is
a suitable choice for calculating feature points, given its capacity to extract feature points from windows of various sizes (e.g., 3×3,
5×5, and 9×9), which is important because the final dense matching result is a subset of the feature points. In other words,
the more the feature points, the denser the final matching result.
Many popular and excellent feature matching methods are available, including S IF T matching, gradient location-orientation
histogram matching ( Mikolajczyk and S chmid, 2005), and speeded up robust feature matching (B ay et al., 2008), to name a
few. S IF T (1) is invariant to rotation, scale changes, and affine transformations, (2) has good performance in handling occlusion
and complex backgrounds, and (3) has near real-time performance (J uan and Gwun, 2009) . T hus, this method is used
to find seed points to ensure robustness in dealing with various types of images.
In this part, S IF T matching is used to obtain the initial matching
points, that is, the seed points (i.e., the triangle shown in F igure
2, marked as ), which form the seed point setand the initial known-point set ( i.e., the square shown in F igure 2, marked as
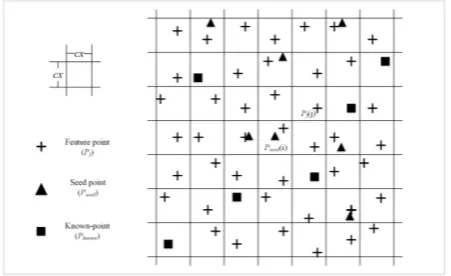
). T he feature points are extracted from the base i mage
using the Harris corner detector at certain intervals ( ), and they form the feature point set that needs to be matched (i.e., the cross
shown in F igure 2, marked as ). T he number of seed points
must exceed a given threshold (empirically set to 10 in our experiments); otherwise, our method may fail. T he seed points
should homogeneously distributed on the base image, otherwise the expansion speed will be affected.
F igure 2. E xample of the possible distribution of the feature, seed, and known points on an image. denotes the size of the Harris
feature extracting window.
2.2 T he F ir st S tep of E xpansion
T he first step of expansion is designed to find all the around
the in the known-point set. T he expansion can be defined as in the dilation of morphology:
(
)
[
D X x B x x
X B
=
=
(1)
where x = the in the first step of expansion or the
in the second step of expansion and belongs to X
= denotes the operation of the growth of eight
neighbours
( )= refers to the found in the first step of
expansion or the found in the second step of expansion
T aking () (F igure 3) as an example, this procedure can be
described as follows:
A ssuming that this is the first time to take the first step of
expansion on (), then, along the expansion route no. 1, we
can find seven feature points that need to be matched, including () and (1), (2), (3), (4), (5), (6) .T he
expansion route no. 2 must be searched when () is processed for the second time, the expansion route no. 3 for the
third time, and so on. T his procedure of a known point is stopped
when (1) the search route encounters the border of a base image or (2) the search route of two neighbor known points run into
each other. Note that the known-point set then changes in every iteration.
F igure 3. F irst step of expansion. T he size of the route indicates a different iteration. F or example, the expansion route no.1 is
used at the first time of iteration, the expansion route no.2 at the second, and so on. T he known point in the figure happens to be a
seed point and is therefore represented by a triangle.
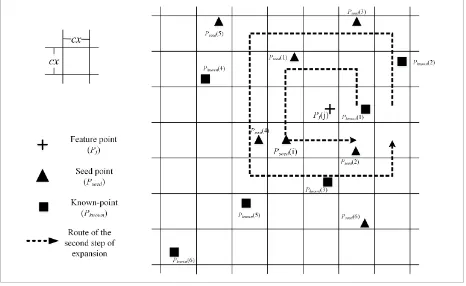
2.3 T he S econd S tep of E xpansion
In the second step of expansion, several known points near the feature point are found and used to calculate the initial location
and size of the possible matching area of the feature point through “means of power of distance,” which can be defined as follows:
(
)
match point of on the matching image
( , ,′ , )= an element of Q
specificall y, the coordinate of a matching point pair (on the base and matching i mages)
A n example on () is given (as shown in F igure 4) to further
explain the second step of expansion. W e can find eleven known
points along the expansion route shown in F igure 4, by the bounding rectangle of the coordinate of the matching point
pair in Q. T his procedure accounts for the relationships between
the feature and known points and therefore enhances the robustness of the matching. N should exceed a particular threshold, which is empirically set to 10 in our experiments.
F igure 4. S econd step of expansion
2.4 R efine M atching
A fter the second step of expansion, we obtain the initial match
that is refined in this step. W e use the correlation-based local method to refine the match. A very signi ficant reason behind this
choice is the computational efficiency of local methods. W e choose NC C as our matching cost because it (1) compensates for
the differences of pixels ( in the window) in gain and bias, (2) considers intensity changes, and (3) is statistically optimal in
compensating for Gaussian noise (E inecke and E ggert, 2010), although it is not robust in the area of low or repeated texture.
Pyramid matching is adopted in this procedure, which works as
follows: F irst, the pyramid i mages of the base and matching images are built around the center of the initial match. Next,
intensity correlation matching is then conducted from the top to
the bottom of the pyramid image. F inally, the refined match on the origin layer of the base and matching images is found. In other words, we obtain the best match point (Qf (j)) of Pf (j) and the correlation coefficient (Cf (j) ), which is used to evaluate the match.
A fter every iteration of Pknown we conduct a statistical analysis of the correlation coefficient that is grouped by the known point. If
the percentage of the matched feature points (i.e., those found around a known point) whose correlation coefficient is below a
given threshold (T hresh_ C , commonl y set to 0.8) is greater than a given threshold ( Thresh_ P), then the known point is considered
to be unreliable and should be removed from the known-point set. T his process reduces the reliance on the accuracy of seed points
but improves the robustness of our method.
If a known point is considered to be unreliable, the group of
known points found in the last iteration is below a certain threshold ( Thresh_ N).
W hen the main matching process ends, the density analysis method (Z hu et al., 2015) is used to eliminate large outliers, after
which the final matching results are obtained.
T he choice of the method mainl y depends on the application. In other words, other methods can be used to find seed points (e.g.,
correlation based method on thumbnails of base and matching image), as well as other matching costs in the procedure of
refining the matching.
3. E V A L UA T I ON
T o evaluate the proposed approach, five types of i mages are used in our experiments. T he experimental results of our proposed
method are given, after a brief introduction of the images used in our experiments. T he size of the Harris feature extractor window
is set to 3 × 3 to make the matching results as dense as possible. A ll the experiments are conducted on a portable computer with
Intel C ore i3-3110M C PU and 2.4GHz. A nd we empiricall y set the T hresh_ C to 0.8, T hresh_ P to 60%, and Thresh_ N to 100.
3.1 D escr iption of the T est I mages
W e use two pairs of aerial frame images from V aihigen and S an F rancisco; one pair of images captured by A D S 40; one pair of
satellite images by GeoE ye-1; one pair of single-polarization S A R images; and test images ( specificall y, teddy, cones, and
venus) from the Middlebury benchmark ( S charstein and S zeliski, 2002) . T he details of the frame images are shown in T able 1.
D escriptions/
S tereo Pair
S tereo Pair 1 S tereo Pair 2
L ocation S an F rancisco (US A )
V aihigen (Germany)
C amera UltraC am D D MC
Image size(pixel)
11,500 × 7500 7680 × 13,824
S ide and F orward Overlap
30/60% 60/60%
GS D 15 cm 8 cm
D escription of the image area
D ensely-distributed
buildings
S mall-sized and detached buildings
surrounded with many trees
T able 1. Overview of the two pairs of frame i mages
T he first pair of line array images is cut from the nadir and backward strip of the airborne A D S40, which is a common line
array camera. T he pair of images is captured from suburban areas. T he second pair of line array i mages is cut from a panchromatic
image of GeoE ye-1. Many low-rise buildings are present in the second pair of images.
T he S A R image pair is a same-side stereo pair, with a GS D of 0.5
m, and a central angle of incidence of 45°. T he image area of this pair is a hilly area, and a small town exists in the area.
3.2 R esults
3.2.1 F r ame I mage: T he two pairs of i mages both have
accurate exterior and interior parameters, and the stereo pair from V aihigen (as short as S 2) has L iD A R points. T he dense 3D point
cloud of the stereo pair from S an F rancisco (as short as S1) is generated using S GM. T he result of S GM is down-sampled to a
3 ×3 pixel. Our results are also transformed to the object space coordinate system through forward intersection.
T o compare the result of S 1 with S GM and the result of S 2 with L iD A R , checkpoints are selected randomly, and differences in
elevation with the corresponding points in the S GM results ( S1) or L iD A R ( S 2) of the check points are used as the assessment
index.
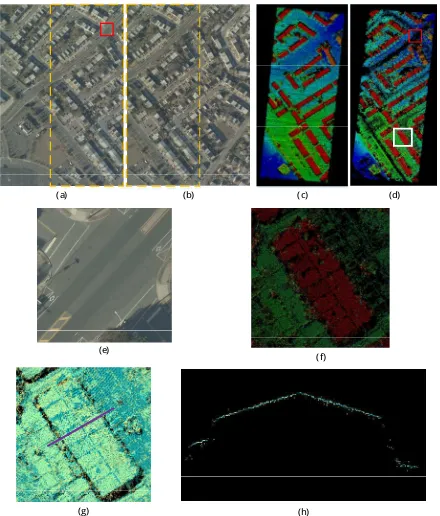
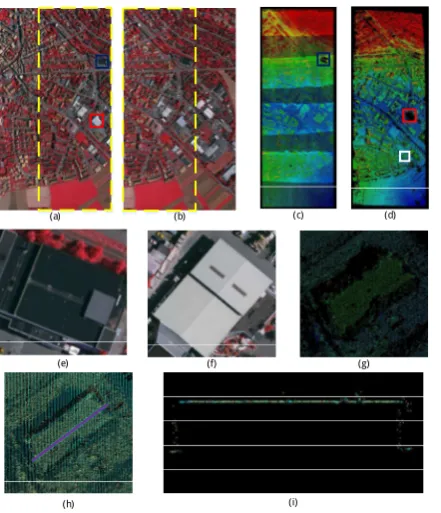
F igure 5 shows the result of S 1, and F igure 6 shows the result of S 2. Given that NC C is used to refine the match, our method fails
or results in a blur in low-texture ( as shown in F igure 5(e)), and repeated texture areas ( as shown in F igure 6(f)). A ccording to the
profile, our result has a similar precision with S GM. T he density of the point cloud obtained with our method is dramatically
higher than that of L iD A R and at the same time has a near precision. S imilar to the other matching methods, our method can
obtain matching results on walls, which is difficult for L iD A R .
( a) (b) ( c) (d)
(e)
(f)
(g) (h)
F igure 5. Matching result of S 1 and comparison with S GM,
where (a) and ( b) are the base and matching images of the stereo pair, respectively, and the areas within the dashed boxes
represent the overlapping of the image pair; ( c) is the result of S GM ( coloring by elevation of the point, the higher the redder,
otherwise, the lower the more blue); (d) is the result of our method ( the coloring is the same as (c)); (e) is the enlarged view
of the area in the red rectangle of (a) and is also the base image
of the unmatched area in the red rectangle of (d) ; ( f) is the enlarged view of the area in the white rectangle of (d) ; ( g) is the enlarged view of the same area of (f), but the S GM result ( the
blue point) and our result (yellow point) are put together; (h) is a
profile of the purple line in (g) .
T he statistical results of the elevation differences of the check points are given in T able 2. T he maximum absolute elevation
difference of S 1 and S 2 are 9.5 and 10.3m, respectively. T he percentages of the points whose absolute value of elevation
difference is less than 0.5m in our results are more than 93% (95% in S1 and 93.5% in S2). Mismatching appears on (1) the roof of
a building, which generally has a repeated texture, (2) the surface of the road, on which little information exists, and (3) the area
with amorphous trees. T able 3 shows the matching ti me of S 1 using S GM and our method. Our method has a similar accuracy
with S GM, costs less ti me than S GM, and is specifically 4.2 times
faster than S GM. However, our result is not a pixel by pixel result.
( a) ( b) ( c) ( d)
(e) (f) ( g)
( h) ( i)
F igure 6. Matching result of S 2 and comparison with L iD A R ,
where (a) and ( b) are the base and matching images of the stereo
pair, respectively, and the areas within the dashed boxes represent the overlapping of the image pair; ( c) is the point cloud
of L iD A R (the coloring is the same as that in F igure 5( c)) ; (d) is the result of our method (the coloring is the same as that in F igure
5(c)); (e) is the enlarged view of the area in the blue rectangle of (a), which has no L iD A R point ( as shown in the blue rectangle in
(c)); (f) is the enlarged view of the area in the red rectangle of (a) and is also the base image of the unmatched area in the red
rectangle of (d); (g) is the enlarged view of the area in the white rectangle of (d) ; (h) is the enlarged view of the same area of ( g),
but the L iD A R point (the blue point) and our result (yellow point) are put together; (i) is a profile of the purple line in ( h). (Note:
T he L iD A R is captured in strip, so that a strip change is evident in ( c)) .
S tereo pair S 1 S 2
Number of matching point 2,329,580 3,681,388
Number of check point 1,165,524 2,046,240
A bsolute value of
the elevation difference ( m)
[0, 0.5) 1,107,247 1,913,629
[0.5,2) 36,154 71,853
[2, ∞ ) 22,123 60,758
T able 2. S tatistic results of elevation difference of the frame images.
T ime/Method Our Method S GM
Processing T i me ( s) 242.699 1,267.985
T able 3. T he processing time of S 1 (Note: the time of S GM including the time of generating epipolar image)
3.2.2 L ine A r r ay I mage: E very single line of the line array
image has different exterior parameters, which means it is troublesome for algorithms using epipolar constraints to match.
T wo pairs of line array images are used to test the ability of our method to match this type of image. T he base i mage of the first
pair is cut from the nadir strip image, and the matching image is cut from the backward strip image. T he second pair is cut from a
GeoS tereo product of GeoE ye-1. T o visualize our results, we use
the parallax as the Z value and the coordinate on base image as the X and Y values to form a point cloud. T he color change
indicates a parallax change. A s shown in F igure 7(c), the points of the buildings are red, which means these points have a large
parallax. B y contrast, the points in flat areas are almost blue, which means these points have a small parallax. Information on
the local details, specificall y, the buildings, is lost in our results because low-rise buildings have a very small parallax change on
the satellite image. However, our result evidently represents the terrain correctly. In other words, our method is capable of
matching line array images.
(a) ( b) ( c)
(d)
( d)
(e) ( f) ( g) ( h)
F igure 7. Matching result of the line array image, where ( a) and (b) are the base and matching images of the stereo pair from
A D S40; (c) is the result of ( a) and ( b) (coloring by parallax, red represents a large parallax, and blue represents a small parallax);
(d) is the enlarged view of the area in the white rectangle of ( c) shown in 3D ; (e) and ( f) are the base and matching images of the
stereo pair from GeoE ye-1; (g) is the result of (e) and (f) (the
coloring is the same as ( c)); (h) is the enlarged view of the area in the white rectangle of (g) shown in 3D .
3.2.3 S A R I mage: T he imaging apparatuses of S A R differ
from those of an optical i mage. R epeated texture appears frequently on S A R images (as shown in F igure 8(d) ). T he scale
of a S A R image changes along with the distance between the target and the nadir point of the sensor. In other words, the size
and the shape of an object differ on stereo (which can be shown by the different sizes of the dashed box in F igures 8(a) and (b)),
and the corresponding informati on is therefore difficult to be found. F igure 8(c) shows the parallax changes from left to right,
which are correct according to the imaging apparatuses of S A R .
F igure 8. Matching result of S 2 and comparison with L iD A R ,
where (a) and ( b) are the base and matching images of the stereo pair, respectively, and the areas within the dashed boxes
represent the overlapping of the image pair; (c) the result of our
method (coloring by parallax, red represents a large parallax, and blue represents a small parallax) ; ( d) is the enlarged view of the
area in the red rectangle of ( a) and is also the base image of the
unmatched area in the red rectangle of (c); ( e) is the enlarged view of the area in the white rectangle of (c), but the coloring is
by the grey value of the base image.
3.2.4 Natur al S cene I mage: W e also test our method on the Middlebury benchmark. T o ensure the matching robustness, we
use the Harris feature point as the feature point, which unfortunately is incapable of pixel-by-pixel extraction. In other
words, our method cannot generate a dense depth map. T he statistic for the depth differences of our matching point with the
ground truth is used to evaluate our results, although it is not calculated pixel by pixel. T he details are given in T able 4.
W e set a high threshold of correlation coefficient to ensure the
accuracy of our method. T he percentages of the wrong match in our results are less than 20%. T he mismatch generall y appears in
the area of the repeated texture. C onsidering the processing time
of our method, our results can be used to provide initial depth this paper. In this method, matching results of the feature-based
method are used as seed points and as the initial known-point set.
T he first step of expansion is conducted on the known-point set iteratively to find the feature points. T he second step of expansion is conducted on the feature points found in the first
step of expansion, and the initial match area is found after two
steps of expansion. F inally, the result is refined using the correlation-based method. T his method needs no prior
information, especially the geometric information of an image, which makes this method applicable to various types of images.
T he result of this method has high accuracy and can be used as the final dense matching result to some extent or the initial value
for other dense matching methods that aim to generate pixel-by-pixel point cloud. Moreover, this method saves time.
However, the proposed method is not capable of dealing with
large areas of low or repeated texture because of the matching cost we used in the refined matching step, NC C , is not robust
enough in handling these ambiguous areas. T his method also fails when no seed point is available. T he following issues need to be
explored in future works:
1) A matching cost that is robust in large ambiguous areas of low or repeated texture
2) More robust and efficient model used in estimating the initial location and size of possible matching areas, which can address
large distortions and uneven distribution of seed points
3) More efficient filtering algorithm for generating more accurate results
A C K NO W L E D G E M E NT S
T he authors would like to thank the anonymous reviewers and
members of the editorial team, for their comments and contributions, which have significantly improved this paper.
R E F E R E NC E
A dams, R . and B ischof, L ., 1994. S eeded region growing. IE E E
T ransactions on Pattern Analysis and Machine Intelligence, 16(6), pp. 641-647.
A zad, P., A sfour, T . and D illmann, R .U.D ., 2009. C ombining
Harris interest points and the SIF T descriptor for fast scale-invariant object recognition. In: IE E E C omputer Society
C onference on Intelligent Robots and Systems (IROS),S t. L ouis, MO, US A . IE E E , pp. 4275-4280.
B ay, H., E ss, A ., T uytelaars, T . and V an Gool, L ., 2008. Speeded-up robust features (S UR F ) . C omputer V ision and Image Understanding, 110(3), pp. 346-359.
B irchfield, S . and T omasi, C ., 1999. D epth discontinuities by
pixel-to-pixel stereo. International J ournal of C omputer V ision,
35(3), pp. 269-293.
C avegn, S ., Haala, N., Nebiker, S ., R othermel, M., and T utzauer, P., 2014. B enchmarking high density image matching for oblique
airborne imagery. T he International Archives of P hotogrammetry, Remote Sensing and Spatial Information Sciences, 40(3) , pp. 45.
E inecke, N. and E ggert, J ., 2010. A two-stage correlation method
for stereoscopic depth estimation. In: IE E E C omputer Society C onference on D igital Image C omputing: T echniques and
Applications (D IC T A), S ydney, A ustralia. IE E E , pp. 227-234.
F urukawa, Y . and Ponce, J ., 2010. A ccurate, dense and robust multiview stereopsis. IE E E T ransactions on Pattern Analysis
and Machine Intelligence, 32(8) , pp. 1362–1376.
Haala, N., 2013. T he landscape of dense image matching algorithms. Photogrammetric Week ‘ 13 (E d. D .F ritsch),
W ichmann, B erlin/Offenbach, Germany. pp. 271–284.
Hirschmüller, H., 2005. A ccurate and efficient stereo processing by semi-global matching and mutual information. In: IE E E
C omputer Society C onference on C omputer V ision and Pattern
Recognition (C V PR), S an D iego, C A , US A . IE E E , pp. 807-814.
Hirschmüller, H., 2008. S tereo processing by semi global
matching and mutual information. IE E E T ransactions on Pattern
Analysis and Machine Intelligence, 30(2), pp. 328-341.
Hong, L . and C hen, G., 2004. Segment-based stereo matching using graph cuts. In: IE E E C omputer Society C onference on C omputer V ision and Pattern Recognition (C V PR), W ashington,
D C , US A . IE E E , pp. I-74.
J uan, L . and Gwun, O., 2009. A comparison of sift, pca-sift and
surf. International J ournal of Image Processing (IJ IP), 3(4) , pp. 143-152.
K laus, A ., S ormann, M. and K arner, K ., 2006. S egment-based stereo matching using belief propagation and a self-adapting
dissimilarity measure. In: IE E E International C onference on
Pattern Recognition (IC P R), Hong K ong, C hina. IE E E , pp. 15-18.
K olmogorov, V . and Z abih, R ., 2001. C omputing visual
correspondence with occlusions using graph cuts. In: IE E E International C onference on C omputer V ision (IC C V ),
V ancouver, C anada. IE E E pp. 508-515.
L owe, D .G., 1999. Object recognition from local scale-invariant features. In: IE E E International C onference on C omputer V ision
(IC C V ) , K erkyra, Greece. IE E E , pp. 1150-1157.
L owe, D .G., 2004. D istinctive image features from scale-invariant key points. International J ournal of C omputer V ision,
60(2), pp. 91-110.
Mikolajczyk, K . and S chmid, C ., 2005. A performance evaluation of local descriptors. IE E E T ransactions on Pattern
Analysis and Machine Intelligence, 27(10) , pp. 1615-1630.
Pierrot-D eseilligny, M., and Paparoditis, N., 2006. A multiresolution and optimization-based image matching
approach: A n application to surface reconstruction from S POT 5-HR S stereo imagery. Archives of Photogrammetry, Remote
Sensing and Spatial Information Sciences, 36(1/W 41).
R emondino, F ., S pera, M. G., Nocerino, E ., Menna, F ., and Nex,
F ., 2014. S tate of the art in high density image matching. T he Photogrammetric Record, 29(146), pp. 144-166.
S charstein, D . and S zeliski, R ., 2002. A taxonomy and evaluation
of dense two-frame stereo correspondence algorithms. International J ournal of C omputer V ision, 47(1-3), pp. 7-42.
S harma, A ., Horaud, R ., C ech, J . and B oyer, E ., 2011.
T opologically-robust 3D shape matching based on diffusion geometry and seed growing. In: IE E E C omputer Society
C onference on C omputer V ision and Pattern Recognition (C V P R), C olorado Springs, C O, US A . IE E E , pp. 2481-2488.
T sai, D . and L in, C ., 2003. F ast normalized cross correlation for
defect detection. Pattern Recognition L etters, 24(15), pp. 2625-2631.
W ang, G., Y in, X ., Pei, X ., and Shi, C ., 2013. D epth estimation
for speckle projection system using progressive reliable points growing matching. Applied optics, 52(3) , pp. 516-524.
Y in, X ., W ang, G., S hi, C ., and L iao, Q., 2014. E fficient active depth sensing by laser speckle projection system. Optical E ngineering, 53( 1), pp. 013105-013105.
Žbontar, J . and L eC un, Y ., 2015. C omputing the stereo matching
cost with a convolutional neural network. In: IE E E C omputer
Society C onference on C omputer V ision and P attern Recognition (C V PR), B oston, MA , US A . IE E E , pp. 1592-1599.
Z hu, J ., Hu X ., Z hang, Z ., , X iong, X ., 2015. Hierarchical
outlier detecion for point cloud data using a D ensity A nalysis
Method. Acta Geodaetica et C artographica Sinica, 44( 3) , pp.
282-291.