Developing Statistical Thinking in a Secondary School: A Collaborative
Curriculum Development
Maxine Pfannkuch
Julia Horring
The University of Auckland
Auckland Girls’ Grammar School
New Zealand
New Zealand
Abstract
This paper describes the first year of a three-year collaborative curriculum development project in a secondary school that is underpinned by a theoretical statistical thinking framework. The teachers developed and implemented the statistics unit for their Year 11 classes (15 year-olds) based on their understanding of the framework and within the constraints of the national curriculum and assessment. Data gathered on the development of the statistics unit and its subsequent implementation are presented and discussed. An initial finding was that teachers were able to begin changing their practice to foster students’ statistical thinking in ways consonant with the framework. The influences of the framework, identifying problematic situations, collaboration, and assessment, which are impinging on the curriculum development, are elaborated upon and questions are raised about the nature of the development.
Background to the Curriculum Development
The impetus for promoting the development of statistical thinking started in the early 1990s among particular people in the American Statistical Association (AMA) (Moore, 1990) and the quality management field (Snee, 1999). Within statistics education research, statistical thinking is only just beginning to be addressed (Ben-Zvi & Garfield, 2004). Wild & Pfannkuch (1999) attempted to characterize statistical thinking in empirical enquiry in a four-dimensional framework. This framework was built from literature on history, quality management, psychology, epidemiology, and statistics education, as well as from interviews with statisticians and statistics undergraduate students. Wild & Pfannkuch (1999) conceptualize statistical thinking in relation to four dimensions: an investigative cycle, types of thinking, an interrogative cycle, and dispositions (see Appendix). These four dimensions operate simultaneously within the thinker and subsume various generic and specific statistical thinking habits.
When considering the framework and these features of statistical thinking many questions arise for learning, teaching, and the curriculum such as: What constitutes statistical instruction that is consonant with the framework? How can students’ statistical thinking be most effectively developed? How are the various generic and statistical thinking habits manifested in secondary students? Are there particular ways of teaching that can elicit the specific types of thinking identified in the framework? How are such habits of thinking communicated in curriculum development?
In this paper our discussion of curriculum focuses on these thinking habits, particularly those types of thinking described in the framework. As Wild & Pfannkuch (1999) explain, the five types of thinking identified as fundamental elements in statistical thinking are recognition of the need for data, transnumeration, consideration of variation, reasoning with statistical models, and integrating the statistical with the contextual. The purpose of the framework was to characterize statistical thinking and therefore it is not developmental or hierarchical. Rather it presents a goal for the desired types of thinking that should be developed.
and learning situations. The long-term aim is to gradually construct a theoretical basis for developing students’ statistical thinking via instruction.
Curriculum Development Process
The curriculum development process is based on the ideas of Gravemeijer (1998), Wittmann (1998), and Skovsmose and Borba (2000). Curriculum in this context means “all planned activity for the classroom” (Begg, 2002). As such, curriculum development necessitates professional development and resource development. In the professional development model employed in the project, teachers participate actively in the change process from inception to implementation. This is a method of curriculum development where teachers must become fully conversant with the theory to participate in the research process.
Because the development of statistical thinking is about making changes and transformations in the classroom based on an evolutionary notion of development in a living system (Wittmann, 1998), the process is planned as a three year action-research project. Teachers are central to the process, which draws on their experience and “wisdom of practice” (Clarke, 1994; Clarke, Clarke, & Sullivan, 1996). This collaborative process of curriculum development may be viewed as a learning system in which all participants are learners and where there is a constant dialogue amongst the participants (Begg, 2002). Teachers act as curriculum developers who take the framework as a guide and interpret it through their understandings, reflections, and practice. The statistical thinking framework is concretized by the teachers in their instruction, and conversely the framework is used by the teachers and researcher to analyze their instruction.
Teachers’ participation in the curriculum development activity involves identifying problematic situations, envisioning how the current situation might be changed, theorizing and anticipating possible student learning trajectories, and exploring alternatives for creating the improved situations they envision (Skovsmose & Borba, 2000). The situations they envision guide the development of teaching units. To move from the current situation to the envisioned situation teachers must implement a teaching unit. Upon implementation the “arranged situation” that results serves as a context for observations and experiences, and gives rise to critical reflections regarding the teaching and learning process. This process is similar to a theory-guided bricolage as described by Gravemeijer (1998) except that the teachers develop the instructional activities rather than the researcher.
Therefore the approach taken by the researcher is, first, to understand and evaluate the development of statistical thinking in the current situation with respect to teaching, learning, and assessment. Secondly, the researcher collaborates with teachers in designing and trialing a teaching unit intended to enhance students’ statistical thinking. Thirdly, the researcher evaluates the process of implementation with respect to teaching, learning, and assessment. Finally, the researcher takes the knowledge gained through the curriculum development activity to ultimately abstract a theoretical base for the development of statistical thinking in instruction.
Since the curriculum development research is conducted within a real course there are constraints on its implementation such as teaching time, availability of resources, and the fact that the students are working towards a national qualification. The constraints imposed by the national curriculum and assessment requirements are presented below.
National Curriculum and Assessment Requirements
one final external examination in mathematics, three components of the course, including statistics, are internally assessed with external moderation. The other six components, including probability, are externally examined (New Zealand Qualifications Authority, 2001). Achievement in each of the nine components of mathematics is reported separately on the national qualification certificate.
For the statistics assessment the students are given data sets to investigate with the emphasis on comparing data and understanding bivariate relationships. The level of statistical thinking required at Year 11 with this new internal assessment, compared to the previous external assessment which largely asked students to read and interpret graphs and calculate measures of central tendency, has placed higher demands on teachers and students. The students are given two assessment tasks, which can be designed by the school. In the first task data sets are given from which students are expected to generate a question, conduct a statistical analysis, draw a conclusion, justify that conclusion with at least three statements, and evaluate the entire statistical process. In the second task they are given questions and a statistical analysis, which they are required to interpret and demonstrate that they are able to draw a justified conclusion. These tasks are moderated at the national level.
The Curriculum Project
In the selected school teachers were interested in mathematics education issues and in improving statistics teaching in their classes. Teachers agreed to take part in the research since it was long-term, and they believed they would benefit from its implementation, especially since the assessment requirements had changed. It was important to these teachers to be in control of their curriculum and to determine the learning experiences for their students. Such an exploratory research approach versus a researcher-designed activities approach would not only allow teachers to build up their own coherent picture of student learning but would also allow the researcher to build a working relationship with the teachers and an understanding of the realities of their classrooms.
The research site is a single sex girls’ school that has a low socio-economic ranking and is culturally diverse in terms of students and teachers. The mathematics teachers in the school selected the year level, Year 11 (15-year-olds), and the case study teacher — a potential teacher leader — was self-selected. The Year 11 students did not have access to any technology apart from a basic calculator.
The preliminary stage of the research involved a negotiation process with the teachers in the school which determined that the first author — the researcher — could evaluate the current statistics unit taught by having access to the statistics teaching resource material and assessment unit that were used in 2002.
Armed with this knowledge and conversations with the teacher in charge — the case-study teacher — a workshop was developed for teachers that addressed and challenged some of the broad tenets of their curriculum design with the focus on communicating the nature of statistical thinking. Research informed all of the activities in the workshop, and included a data set, which all teachers had used with their students. Observations of what occurred in the workshop were written up. The case-study teacher and another teacher were interviewed about students’ current learning of the statistics unit at the end of November 2002. These interviews were audio-taped and transcribed. The researcher then discussed ideas with these two teachers on the development and design of the statistics teaching unit. These teachers then wrote the unit. The unit was not prescriptive. Several suggestions were always given for resources that could be used, but teachers were free to find and create their own resources.
lesson. The case-study teacher was formally interviewed for about half an hour at the end of each week about her reactions and reflections on the teaching of the unit. These interviews were audio-taped.
At the end of the teaching unit there was a one-hour debriefing session with the seven Year 11 mathematics teachers on their reactions and reflections on their teaching and their students’ learning of the statistics unit. This session was videotaped. The case-study teacher’s observations and reflections as well as her perusal of the student questionnaires led her to conjecture possible problematic areas. As a result, she requested that the student assessment data, particularly the conclusions drawn and the evaluations of the statistical process, be focused upon in the first analysis of the data. After these data and other related data were analyzed, problematic areas were identified which led to the formation of a consultation group of five statisticians who participated in debates and discussions of possible ways to proceed. In November 2003 the researcher presented her findings on the development of Year 11 students’ statistical thinking to the teachers and ran a workshop on ways to further develop their thinking. Finally, the Year 11 mathematics teachers worked on refining and designing teaching and learning activities for statistics teaching in 2004. This cycle of activities is scheduled to repeat in 2004 and 2005.
Except for the student assessment data, the data were analyzed qualitatively using the Wild and Pfannkuch (1999) statistical thinking framework to find evidence of statistical thinking. The method used was to categorize the initial interview data according to elements of the framework and then reflect upon this analysis. In consultation with the teachers, it was determined which elements of the framework would be focused upon in the 2003 statistics teaching unit. The next analysis used data from video-tapes, audio-tapes, students’ books and questionnaires. These data have been initially analyzed for evidence of the investigative cycle dimension of the framework.
The student assessment data on drawing conclusions and evaluation of the statistical process were analyzed using the SOLO taxonomy (Biggs & Collis, 1982) for ascertaining the quality of the responses. A spreadsheet was used to classify the responses into categories and then the responses in each category were classified into the hierarchical levels of pre-structural, unistructural, multistructual, and relational. Qualitative descriptors for each category and each level within a category were written by the researcher and then another independent person coded each of the responses. Consensus was reached between the researcher and the independent rater on the final codes for each student response.
Research Questions
This paper will illustrate how a statistics curriculum is being developed using a theoretical framework for statistical thinking and a developmental research method involving collaboration amongst teachers, students, a researcher, and statisticians. Since the theoretical framework has four dimensions with many components, curriculum development is explained using only one dimension of the framework, namely the investigative cycle, with the comparison of box plots being a specific example. These examples demonstrate how the following general research questions are being addressed:
• What are the problematic areas in the 2002 curriculum?
• What changes in teaching approaches were evident during the implementation of the 2003 unit? • What are the problematic areas in the 2003 curriculum?
• Why are these problematic areas?
• How should these problematic areas be resolved for the 2004 curriculum?
Results
Problematic Areas in the 2002 Curriculum
A fuller analysis of the teachers’ interviews using the framework to identify current main barriers in teaching to fostering students’ statistical thinking has been reported (Pfannkuch & Wild, 2003). The main barrier identified within the investigative cycle was a lack of presenting a coherent empirical enquiry. The assessment required students to pose a question of given data, to analyze the data, and to draw conclusions, albeit with question prompts throughout the process. The students tended to address each question in isolation and failed to link the stages of the enquiry cycle together.
The biggest failing, maybe, was that they would forget to go back to the very beginning of the question and remember what they were doing. They just, kind of, looked at the data and just talked about the data instead of going back to the question. (BT)
You know, each of the component parts seems to be quite straight forward, but then when you try and paint a big picture or get them to do the whole process it’s hard so [that] they can’t [do it]. (ET)
They attributed this situation partly to the way in which they taught.
Well I taught each part lesson by lesson. I think if we had an ongoing investigation that might actually show them that it is all connected — every bit is connected with the other bit — rather than just fragments … (BT)
If it’s always taught in isolation then it’s no wonder the students never link it to making decisions about data and the question that you are trying to answer … We did chunk it [the unit] up into little bite size pieces rather than really thinking about the whole overall process. (ET)
One particular component of the cycle focused on the posing of questions. When students were given data, teachers tended to pose narrowly framed statistical questions according to a template (D).
This idea of posing a question, it is hard … We have a particular understanding of the word question, like, we know when we are doing stats topics and we are talking about a particular type of question. Maybe students haven’t yet formed that understanding of what a question is — how you can ask a question in a set of data. (ET)
Furthermore, they often used univariate or bivariate datasets rather than multivariate datasets (D, O).
The teaching implications for fostering students’ statistical thinking were the provision of a learning approach that interconnected the components of the investigative cycle and the provision of a multivariate data environment for students to operate in with one aim being for them to understand how different types of statistical questions could be posed.
Changes in Teaching Approaches Evident During the Implementation of the 2003 Unit
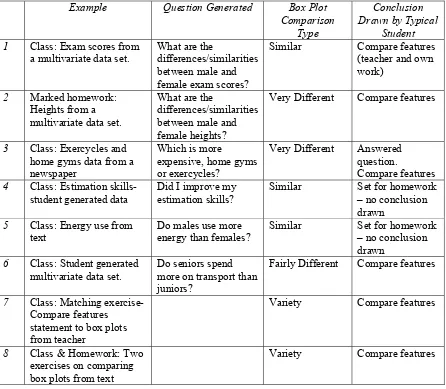
Two changes in teaching approaches were that parts of the investigative cycle were not taught in isolation but kept together as a connected process and multivariate data sets were used. For example, in teaching there were eight opportunities for students to compare data where a box plot would be an appropriate analytical tool (CV, SB). Six of these opportunities involved posing a question, analyzing the data, and drawing a conclusion. Three of these opportunities involved multivariate data sets (Table 1). Multivariate data sets were presented in twelve of the fifteen teaching sessions (CV).
Table 1
Example of learning activities for comparison of box plots taken from a student book
Example Question Generated Box Plot Comparison
Variety Compare features
8 Class & Homework: Two exercises on comparing box plots from text
Variety Compare features
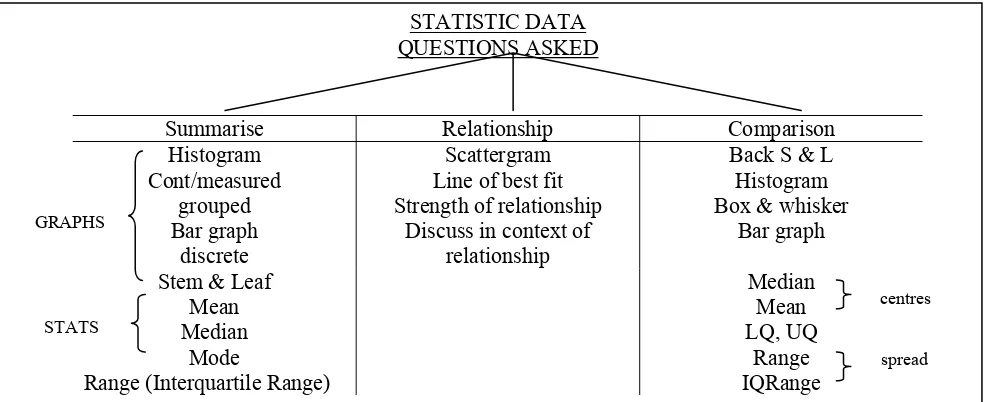
STATISTIC DATA
Conclusions: refer to graphs and statistics. Instructions for students: comment on the shape of graph, the most common values, values of median and mean. Are they similar or different? Are they affected by outliers? Use words like “tend to” for comparisons. Make sure you have answered the motivating question.
Figure 1. Overall Structure Built During Teaching
The student questionnaires also revealed the teaching approach had changed and students were aware that an investigative cycle was operating. Some responses to the question, “Describe the parts in the statistics unit that you found interesting. Explain why you found these parts interesting” were (SQ):
• “Drawing graphs and finding out the answers to the questions that we drew graphs for. Because it was fun and the answers were interesting or not what you would expect.”
• “I did not know that there could be [so] many questions to get out from there as well as the “I wonder…” and “I find…” theory.”
• “Before this year I didn’t really know about the different kinds of questions to pose or what graphs are best for each type.”
• “Learning new things, e.g., if there’s a question, there are many possible solutions to it.”
• “Finding the answers to the questions logically and statistically rather than just getting an opinionated answer.”
• “I think it would be useful to do some kind of investigation in class using the whole process by ourselves.”
Teachers reported that the statistics unit had also changed their approach to teaching, which they regarded as being an uncomfortable learning process (FV).
She went on to explain how she found this data set that she was interested in and posed a question:
Well the thing is, though, because I was far enough on, that when I saw it in the paper that was the first time that I have ever looked at a set of data and thought, “Well gee, I would like to know — I wonder if the forward pack is heavier?” I immediately thought that, and I wouldn’t have done that in the past. … So I’ve got my eye out all the time now for multivariate data that is interesting.
This data set was shared with and used by some of the other teachers in their classes. Their reaction to its implementation was also favorable. Two other teachers’ comments on changes to their teaching approach were:
Personally, I found —I mean I’m a stats teacher, and I found it quite hard to teach. … huge leap from previous — from what it used to be. So, I mean, developing the statistical thinking is happening.
Me, I don’t think I quite conveyed to them the train of thought that we had aimed to convey. … And that was, sort of, lack of confidence with some of the ways of presenting it. I was glad to be presenting it that way, like I could understand why we were doing it, and that was helpful for me, but I didn’t quite get that across …
This lack of confidence in their own knowledge and understanding was borne out by the case study teacher (CA) who reported to the researcher (I) that she spent many hours teaching individual teachers throughout the unit.
CA: Yeah, it’s happening all the time. [Name of teacher] is determined to get her head around the stats. Wants to feel more comfortable with it. She’s asking, you know, probing, doing a lot of stuff with the data herself before she takes it into class. It’s brilliant.….
I: So the teachers are almost learning the statistics before they are going into the classroom? CA: Yeah, it’s very scary. … And so it’s no wonder that they are going in [to class] with a
multivariate table and saying “what questions can we ask on this”, no wonder that’s a scary prospect.
The case-study teacher also reported that one teacher out of the seven involved had been unable to manage the change in teaching approach and together they had adapted the unit to suit her and her class.
The problematic areas identified in 2002 had been addressed in instruction. Students and teachers were more confident with posing questions about a multivariate data set, in the sense of having a dialogue with the data through noticing, wondering, and playing around with the data. The previous practice involved template questions for univariate and bivariate data. The investigative cycle was taught as an entity rather than isolated components. It is also interesting to note that the teachers reported that their teaching of statistics had changed at the Year 9, 10, and 12 levels as a result of these problematic areas being addressed at Year 11.
Problematic Areas in the 2003 Curriculum
Some responses to the question, “Describe the parts in the statistics unit that you found hard to understand” were (SQ):
• “I want statistics to teach us more of how to write out a conclusion.”
• “One thing I found difficult was writing good conclusions for comparing questions.” • “I found it hard to make conclusions with evidence.”
This response is borne out by an analysis of the students’ assessment responses and an analysis of a typical student’s learning opportunities to draw conclusions when comparing two box plots (see Table 1). The student assessment data was analyzed for the quality of their responses for drawing a conclusion and providing evidence for their conclusion. Using the SOLO taxonomy, the responses were categorized into four levels: prestructural, unistructural, multistructural, and relational (Biggs & Collis, 1982). There was also a category for no response. Assuming that attaining a multistructural response is satisfactory, in the first assessment task, 17 out of 30 were able to draw a conclusion whereas only six students were able to give two evidence statements to support their conclusion. For the second task 11 out of 30 drew a satisfactory conclusion while only two of the students provided two satisfactory evidence statements. Such data seemed to support the students’ concern about drawing a conclusion from data with evidence, which is an assessment requirement.
A qualitative analysis of the learning opportunities the teacher provided for drawing an evidence-based conclusion suggested that there were several problematic areas. For example, in comparing box plots, the teacher generated one worked example with the students (Table 1) and compared features of the box plots only. For all other examples the students were expected to generate their own conclusions. Secondly, the teacher’s use of the term conclusion may have been a factor confusing the students. In 14 out of 15 lessons the term conclusion was mentioned. For example (CV):
• “Tell me a conclusion and I’ll write it up.”
• “Any conclusion that you can make — anything that you think is confusing on the graph.” • “Can you make some general conclusions from this graph?”
In essence the term conclusion could have the following interpretations during her teaching: compare features; draw a conclusion from the data; evaluate the graph and think critically about it; justify why your conclusion is supported by the data or graph; note what information you can glean from the graph; other questions you can ask; and “I notice” and “I wonder” (Shaughnessy, 1997) statements. Thus the students did not have an opportunity to develop a sense of what was meant by the term conclusion or how to draw an evidence-based conclusion.
Reasons These are Problematic Areas
The sources of data for these problematic areas are drawn from the teacher feedback session (FV) and from written documentation of the reflections of the researcher and five statisticians (SD).
One reason that drawing and supporting conclusions was problematic may have been the organization of the lesson. In the feedback session (FV) a teacher reflected on why she did not spend time on the conclusion. She said, “Overall I probably spent too much time on posing the question and doing the graphs and maybe not doing the conclusion at the end” to which the case-study teacher replied, “Yeah you tend to lose them. It’s just when you lose them, putting it together.” But the problem seemed deeper than this. One conjecture for the problematic situation of drawing “informal inferences” from comparison of box plots, for example, is that textbooks and teaching assume that the approach to building up students’ conceptual ideas for formal inference, such as significance tests and confidence intervals, is to compare features of the distributions and to not draw a conclusion.
experience in order to understand formal inference at Year 13 or later and to a questioning of the assessment requirements.
A major problem with informal inference was conjectured to be “taking the variability into account relative to the difference in centers” and the “sample size effect” (SD). Questions arose such as, “What exposure have students had to the ideas of variability and sample size?” “Have they taken random samples of various sizes from a population and seen the effect of sample size on variability?” (SD). Another consideration was the need to improve students’ conceptual understanding of box plots by comparing them to other representations, such as putting dot plots beneath box plots, which is a typical statistical practice. If technology is accessible students can experience transition representations, from dot plots to appropriate divisions of data distributions, towards conventional box plots. Questions the students had attempted on their assessment and in class were then considered, and evidence-based conclusions students might draw were written and debated.
Addressing Problematic Areas for the 2004 Curriculum
Articulating the messages contained in graphs and justifying inferences either verbally or in writing with clarity is not easy. Such inferences should start with informal language and gradually transition towards statistical language. Realizing that teachers and students needed support in reasoning from data the idea of a micro-thinking framework to articulate the perceived messages in the data was conceived. This would include the need for data to be discussed and philosophized over as they were being looked at from different perspectives, as well as learning what should be noticed and attended to when looking at graphs. These findings were reported in a workshop for the teachers. They were also given worked examples and a suggested pedagogical framework for drawing evidence-based conclusions, which included proposals for ways that students could experience variation. As an ongoing curriculum development process these findings are currently being debated by the teachers. The debate started during the workshop. The discussion did not reject the idea that Year 11 students should have variation-learning experiences. Rather, it centered around access to technology, what students should experience across the year levels, and when, as they viewed students’ statistics learning as occurring over a five year period. The proposed teaching approaches for drawing a conclusion were debated in terms of Year 11 students’ perceived ability with some of the discussion suggesting modifications. Further discussion and collaboration among the teachers, statisticians, and researcher are envisaged.
Discussion
Changes were observed in the curriculum and the teaching approaches that were consonant with the statistical thinking framework. At this stage in this curriculum development project there seem to be many elements that have started these teachers on a pathway to gradually changing their teaching to an approach that fosters statistical thinking. Some of these elements are: the statistical thinking framework, identifying problematic situations, collaboration, and the assessment.
The Role of the Statistical Thinking Framework
to analyze and interpret the implementation. The identification of improved and problematic areas were perceived and discussed in terms of the whole framework in the second workshop. Not all of the elements in the framework were activated in the delivery of the curriculum, but over time, as the teachers and researcher deepen their understanding of how to foster students’ statistical thinking, more elements will be addressed. The development of such a curriculum should be viewed as an ongoing evolutionary journey. However, without a framework on which to base the curriculum development, the nature of the change would be extremely difficult for researchers to communicate or for teachers to understand.
Identifying Problematic Situations
Apart from the statistical thinking framework, which gave a rationale for the problematic situations, teachers’ critical reflections on their practice enabled the initial curriculum development. According to Jaworski (1994) critical reflection produces informed, committed action and the teachers as the curriculum developers and identifiers of their perceived problems enacted a new approach to teaching. The identification of new problematic areas in the curriculum development was aided by the students and statisticians. The critical reflections of the students in their responses to the questionnaire allowed an insight into their concerns about the teaching of the unit, which identified their problematic areas. The students could be viewed as collaborators in improving their own learning, as having their own voice in the development of the curriculum – a voice that is often not heard but is a powerful voice for teachers. The critical reflections of the statisticians on the quality of student assessment responses and the type of desired responses for informal inference produced a discussion on conceptual development for formal inference that pointed to gaps in the curriculum (including the national curriculum). All these musings will be critically reflected upon by the teachers who will further develop the curriculum.
Collaboration
According to Skovmose and Borba (2000) the quality of participatory research can be discussed in terms of the co-operation between students, teachers, researchers, and in this project the statisticians. This collaboration between the participants is essential since the transformation required in terms of instructional design is unknown. The teachers and students are not the “research objects” but are involved in the research process as participants. They draw conclusions from their own experiences and observations, and their thinking has contributed to the decision-making about the curriculum (Reason, 1994). The teachers are learning with their students. Similarly the researcher is learning how statistical thinking can be put into practice. All participants can be viewed as being in a learning system with many co-emerging activities that are contributing to the development of the curriculum (Begg, 2002).
The curriculum was developed by the teachers in cognizance of the framework and therefore drew on their “wisdom of practice” (Clarke et al., 1996). It was not a “top-down” curriculum development. Instead, it was a collaborative curriculum development in which all the participants felt they could contribute and their contribution would be valued. The case-study teacher played an essential role in this learning system as she encouraged and tutored teachers, allowed individual teachers to modify and adapt the curriculum to their learning needs and to determine how they were going to change their teaching approach. As the teachers are individual learners within a group, the group seemed to be developing a community of practice, which is part of professional growth (Loretz, 2002). Furthermore, since the teachers developed their own resource material to enhance students’ statistical thinking, they have already envisaged themselves as widening this community of practice to other schools, through suggesting that they should publish a resource book as well as run teacher workshops.
researcher), and the discipline (the statisticians). Curriculum development should include statisticians as their discipline is undergoing substantial changes and curricula should reflect this.
The Role of Assessment in Curriculum Development
The change in the national assessment allowed the curriculum to develop within its requirements. Although this has placed boundaries on the development it has provided goals for which teachers can aspire: to gain more statistical knowledge, and to enhance their students’ statistical thinking. This assessment change has been crucial in this curriculum development since assessment is widely believed to drive the curriculum and is a barrier to change (e.g. Clarke, 1996; Pfannkuch, 2001). In fact, the assessment is now more closely aligned to the national curriculum goals (Ministry of Education, 1992). This curriculum development could not have occurred without this assessment change.
External stimuli such as the change in assessment and the research project (Clarke & Peter, 1993), enabled this community of teachers to reflect upon their teaching and subsequently take action (Loretz, 2002). Such action in their own classroom can change teachers’ knowledge and beliefs and hence the learning may result in a transformation (Begg, 2002). This scenario applies also to the students, researcher, and statisticians. Even though change was imposed by the assessment and by the researcher, the teachers were willing participants in the change and had control over the changes. Change involves a willingness to struggle for transformation, which these teachers were prepared to do. Smith (2003) suggested there is a circular praxis, which involves conscientization, resistance, and transformation, which may be observed in this curriculum development.
The above elements are only part of understanding a complex and multi-dimensional curriculum development system. A main finding from this first year of the project was that teachers in a collaborative research process were able to begin to develop their own curriculum and change their practice in ways that were resonant with the framework to foster students’ statistical thinking. The development of a theoretical base for instruction that promotes students’ statistical thinking in consonance with the framework may take some years to abstract and to construe from such curriculum development experiments.
Curriculum Development Issues
The main implications for the statistics curriculum arising from this project are that assessment should be aligned with and reinforce the curriculum; statistical thinking should be fostered and be a major focus of the curriculum; the curriculum is dynamic, occurs in the classroom, and involves the critical reflection of teachers and therefore consideration should be given to evolutionary approaches to curriculum development; and the curriculum is a collaborative enterprise amongst teachers, students, statisticians, and researchers.
Many questions can be raised about this curriculum development project. Some questions that have implications for curriculum development are:
• Once the project is completed how can the knowledge gained be passed on to other people?
• How do the teachers’ understandings of the rationale for the teaching and learning approaches become part of the community practice when the community is constantly changing?
• How can the continual improvement become self-sustaining?
• The case-study teacher was able to critically reflect on her teaching with the researcher. But what system or individual processes need to be created to allow opportunities for all teachers to critically reflect?
• Transformation was claimed to have occurred, but how can it be known that there is transformation and whether it is meaningful or an improvement?
• How can a more collaborative partnership be developed amongst the participants?
• The statistical thinking framework is referred to as the foundation for the curriculum development. But should the researcher impose a pre-determined framework, and if so, should the framework be amendable to adaptation and change?
• To what degree can the curriculum account for multiple perspectives on the nature of statistical thinking?
• How can it be determined whether students’ actual statistical thinking is improving, and do some other measurement instruments, apart from assessment-similar tasks pre-and post-teaching, need to be developed?
• When problematic areas for the curriculum are identified, such as the learning pathway for building conceptual development of formal inference, what steps should be taken?
Such questions need to be addressed in the project. Curriculum development, however, involves a complex learning system in which teachers and students must actively participate in order to bring about meaningful change and innovation. Collaboration between researchers and teachers would seem to be an effective first strategy in the development of a curriculum.
References
Begg, A. (2002). Rethinking curriculum: A developer’s perspective. In B. Barton, K.C. Irwin, M. Pfannkuch, & M.O.J. Thomas (Eds.), Mathematics education in the South Pacific (Proceedings of the 25th Annual Conference of the Mathematics Education Research Group of Australasia, Vol. 1, pp. 123-130). Sydney, NSW: MERGA.
Ben-Zvi D. & Garfield J. (Eds.). (2004). The challenge of developing statistical literacy, reasoning and thinking. Dordrecht, The Netherlands: Kluwer Academic Publishers.
Biggs, J., & Collis, K. (1982). Evaluating the quality of learning: The SOLO taxonomy. New York: Academic Press.
Clarke, B.; Clarke, D. & Sullivan, P. (1996). The mathematics teacher and curriculum development. In A. Bishop, K. Clements, C. Keitel, J. Kilpatrick & C. Laborde (Eds.), International Handbook of Mathematics Education (pp. 1207-1234). Dordrecht, The Netherlands: Kluwer Academic Publishers.
Clarke, D. (1994). Ten key principles from research for the professional development of mathematics teachers. In D. Aichele & A. Coxford (Eds.), Professional development for teachers of mathematics (pp. 37–48). Reston, VA: The National Council of Teachers of Mathematics.
Clarke, D. (1996). Assessment. In A. Bishop, K. Clements, C. Keitel, J. Kilpatrick & C. Laborde (Eds.),
International Handbook of Mathematics Education (pp. 327-370). Dordrecht, The Netherlands: Kluwer Academic Publishers.
Clarke, D. & Peter, A. (1993). Modelling teacher change. In B. Atweh, C. Kanes, M. Carss, & G. Brooker (Eds.), Proceedings of the Sixteenth Annual Conference of the Mathematics Education Research Group of Australasia, (pp. 167–175). Sydney: MERGA
Gravemeijer, K. (1998). Developmental research as a research method. In A. Sierpinska and J. Kilpatrick (Eds.), Mathematics education as a research domain: A search for identity (Book 2, pp. 277-295). Dordrecht, The Netherlands: Kluwer Academic Publishers.
Jaworski, B. (1994). Investigating mathematics teaching: A constructivist enquiry. London: The Falmer Press.
Loretz, M. (2002). Changes in mathematics assessment tasks and practice as the NCEA is introduced. Unpublished Masters Thesis, The University of Auckland, New Zealand.
Ministry of Education (1992). Mathematics in the New Zealand Curriculum. Wellington, New Zealand: Learning Media.
New Zealand Qualifications Authority (2001). Level 1 achievement standards: Mathematics. [Online]: www.nzqa.govt.nz/ncea/ach/mathematics/index.shtml
Pfannkuch, M. (2001) Assessment of school mathematics: Teachers’ perceptions and practices.
Mathematics Education Research Journal, 13(3), 185-203.
Pfannkuch, M. & Wild, C.J. (2003). Statistical thinking: How can we develop it? In Proceedings of the 54th International Statistical Institute Conference [CD-ROM]. Voorburg, The Netherlands: International Statistical Institute.
Reason, P. (1994). Three approaches to participatory research. In N. Denzin & Y. Lincoln (Eds.),
Handbook of qualitative research (pp. 105-117). Thousand Oaks, CA: Sage Publications.
Shaughnessy, J. M. (1997). Missed opportunities in research on the teaching and learning of data and chance. In F. Biddulph & K. Carr (Eds.), Proceedings of the Twentieth Annual Conference of the Mathematics Education Research Group of Australasia, (pp. 6-22). Sydney: MERGA.
Shaughnessy, M. & Pfannkuch, M. (2002). How faithful is Old Faithful? Statistical thinking: A story of variation and prediction. Mathematics Teacher,95(4): 252-259.
Skovsmose, O., & Borba, M. (2000). Research methodology and critical mathematics education. (Publication No. 17). Roskilde, Denmark: Centre for Research in Learning Mathematics, Roskilde University.
Smith, G. (2003). Research for transformation. Presentation at LOGOS#12 Seminar 10-11 December 2003, The University of Auckland, New Zealand.
Snee, R. (1999). Discussion: Development and use of statistical thinking: a new era. International Statistical Review, 67(3), 255-258.
Wild, C.J. & Pfannkuch, M. (1999). Statistical thinking in empirical enquiry (with discussion).
International Statistical Review, 67(3): 223-265.