Mubekti
Pusat TISDA, BPPT Jl. M.H. Thamrin No. 8 Jakarta e-mail: [email protected], Ph:
021-3168914
Gatot Hendrarto
Pusat TISDA, BPPT Jl. M.H. Thamrin No. 8 Jakarta e-mail: [email protected] , Ph:
021-3168913
has been set up. Indonesia employs this system to collect agricultural data from sub-district cumulative up to national level. Village statistics are useful as an alternative, when it is difficult to collect data from farmer or from other means, such us direct ground observation. But, estimating agricultural magnitudes by the village statistics approach gives results of rather poor quality. The main problem is that often the bias due to subjectiveness is systematically in the same direction.
2.2. Agricultural Census
The census of agriculture is usually a Government-sponsored large scale operation for the collection and derivation of quantitative statistical information on the current structure of agriculture, using household as the unit of enumeration. Producing an exhaustive list of farms in a country or region is an obvious way to compute crop area, yield, or other information. Most countries carry out this operation with an interval of 5 to 10 years, whereas, Indonesia has four types of 10-year census, i.e. population census (SP), Economical census (SE), Village Potential census (Podes), and Agricultural census (ST). The last agricultural census of Indonesia was conducted in 200, and the next census would be in 2013. The general objective of the census is to provide up-to-date and reliable statistics on agricultural structure, and it will also help to update sampling frame as a reference for future agriculture surveys.
2.3. Sampling Survey
Since a census is made every 5 or 10 years, the results obtained directly are clearly not valid for the whole period between censuses. Yearly or shorter periods surveys can be carried out by a partial observation of the agricultural sector. Sampling theory provides tools to make an objective extrapolation to the whole population by just observing a small part (sample) of the population. The common sampling frames used on agricultural statistics are list frame, area frame and the combination of both (multiple) frames (Cochran, 1977, and Carfagna et.al, 1994). A list frame is derived from a list of farms from which a sample is drawn. One main limitation of this type of survey is that the sampling frame is usually not updated at the time of the sample. Some farms or household of farms have disappeared, other farms have been created, split or merged, and many has changed size or specialization. Area frame sampling (AFS) is a statistical procedure to measure the quantity of materials of interest in a geographic region of interest. The “area frame” bounds the region of interest, or study area. It may be specified by an arbitrary boundary (like a square or rectangle), a natural boundary (like an ecosystem), or an administrative unit (like a district). The main advantage of area frame compared to list frame is that the sampling frame is mostly under control. The only possible changes may regard the size of units or stratification, that can be modified by the manager. Farms
being created, split, modified will not change the set of segments into which a geographic area have been divided.
II. AREA FRAME SAMPLING
Area frames provide a different approach to agricultural statistics. The units of an area frame are directly bound to a geographical area. If the limits of the region are known, then the elements of the population will be exactly known as well. These elements can be of two main types: points or pieces of land, often known as ‘segment’. This approach is primarily use for crop area estimation, although yield or production estimates can be obtained if the surveyors are able to give yield evaluation by using a crop cutting measurement or a subjective estimate (Gallego, 1995, Houseman, 1975). The concepts of AF sampling are simple: i.e. divide the total land area to be surveyed into N small parcels of land, without overlap or omission; select a random sample of n parcels”. There are two main types of area frame sampling, namely area frames of physical boundary (cadastral segments) and area frame of non-physical boundary (geometrical segments). Next discussion in this paper will be mainly focused on area frame on non-physical boundary.
3.1. Area Frame of Segments
Area frame of sample segment surveys are designed for specific purposes and are commonly used in agricultural statistics as known by FAO (Cotter & Nealon, 1987). The approach of segment sampling consists of dividing the region into grid of 10 km x 10 km, then pieces of land or segments with regular or irregular shapes are defined. The size of the segments varies, but it size used in Indonesian pilot are 100 ha and 25 ha.
The size of frame units (segments) depend on the average field size and homogeneity of the land use. Trials carried out up to now suggest that, for crop estimation, smaller segments can be more convenient in difficult, mountainous area or when the size of the fields is small. Previous pilot study of area frame in Cianjur District by using segment size of 100 ha showed that, the delineation of agricultural fields in one segment need more than 8 hours due to the complexity of the land use. Then, the size of the segments was modified to be 25 ha to make more efficient time and cost.
3.2. Area Frames of Points
Point samples are often employed in environmental, forestry or mining studies (Ripley, 1981; Cressie, 1993). In theory, a point frame is the set of dimensionless points in a certain region and, therefore, infinite. In practice, points can be given a dimension taking into account the precision of the graphic material used to locate the point. If aerial photographs with a scale 1:5000 are used, a point may be given a dimension of 3 m x 3 m, since 3 m correspond to 0,6 mm in the photographs, which is a reasonable choice to
340
III. AREA FRAME OF SQUARE SEGMENT BY POINTS
The technique of area frame by points which has been operational application is the French TER-UTI survey (Porchier, 1990). The construction of area frame of square segment by points is essentially the same as normal area frame, except that only a set sample of points inside a segment is visited instead of the whole segment and no fields must be delineated. Based on the observation of sample points, area estimates are computed and used as a valid generalisation without studying the entire area under investigation. The discussion in this paper would be focused on area frame construction, field survey, data communication and some results of pilot study in Indramayu District, West Java..
4.1. Area Frame Construction
In the area frame construction not only Indramayu District was built but also other districts of West Java Province were built in the coincidence works. Then the administrative boundary was used to cut-off study area of Indramayu District. Land use map was used to delimitate and stratify the study area.
This method involve the division of area frame into blocks of segments and the selection of a fixed number of segments in each block repeating the same “replicate”. The replicate is a fixed pattern or location of selected segments in one block. The same selected segment positions in each block are used.
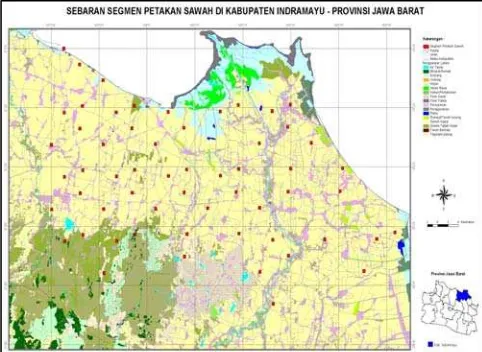
[image:5.612.318.536.136.255.2]The used block was 10 x 10 Km wide containing 400 segments of 500 m x 500 m and in each block 10 segments were drawn. Only the segments that exceed a distance threshold between each other were kept and sequentially numerated. In this extraction 3 segments were deleted and 7 segments were obtained for each block. The general rule is to use the first 4 positions to obtain the desired sample dimension. If it is need modification the location number 5, number 6 can be added and so on. Figure 3.illustrates the distribution of extracted sample segments on land use map. Total number of extracted sample (n) are 52 segments spread over 29 sub-districts out of the total 31 sub-districts available in Indramayu district. Each extracted sample segment is attributed with code number and geographical co-ordinate at bottom-left corner.
Figure 3. Distribution map of sampel segment
Next step is to locate sample points which 25 sample points will be allocated inside each segment. The implementation is to make grid cell of 100 m x 100 m size on the extracted sample segments. The center of each grid cell is to be sample point for field observation. The surveyor will only write down the land use in each of the 25 points instead of drawing and further digitizing all the field in the segment. For the whole of Indramayu district there are 52 (segments) x 25 (points) = 1300 sample points.
4.2. Field Survey
In the study, the limit of the segments is not physical feature but based on geographical boundary, so that, it need supporting material to identify location of sample segments and observation points when the field survey done. Land use map (scale 1:25000) and aerial photograph (scale 1:2500) are used as supporting material where all sampel
[image:5.612.59.300.321.497.2]segments and observation points are plotted on it. The result can be used as a field map for survey guidance Figure 5. illustrates how to plot sample segments on land use map and observation points on aerial photograph regarding to their geographical coordinates.
Figure 5. Illustration of sampel plot on land use map
By using the above guidance the surveyors can look for the location of sample segments and observation points based on the features available on the maps, such as road, settlement, irrigation canal etc. The aim of the survey is to collect rice data directly from the field by observing rice growing stage in each point inside the sample segment.
The field survey activitiy conducted by agricultural officers come to each observation point and write down the stage of rice crop, as follows:
• Vegetative-1 (V-1), which the approximate stage of rice
is 1-35 days after transplanting
• Vegetative-2 (V-2), which the approximate stage of rice
is 35-55 days after transplanting
• Generative (G), which the approximate stage of rice is
55 days up to harvest
• Harvested (P) which is the stage of rice from harvested
up to land preparation
• Land Preparation (PL), which is the rice field being
prepared
• Others (LL) if the land is not for rice crop cultivation
Knowing the above rice growing stages is important because the calculation of rice area and the prediction of rice harvested area will refer to those stages.
While rice productivity survey is conducted referring to the method developed by National Bureau of Statistic (BPS), where plots 2.5 m X 2.5 m are placed in an area segment (Ubinan System). Productivity value would be recorded each month on the segment that rice crop is being harvested. The production of rice crop is derived from multiplication between harvested area and productivity.
342
to the central (Jakarta), a communications systems have been developed by using short message service (sms). Surveyors send field data via sms corresponding to the result of recording the amount of each stage per segment as soon the observation of all points finished. All field data will be stored in the sms server for advanced processing. The address of the system can be visited in:
http:neonet.bppt.go.id/padi/
The extrapolation formula of sample to the population is also developed in the sms server system. Therefore, the field data submitted by the surveyors would be immediatly calculated by the system to estimate rice crop production. The mathematical formulation for rice production estimate is given below:
• Production (P)
P = A x Y dimana,
P is production (Ton) A is harvest area (Ha)
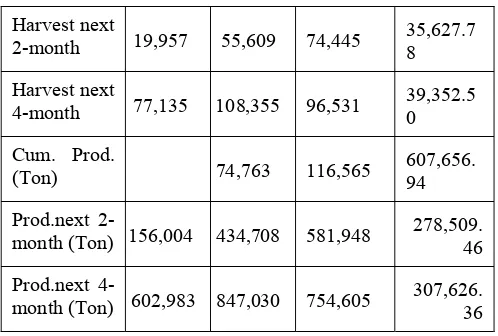
Harvest next
2-month 19,957 55,609 74,445 35,627.78
Harvest next
4-month 77,135 108,355 96,531 39,352.50
Cum. Prod.
(Ton) 74,763 116,565 607,656.94
Prod.next
2-month (Ton) 156,004 434,708 581,948 278,509.46
Prod.next
4-month (Ton) 602,983 847,030 754,605 307,626.36
Most of the farmers in Indramayu District have two rice crop season a year then followed by bare soil, secondary crop or third rice crop. The first planting season is generally started early up to mid November, while the second panting season is generally started at mid up to end of April.
Every survey of area frame sampling is done the related data of rice are derived, such us rice growing stages, harvested area, total rice area, predicted harvest area and production. Tabel …, shows the results of four time field surveys in Indramayu district with the time interval around 1 month each other.
[image:7.612.48.297.69.237.2]Results on Survey-1 show that rice fields are dominated by Harvested, land preparation and vegetative-1 stages, i.e. 43,612.88 hectares, 33,634.62 hectares, and 23,544.23 hectares respectively indicating that the first harvest season has mostly finished and the second planting season has been started. Cumulative harvest is the sum of harvested area between two-survey and present survey. So that there is no cumulative harvest for survey-1 but it can be calculated for survey-2 onward. Total rice field explains the rice field which is utilized by farmers for rice cultivation, and it exclude non rice cultivation, even though most of farmers cultivate rice crop during April or May. It is to say that 120,748.27 hectares of total rice field in survey-1 give a figure of whole total rice field in Indramayu District. The precision of total rice field estimation in survey-1 is indicated by coefficient of variation, that is 4.06 %.
The prediction or forecast of harvest area for next two-month and four-two-month in each survey is based on the area of rice growing stages when the survey is conducted. Foe example, the prediction of rice harvest area for next two-month in survey-1 is the sum between the area of vegetative-2 and generative stages, that is 19,956.54 hectares . Furthermore, the area of rice harvest area for next four-month is the sum between the area of land preparation, vegetative-1, vegetative-2, and generative stages, that is 77,135.38 hectares.
Calculation of rice production is based on the multiplication between harvested area and yield, where
harvested area is derived from field survey of area frame system and yield is derived from plot cutting (ubinan) system conducted in each segment. The production data include actual production and prediction.
IV. CONCLUSION
1. There are various types of approaches on agricultural statistics, which one of them is area frame sampling 2. Area frame of square segment by points is a simple
approach to implement on rice statistics
3. it is a scientifically sound approach based on statistical analysis and unbiased by subjectivity
4. By using sms system for data communication allow to
get near real time results
5. It is based on low technology and does not need high investment costs
6. implementation costs are very low once it has become a
routine activity
7. With slight adaptations it can be applied to other crops
REFERENCES .
BPPT-EU, 2001. SARI (satellite Assessment of Rice in Indonesia. Final Phese A Technical Report. Jakarta. Carfagna, E., and F.J. Gallego, 1994. On the optimum size
of segments in the two-step survey on area frame: Possible improvements for rapid European estimates. Conf. on MARS Project overview and perspectives Office for Publications of the E.C. Luxemberg.
Cochran, W., 1977. Sampling Techniques: John Wiley & Son, New York.
Cotter, J., J. Nealson, 1987. Area Frame Design for Agricultural Surveys. U.S. Dept. fo Agric. Nat. Agric. Serv. Washington
Cressie, N., 1993. Statistics for Spatial Data. Revised Eddition. John Weley & Son, New York. F.J. Gallego, 1995. Sampling Frames of Square Segments.
Report EUR 1631 EN. Joint Research Centre, European Commission, Luxembourg
Mubekti and G. Hendrarto, 2010. Sistem estimasi dan peralamalan produksi pertanian dengan kerangka sampel area. Pros. Pertemual Ilmiah Tahunan XVII dan Konggres Mapin V. Bogor, 8-9 Agustus 2010. Porchier, J.C., 1990. La Teledetection dans dans le
Programme d’Enguetes du SCEES. Conference on the Appl. Of Remote Sensing to Agricultural Statistics. Office for Publication of the E.C. Luxemberg.
Ripley, B.d., 1981. Spatial Statistics, John Weley & Sons. New York.