DRVlFUG CHARACTERISTICS OF TROPICAL GRAINS
AP4 Project, Faculty o f Agricultural Engineering and Technology, Bogor Agricultural University,
Bogor, lndonesia
ABSTRACT
Accurate prediction of drying characteristics of grains can offer great help in the design of thermally efficient dryer while maintaining good quality of processed products by supplying appropriate rate of drying air, its temperature as well as its relative humidity. It is also useful in determining the performance of dryers operated by different types of energy sources as solar, biomass, kerosene and other alternative sources.
Infinite slab, cylindrical and sphere models were used to determine the drying constant of rough rice (IR-361, soybean (Orba) and corn (Arjuna) under thin layer condition.
INTRODUCTION
A t present, in Indonesia, big harvest usually falls coincidently with the rainy season where solar irradiation is a t such a l o w level so that natural drying might not be sufficient t o reduce the moisture content of the harvested grains. Suharmadi and Sudaryono had conducted an experiment where 100 kg of w e t paddy at 24% w b was stored for a period of I 8 days ( 1 ) . They found that 4.2% of the samples were spoiled and damaged.
Artificial drying techniques have been introduced t o Indonesia since 1969. However, due t o lack of skill and knowledge about drying process, most of the dryer were not operated under the optimal condition ( 2 ) . Most of these dryers were designed and constructed t o meet the drying condition of the grains in the foreign countries where the machines were made.
To design a good dryer, drying characteristics of grains should be known. Accurate prediction of drying characteristics of grains can offer great help in the design of a thermally efficient dryer while maintaining good quality of processed products by supplying appropriate rate of drying air, its tempera- ture as well as its relative humidity. It is also useful in determining the performance of dryer operated by different type of energy sources as solar, biomass, kerosene and other alternative sources.
. THEORETICAL CONSIDERATIONS
Basic
Model
The geometry of the grains can be classified into three catagories: slab, cylindrical and sphere. The thin-layer drying model for the three geometries above can be derived from its moisture-balance equation. For the infinite slab model thin-layer drying, the moisture balance can be expressed as follows (3, 4, 5):
with Initial condition : M (y,O) = M o Boundary condition : M(a,t) = M e
This model can be considered as the general thin-layer drying model which can be applied regardless of the shape of the dried commodity. For infinite cylinder and sphere :
Initial condition : M(r,O) = M o
Boundary condition : M(R,t} = M e
The coefficient c in the above equation has a value of unity for cylindrical body and 2 for a sphere. The initial and boundary conditions used in both equations are based on the assumptions that the distribution of moisture within the kernel are isotropic with homogeneous initial moisture content, Mo, constant ambient temperature and relative humidity and the surface moisture content suddenly changes t o Me, following the imposed ambient condition.
There are many solutions of equation / I / and 121 available in order to get the average moisture content.
First, an infinite slab body, the analytical thermal equation developed by Bird e t a/.
(3)
can be modified and integrated t o obtain the average moisture content as expressed below :Brooker (5) expressed the average moisture content of an infinite cylin- drical body as :
' ( L ) J!e aqa 40 Ax!p!unq aA?xelal pue alnae~adwaa $0 laAal u l e a ~ a ~ e ampold o) sjoqane aqx alqeua oa Aem
e qsns ul paiDnJauo:, pue pau6jsap sem snae~edde s!ql '10 pue / 6 / '/8/'b3 w o q ayy pue y slaaalue~ed Gu?~nseaw lo$ pasn seM 1 a ~ n t j l j u! sn1e~eddt;l
lapow ayx 40 s~a$awe~ed aq$ aJe q pue e aJaqM
l z u a m - o m ' ( ~ q - ) dxa ue
3
-
= a,-,: w ~ o 4 aya$o lapow aaew!xo~dde uo pa~npollu! sJoq$ne aya 'aBe~o$s pue awl$ ~aandluoo aqa uassai o l
lapoyy a)ew?xordd.d
Ambient air was passed through a water bath maintained at a certain temperature by manipulated heater no. 4 and refrigerator no. 3. Auxilliary heater no. 6 then are manipulated to get certain value of relative humidity and temperature. For thin layer experiment, thin layer cup was placed on the top of the drying chamber (port A in Fig. 1) and filled with 2 layer grains thick of rough rice and grain thick of corn and soybean, 0.1 mls of air flow was then
passed through thin layer. B
initial moisture content of the grain was measured by vacuum oven method, 1 OO°C vacuum 7 0 cm Wg for 2 4 hours. Rough rice sample (1R-361, corn (Arjuna) and soybean (Orba) were obtained from the Bogor Research Institute for Food Crops. Experimental run was designed for 5 temperature levels: 35,40,45, 5 0 and 55OC.
RESULTS AND DISCUSSION
Drying Characteristics
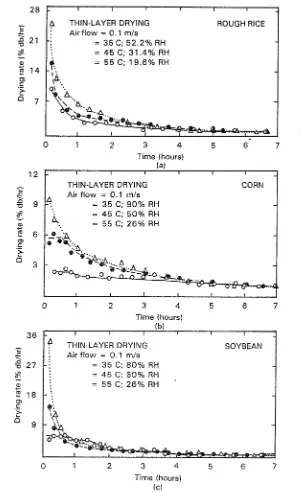
Drying rate vs time
Fig. 2a shows the drying rate of rough rice under constant air flow rate at 0.1 mls and 3 levels of RW,
19.6%,
3 1.4% and 52.2% respectively. The figure indicated that all drying process occured in the falling rate period. For these three temperature levels under study, the higher drying rate occured and continued until t w o hours of drying time.Drying rate vs moisture content
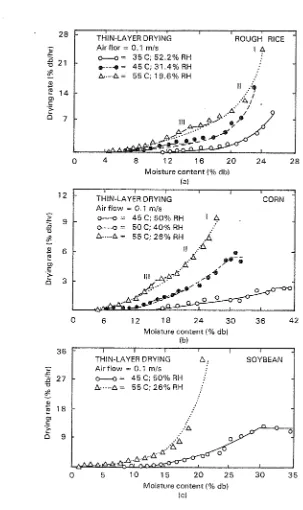
The constant rate period. In the experiment with corn, a certain period of a likely constant drying rate was observed as indicated in Fig. 2b, it was also found that duration of the constant rate period depended on the drying temperature. The higher the drying temperature, the shorter the constant rate period. Under the drying air temperature of 55O6, the constant rate period was no longer observable. The similar characteristics also appeared during the experiment with soybean. The constant rate period for this commodity appear under the drying temperature between 35OC (Fig. 2c).
in corn drying, constant drying rate occured at moisture content above 3 0 % db while soybean at above 2 7 % db (Fig. 3b), which is against the previous report that its occurence only could be detected at moisture content above 7 0 % wb (4).
The occurence of the constant rate period under the relatively low moisture content as detected above should be tested further to confirm their existence.
= 55 C; 19.6% RH
0 1 2 3 4 5 6 7
Time (hours)
= 35 C ; 80% RH = 45 C; 50% RH = 55 C; 26% RH
0 1 2 3 4 5 6 7
Time (hours)
= 35 C; 80% RH = 45 C; 50% RH = 55 C; 26% RH '
0 1 2 3 4 5 6 7
Time (hours) ( c )
[image:5.514.114.421.75.567.2]0 4 8 12 16 20 24 2 8 Moisture content ( % db)
(a)
12
0 6 12 78 24 30 36 42
Moisture content (% db) (b)
3 6
Air flow = 0.1 m/s
A...A = 5 5 C; 26% RH
Moisture content ( % db)
( c )
[image:6.514.85.388.52.562.2]The region IIi could only be seen clearly when drying with temperature at of 55OC. This characteristics were also detected similarly in corn drying experiment 55OC (Fig. 3b). The shift from one region t o another varied according Zo the level of the drying temperature. The higher the drying temperature, the smaller the moisture content at which the shift in drying rate took place, In Fig. 3a, region I l l occured at moisture content
+
1 5 and 1:1 2 % db respectively forrhe
t w o levels of temperature of 4 5 a and 5 5 OC. For corn, region I l l occured at moisture content of+
1 5 % db under 55OC drying temperature.Determination of the Form of the Approximate Model
lnfhite-slab-thin-la yer drying model
Using n = 2 5 and range of Dt/a2 from 0 t o 1 0 in Eq. /3/ and n = 2 for Eq. /7/ the authors obtained the approximated model for infinite slab as:
X is equal to K t where K is a function of diffusivity and geometry of the body to replace the infinite series (-ln
+
112)' 7~ 'D/a2) in Eq. 131. Equation 181 isa modification of the slab model of Henderson ( 8 ) t o represent the movement of moisture within a body during the falling rate period (9). This model has a standard deviation of 0 . 0 0 0 4 6 7 from the exact solution. Hence forth Eq. 181 will be called the Infinite-Slab-Thin-Layer Drying model (ISTLD model).
Approximate-infinite-c ylindrical-model thin la yer drying
The final expression for the approximate Infinite-Cylindrical-Thin Layer- Drying Model is given by.
'
0.691 547exp(-1.445766X)+
0.134633exp(-7.617876X)( X
>
.64) Where X = (A2/V2 D)t = Kt = X:Equation 191 is called the approximate Infinite-Cylindrical-Thin-Layer Drying model (ICTLD model) and has a standard deviation of 0 . 0 0 0 8 0 8 from its analytical solution (Eq. 141).
4.2.3. Approximate-Sphere- Thin-Layer Drying Model.
Determination of Parameters in the Approximate Model.
The drying constant I( and Me
I n general the approximate-thin-layer-drying-model in equations 181, 191
and I1 01 can be arranged as :
where
\k
(K.t) can be expressed interms of the ISTLD, ICTLD or sphere models. To determine the average moisture content in Eq. 11 11 there are t w o para- meters must be known, namely the drying constant K and equilibrium moisture content, Me. The value of M e was determined experimentally while the drying constant K was determined by means of the non linear least square method.Parameters K and M e in Eq. 11 1 / are combined non linearly. This equation can be linearly through introducing the aproximation :
a
fi(K,Me) fi(K+
A K,M+
A Me) = fi(K,Me)+
A
K+
a
KApplying condition of minimum least square method onto Eq. 11 2 / as :
a
(Yi-fj(K+
A ,,Me+
A Me)a
(Vi-fi(K+
A ,,Me+
A Me) f --
= 0/131a
K Mewhere Yi = experimental data,
If initial value of K and M e are known, the value of
A
K andA
M e can-be calculated from Eq. I 1 4 1 and I1 51. Initial value of K and M e are guessed arbitrary close t o its true value. IfA
K
andA
Me are close t o zero it means the guessing value of K and M e are closely equal t o its exact' value. I fA
K andA
M e still quite large, get the new value of K and M e by addingA
K andA
Me and the above procedure are repeated.The
K
value for rough rice
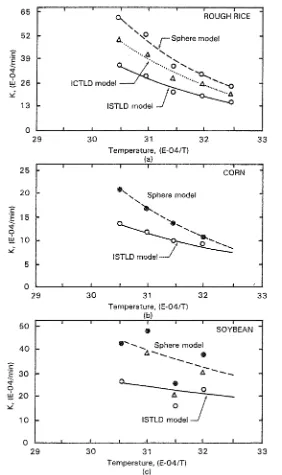
In general, rough rice in Indonesia belongs t o the Indica group which has a slender body. Therefore, in this study, for the IR-36 variety, the lSTLD and ICTLD model was used and the respective values of K and M e were determined. In addition t o this the application of a sphere model was also studied here for comparison. Using the three models mentioned above for rough rice, the authors obtained the K value expressed in terms of absolute temperature :
Kslab, KcV/ and Ksp referred t o
K
derived from the ISTLD, ICLTD and sphere model respectively.The K value for corn and soybean
Temperature, (E-04lT)
2 0 @\, Sphere model
\
c
.-
'g,E 15 G 0
5
16u'
5
2 9 3 0 3 1 3 2 3 3
Temperature, (E-04lT) (b)
5 0
Temperature, (E-04lT) (c)
[image:10.514.117.399.77.552.2]-
Sphere modelAir flow = 0.1 mls
0 = 45 C; 58% RH
@ = 55 C: 26% RH
---
Sphere model0 10 20 30 0 12 24 36
Time (hours) Time (hours)
(a) tb)
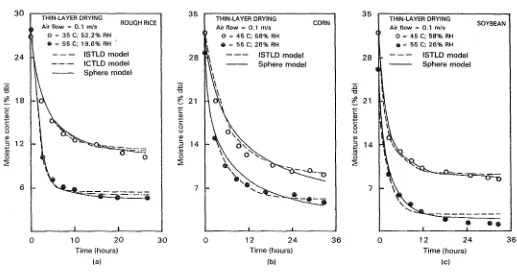
Fig. 5. Predicted change of moisture content using sphere model for thin-layer-drying of rough rice,
Air flow = 0.1 mls
0 5 45 C; 58% RH
@ = 55 C: 26% RH
0 12 24 3 6
Time (hours) (c)
[image:11.680.78.595.73.346.2]Effect of temperature on K
The curve of K as a function of absolute temperature (I/T) for each grain can be seen Fig. 4. The value of K for lSTLD model was the smallest among the three models.
Fig. 5 shows the comparison of the predicted change in moisture content of grain under thin layer drying condition. For 1R-36, the ISTLD, lCTLD and sphere model predicted the moisture content closely with the experimental data. These models shows in agreement w i t h the data within 6 hours of drying time and tend t o deviate in large time.
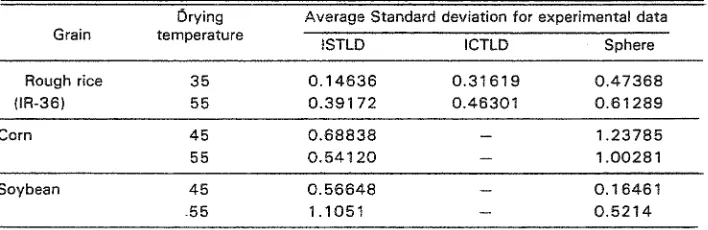
Table 1 . Deviation of moisture content as predicted from the theorical model.
Drying Average Standard deviation for experimental data Grain temperature
ISTLD ICTLD Sphere
Rough rice 3 5 0 . 1 4 6 3 6 0.31619 0.47368
(IR-36) 55 0.391 7 2 0.46301 0.61 289
Corn
Soybean
For corn and soybean, the ISTLD model were found t o be more accurate than the sphere model (Fig. 5b, c) and when compared interrns of the standard deviation as shown in table 1, the ISTLD model proved t o be best representing the experimental data.
In some experimental runs, i.e. soybean drying under 45OC and 50°C, the standard deviation of the sphere model was smaller than the lSTLD model. This fact can explain partially the authors postulate about the need t o improve the drying model according to the shape of the dried commodity.
CONCLUSIONS
1. Constant rate period was detected at moisture content 36% and 27% for corn and soybean and the level was found affected by the drying tempera- ture.
2. Thin layer models derived here was also valid i n predicting the moisture '
change both with the constant and falling rate period.
[image:12.514.82.436.225.340.2]ACKNOWLEDGEMENTS
The authors indebted t o the Agricultural Product Processing Pilot Plant Project, FATETA IPB, where most of this study were conducted. Thanks is also due t o Prof. A. Hosokawa Utsunomiya University for his valuable guidance.
LIST OF SYMBOLS
A = surface area of the grains, cm2
a = half thickness of symetrical slab body, ern c = constant in Equation 121,
-
D = diffusivity, cm2/rnin K = drying constant, min-'
M = moisture content at time being, % db M o = initial moisture content,
9
6
dbM e = equillibrium moisture content, % db R = radius of cylinder or sphere body, c m
r = distance from centre of cylinder or sphere body t o a specific point, c m
T
= absolute temperature, O I<t = time, min
V = volume of the grain, cm3
X = dimensionless time in Eq. /6/,/7/, /8/,/91 and 11 01
X~
= dimensionless time in Eg. I 4 1Y = distance from centre of symetrical slab body t o a specific point, c m Yi = the i t h of experimental data
X
= positive roots of the zeroth order Bessel function of the first kind, -REFERENCES
1. SUHARMADI OAN SUOARYONO (1 982). Risalah Lokakarya Pasca Panen Tanaman Pangan, Puslit- bangtan, 1 3 1 -1 43.
2 . DIRECTORATE OF FOOD CROP ECONOMICS. Survey on Dryers. Paper presented in: Post-Harvest Workshop, Jakarta, January 16-1 8.
3. BIRD, R.B., STEWART, W.E. AND LIGHTFOOT, E.N. (1 976). Transport Phenomena, John Wiley & Sons, Inc., London.
4. WOLTY, J.R., WILSON, R.E. AND WICKS, C.E. ( 1 976). Fundamentals of Momentum Hear and Mass Transfer, John Wiley & Sons, New York.
5. BROOKER, D.B., BAKKER-ARKEMA, F.W. AND HALL, C.W. ( 1 979). Drying CerealGrains, AVI Publ., Co., Wesport, CT.
6. NISHIYAMA, Y. (1 982). J. The Faculty ofAgriculture, lwate University, vol. 1 6 , 4 9 - 5 9 . 7. TERUI, T., KUMURA, T. AND NISHIYAMA, Y. (1979). J. Soc. Agric. Machinery, vol. 41, 271-277. 8. HENDERSON, S.M. AND PERRY, R.L. ( 1 9 7 6 ) . Agricultural Process Engineering, The AVI Publ., Co.,
Westport, CT.