----deparQセゥM、en@
PENDIDlKAN NASIONAL
FAKULTAS KEHUTANAN INSTITUT PERTANIAN BOGOR
DEPARIEMEN HABIL HUIAN
Kampus IPB Darmaga PO BOX 168 Bogor 16001 Alamat Kawat FAHUTAN Bogor Phone: (0251) 621285, Fax: (0251) 621256 . 621285, E-mail: [email protected]
SURAT KETERANGAN
Nomor:
1"1'
1K13.5.3/PL/2007Ya.ng bertandatangan di bawah ini Departemen HasH Hutan Fakultas Kehutanan IPB, menerangkan bahwa HasH PenelitianIKarya Ilmiah atas nama Dr. Lina Karlinsari, S.Hut., MSc.F. sebagai penulis utamaltunggal, yang berjudul "Study on Wood Bending Strngth Evaluation Based on Non Destructive Testing Ultrasonic Method" sebagai taporan hasH penelitian Tanabe Foundation tahun 2006, telah tercatat dan tersimpan di Perpustakaan Departemen Hasil Hutan Fakultas Kehutanan IPB
Demikian Surat Keterangan ini dibuat untuk dipergunakan sebagaimana mestinya.
3
fェZセ, i. u
'"'
C 'I'...
RESEARCH REPORT
Study on Wood Bending
Strength Evaluation
Based on Non
Destructive Testing Ultrasonic Method
By
Lina Karlinasari
Funded by The Tanabe Foundation
..
.tp
"...
....セセNNNNNNN
,.
. .
>;
Department of Forest Products
Faculty of Forestry, Bogor Agricultural University
Indonesia
&
.,.
\
J
Research Title
Field
Researcher
Laboratorium
Department
Faculty
University
Country
Research time
Study on Wood Bending Strength Evaluation Based on Non Destructive Testing Ultrasonic Method
Wood Science
Lina Karlinasari, MSc.F
Wood Engineering
Forest Products
Forestry
Bogor Agricultural University
Indonesia
1
i
セ@
セ@
ャセ@
ZZZセ@
if
セゥヲ@
ャセ@
.
-セNNL@
Aセ@
セ@
Nセ@
, Nセ@
j LセG@
[セ@
!
;!t
-!t
-!t
セAj@
セ@
セセ@
セ@-
セ@ セ@
セ@
Mセ@
;!t
セ@ [セ@
セ@
it
:tJ
..
PREFACE
This research was done dealing with nondestructive testing of wood bending strength. In the forest products industry, nondestructive testing or evaluation (NDE) has been developed and is used in structural products grading programs that result in engineered material with welldefined performance characteristics. One of NDE technique, which uses ultrasonic wave propagation characteristics, has received considerable attention.
In Indonesia, non destructive testing research is still few, even for grading activity. This conditions cause the information regarding to species using this method still limited. The aim of this research is to define characteristics of some tropical hardwoods species using ultrasonic method in beamsmall wood specimen for their bending strength properties.
The report is divided into five chapters. These are (1) introduction, (2) review of references, (3). materials and methods, (4) results and discussions, and (5) conclusion.
The author is thankful to Tanabe Foundation for financial support on my research and hopes this report will be useful and the cooperation research like this can be continued.
Bogor, August 2006
.tJ
tf
.Jj .W
IIIIl
;n:=ro セL@ セNL@
セセ@
セ@ Nセ@
ACKNOWLEDGEMENT
LLセ@
j セ@
I would like to express my appreciation to the TANABE FOUNDATION, Japan for
ゥセ@ financially support on this research. This grant is very valuable as part of my Ph.D research, as well as for graduate student for finishing their thesis. Great appreciation is
セ@ セ@
given to Laboratory of Wood Engineering, Department of Forest Products, Faculty of
Lセ@
Forestry, Bogor Agricultural University and staff of Material Laboratory, Research
,
セ@Centre for Human Settlement, Bandung. The author also thank to Mr Irfan Handrian, Nセ@ Danang Hidayat, and Ms. Berlian Putri for helping during the field work .
.セ@
Nセ@
, Zセ@
:!f
セ@
Nセ@
" , .;;;..Gセ@
Lセ@
:!f
"
セ@" セ@
セ@ セ@
セセ@
..
."
! '!!1
1 Lセ@
[セ@
1 Lセ@
I!J
111
IJ
I)
Ct
; )
-i
J
,
.1111)
j
Aセ@!
J
セiI@ TABLE OF CONTENTS
jセ
..,
PREFACE ... . iiMョセ@
1
.Ii}
セャ@
'l
セゥス@
ェセ@
[image:6.614.113.496.70.526.2]ACKNOWLEDGEMENT ... . TABLE OF CONTENTS ... ;... LIST OF TABLES ... . LIST OF FIGURES ... 1. INTRODUCTION
iii iv
v
vi
セ@
..
>,
i}
.;;:r.
セ@
Background ... . Objectives ...
セ@
セN@
Hypothesis... II. REVIEW OF REFERENCES ... ..
III. MATERIAL AND METHODS
2 3
セ@ Materials... ... ... ... 5
Zセ@ Methods... ... 5
i!f
セ@
Lセ@
:i!f
IV. RESULTS AND DISCUSSIONS
Beam evaluation... ... ... ... .... Small specimen evaluation.... ... ... ... ... Static and dynamic bending test.... ... . .. ... ... .. ... Relationship of velocity and density on bending strength .. ... ....
9
13
13
15
:!J
Relationship of dynamic MOE on static bending MOE and MOR .... 19,
セ@
Nセ@
.!t
Evaluation of wood condition ... ... V: CONCLUSION... ... ... ... ABSTRACT ...
20
24
25 セ@ Nセ@ REFERENCES ... 27
セ@ Nセ@
T セ@
Nセ@
Zセ@
, ,!!
£1
H iv
I'
セN@
, I
.J
..
.dセNNL@
Zセ@
..,
セセ@
セ@
.セ@
..セ@
Zセ@
セ@
Nセ@
.セ@
.セ@
Zセ@
Nセ@
セ@
セ@
...ij
Zセ@
Zセ@
.ij
Nセ@
Nセ@ Nセ@
Nセ@
Nセ@
Nセ@
Nセ@
i)
:)
... . j
t
OF TABLES
Table 1.
Table 2.
Table 2.
Table 3.
Table 4.
Table 5.
Table 6.
Table 7.
Table 8.
Evaluation of wood quality of tectona wood, African wood, and sengon wood ... '" ... Mean values of density, ultrasonic velocity, dynamic MOE and energy of tectona wood, African wood, and sengon wood beam (8xI2x200) cm in three vertical position ... セ@ ... Mean values of density, ultrasonic velocity, dynamic MOE and energy of tectona wood, African wood, and sengon wood beam (8x12x200) cm in three vertical position ... '" ... . Mean values of density, ultrasonic velocity, dynamic MOE and energy of tectona wood, African wood, and sengon wood beam (8x12x200) cm in three direction of sound propagation ... . Mean values of density, ultrasonic velocity, dynamic MOE and energy of tectona wood, African wood, and sengon wood in severalliength beam (8x12x200) cm ... . Regression model for relationship between ultrasonic velocity, length beam and wood density ... Mean values of physical and bending strength properties in small specimen for tectona wood, African wood, and sengon wood ... Summary of regression parameters for regression of ultrasonic velocity and density on static bending MOE and MOR for three species ... Summary regression parameters for regression of dynamic MOE on static bending MOE and MOR for three species ...
9
10
10
11
12
13
14
15
19
v
]セセセNLL⦅セ@
__
]セセッセ
.. ==;;;;;;;;;;;;iiiiiiiiO;;;;;;;;;;;;;;;;;;;;;;;;;;;;;;;;;;;;;;;;;;;;;;;;;;;;;;;;;;;;;;;;;;;;;;;;;;;;;;;;;;;;;;;;;;;;;;;;;;;;;;;;;;;;;;;;;;;;;;;;========i セ@
[セ@
ゥセ@
セセ@
=
セ@
ェセ@
.2 セ@
Zセ@
Lセ@
セセ@
Zセ@
セ@
セ@
セ@
セ@
セ@
!J
_ :!J
_!J
Nセ@
_ !t
Nセ@
_ '!9
- Lセ@
Lセ@
Lセ@
,Ij
i)
::. )
;)
.t
4
::r
III
[image:8.614.134.499.60.407.2]LIST OF
Figure 1.
Figure 2. Figure 3
Figure 5. Figure 6. Figure 4
Figure 7. Figure 8. Figure 9. Figure lO.
Figure 11. Figure 12 Figure 13. Figure 14. Figure 15.
Figure 16.
Figure 17.
Figure 18.
Figure 19.
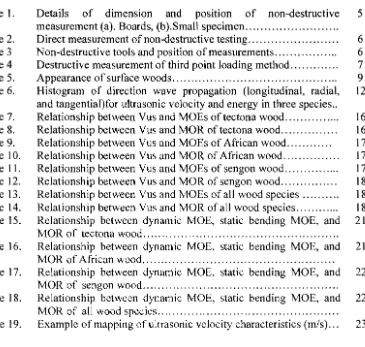
Details of dimension and position of nondestructive 5 measurement (a). Boards, (b).Small specimen ... .
Direct measurement of nondestructive testing.... .... ... .... 6
Nondestructive tools and position of measurements. ... ... 6
Destructive measurement of third point loading method.... ... 7
Appearance of surface woods... ... 9
Histogram of direction wave propagation (longitudinal, radial, 12 and tangential)for ultrasonic velocity and energy in three species .. Relationship between Vus and MOBs oftectona wood... 16
Relationship between Vus and MOR oftectona wood.. ... .... 16
Relationship between Vus and MOBs of African wood... 17
Relationship between Vus and MOR of African wood... 17
Relationship between Vus and MOBs of sengon wood... .... 17
Relationship between Vus and MOR ofsengon wood... 18
Relationship between Vus and MOEs of all wood species ... 18
Relationship between Vus and MOR of all wood species... ... 18
Relationship between dynamic MOE, static bending MOE, and 21 MOR of tectona wood ... Relationship between dynamic MOE, static bending MOE, and 21 MOR of African wood ... . Relationship between dynamic MOE, static bending MOE, and 22 MOR of sengon wood ... Relationship between dynamic MOE, static bending MOE, and 22 MOR of all wood species ... . Example of mapping of ultrasonic velocity characteristics (mls). . . 23
vi
ij
lit I. INTRODUCTION
ij
Backgrouud
..
セ@ Strength wood analysis facilitates predicting residual strength. For theセ@
..
progress of durability and service life of wooden constructions through appropriate maintenance, it is important to detect deterioration, both physic and biology, ofij
wooden constructions members quantitatively and precisely, and to accurately
セ@
estimate/evaluate reductions in strength. For this purpose, establishment of reliable .ij
and practical methods to evaluate residual strength of wood is essential. These
セ@ methods must be not only accurate but also non destructive and practical.
Non destructive testing has been extensively used for sorting or grading of
セ@
wood products. Examples include visual grading and machines stress rating (MSR) of
•
lumber. Dynamic modulus of elasticity (MOEd) using ultrasonic methods have been
セ@
used for the same purpose. It is recognized that ultrasonic method provides quick and
セ@ reliable results in wood examination. The use of ultrasonic wave propagation as a
!) nondestructive evaluation technique has proved to be a viable method to characterized wood. Research on ultrasonic techniques has evidenced the efficacy method to .!)
determine the mechanical properties of wood. The validity of this technique is tested
Nセ@
by means of comparisons with results obtained through destructive test, providing
セ@ significant correlation parameters (Oliveira et al., 2002).
Mセ@ Determination of the mechanical properties of wood by ultrasonic propagation is based on the correlation between the speed of sound, the modulus of elasticity and
セ@
the density. There are close correlation between MOEd and static modulus of
Mセ@
elasticity (MOEs) measured by destructive testing. Several studies have shown a good !j
relationship (R2= 0.40.85) between stress wave based (both sonic and ultrasonic
Mセ@ stress) modulus of elasticity (MOEd) and the static modulus of elasticity (MOEs)
!9
(Bostrom, 1994; Wang et al. 2001; Ayarkwa, et al. 2001; Oliveira et al. 2002).Nセ@
.!t
Objective
Nセ@ The objective of this study is to obtain ultrasonic velocity characteristics of
Lセ@ three kinds hardwoods species (tectona, African wood, and sengon) and find correlations between dynamic test by ultrasonic (MOEd) and static bending test
:)
:.
:)
-.
セ
...
=
:)-..
(MOEs and MOR) as well as to do preliminary study for evaluation of wood..
condition through certain method approaches ...
Hypotheses
セ@
'tl
..
1. There are significant influence from wood dimension on ultrasonic velocity characteristics..
'.
2. Mathematical model developed can be used as predictor of wood bending strengthセ@
セ@
セ@
•
..
セ@
セ@
..
セ@
セ@Mセ@
Mセ@
セ@
セ@
セ@-
セ@!}
Nセ@
セ@
セ@
J
:)
J
2)
J
...]
II1II...-セ@
セ@
II. REVIEW OF REFRENCES
セ@
Non destructive testing or evaluation is defined as the science of identifYing
Mセ
.
.,
the physical and mechanical properties of an element of a given material without altering its final application capacity (Ross et al., 1998). Non destructive testingセ@
method has been extensively used for sorting or grading of wood products. Examples
セ@ include visual grading and machining stress rating (MSR) of lumber. Dynamic
セ@ modulus of elasticity (MOEd) and ultrasonic method also have been used for the same purpose. Ultrasonic stress wave is similar to the sonic stress wave approach except
Mセ@
that is applied at higher frequencies. Ultrasonic is a high frequency sound at the
セ@
inaudible frequency range. The ultrasonic method is very popular with homogenous,
セ@ nonporous materials for detection of flaws (Bodig, 2000). In case of wood the
セ@ frequency is between 20kHz500kHz. The two most frequently used methods are the through transmission and the pulseecho methods (Zombori, 2001). The through
セ@
transmission method requires two piezoelectric transducers (mainly quartz crystals)
Mセ@
on each side of the subject being inspected. In case of pulseecho method, only one
セ@ transducer is used.
It serves both the transmitter and receiver function, therefore only
セ@ the reflected pulse is measured.
!) The use of ultrasonic wave propagation as a nondestructive testing method has proved to be a viable method to characteristic wood. Research on ultrasound method !)
has evidence the efficacy of the method to determine the mechanical properties of
_!J
wood. The validity of this method is tested by means of comparisons with results
Mセ@
obtained through destructive test, providing significant correlation parameters.
The advantages of ultrasound method over the conventional characterization
-
セ@methods are its speed, versatility and lower cost. Another advantage is that the
Mセ@
material is unaffected by the propagation phenomenon, allowing the sample to be セ@
tested a number times without becoming deformed. Another application of the
セ@ nondestructive methods is the evaluation of structures that are in use, i.e., in situ セ@ evaluation, allowing for their maintenance or rehabilitation through a mapping of the deteriorated area, which permits evaluations to be made of their structural integrity without the need to remove part of the structure (Oliveira et al., 2002)
Mセ@
セ@
'J
.
)
-.
..
")
セ@
セ@
セ@
MZセ@
セ@
セ@
セ@
セ@
セ@
セ@
セ@
セ@
セ@
セ@
セ@
セ@
セ@
Nセ@
セ@
セ@
Mセ@
Nセ@
セ@
Mセ@
Mセ@
セ@J
)
.
)
..
.)
.)
:1
セ@
Detennination of the mechanical properties of wood by ultrasonic propagation is based on the correlation between the velocities of ultrasonic wave, the MOE and the density.
The factors that influence the propagation of ultrasonic waves in wood are physical properties of the substrate, geometrical characteristics of the species (macro-and micro structures), conditions of the medium (temperature, moisture content) species (macro-and the procedure utilized to take the measurements (frequency and sensitivity of the transducer, their size, the position and dynamic characteristics of the equipment) (Oliveira et al. 2002). Density is one of the common properties used to evaluate wood. Mishiro (1996) indicated three types of relationship between ultrasonic velocity and density (for different Japanese species with density ranging between 90 and 1300 kg/m3): sound velocity increases with density, or it is not affected by density, or it
decreases with density.
The fundamental hypothesis for NDT of wood materials was first presented by Jayne (1959). He proposed that the energy storage and dissipation properties of wood materials, which can be measured nondestructively by using a variety of static and dynamic techniques, are controlled by the same mechanism that detennine the mechanical behavior of such materials. As a consequence, useful mathematical relationship between these properties and elastic and strength behavior should be attainable through statistical regression analysis methods (Ross, 1992). To elaborate of Jayne's hypothesis, consider how the microscopic structure of clear, straight-grained wood affects mechanical behavior and energy storage and dissipation properties. Clear wood is a composite material composed of many tubelike cell cemented together. At the microscopic level, energy storage properties are controlled by orientation of the cells and their structural composition, factors that contribute to elasticity and strength. Such properties are observed at frequency of oscillation in vibration or speed of sound transmission. Energy dissipation properties, conversely, are controlled by internal friction characteristics, with bonding behavior between constituents contributing significantly. Rate of decay of free vibration or acoustic wave attenuation measurements are frequently used to observe energy dissipation properties.
セ@ セ@
] セ@
ij
..
セ@'"
セ@ セ@ セ@ セ@
セセ@
Qセ@
1 セ@
Lセ@
セ@ セ@
1!J
, Nセ@
1 セ@
セ@
セ@
1 Nセ@
Qセ@
, Nセ@
, セ@
-. Nセ@
...
セ@NNNセ@
, ::!
セ@ セ@
セ@ セ@
_J
J
]
, )
}
)
.... J
III. MATERIALS AND METHODS
Materials
The species studied were tectona (Tectona grandis), African wood (Maesopsis eminii) and sengon (Paraseriathes falcataria) representing low, medium and high density. All the species were obtained from community forest around the Darmaga district, Bogor. The pieces were boards and small wood specimens. The dimension and geometry ofthe specimen was represented by Figure 1.
41 em
200 em
8em
(a)
<
41em)
セᄁ@
2x2 emセ@
a
(b)
• : point of measurement
JL
R
Direction of propagation measurement
Figure 1. Detail of dimension and position of nondestructive measurement (a). Board, (b). Small specimen
Methods
The board with 12 cm width, 8 cm thickness and 200 cm length were taken to carry on the test and conditioned to achieve equilibrium moisture content (EMC) about 1518%. Generally, there will be two form, board and small wood specimen. Those were as depicted in Figure 1a and lb. The smallest section was (2.5 x 2.5 x 41)
..
cm measured by non destructive and destructive testing and the board (12 x 8 x 200) cm were measured by non destructive testing. All non destructive testing was done
[image:13.614.98.549.181.492.2]it
through direct measurement (Figure 2.). Visual analysis was noted as reference ofthe
it
..
セ@ セ@
..
..
.
Nセ@
Nセ@Nセ@
..
it
セ@
セ@
セ@
ij
- ij
セ@
Nセ@
セ@
セ@ セ@
.ij
Nセ@-
Nセ@
Hセ@セ@ Lセ@
Nセ@
J
.
...
-.
.
...i . IlL
condition of the specimen
セ@
F::3
[image:14.614.178.469.65.129.2]セ@
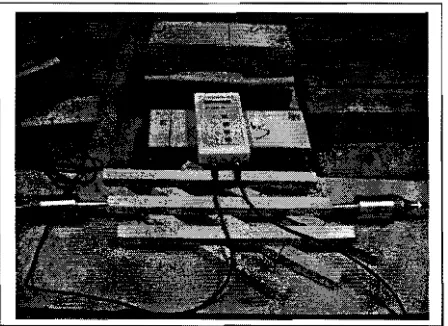
Figure 2. Direct measurement of non destructive testing
Figure 3. Nondestructive testing tools and position of measurements The non destructive testing was developed through ultrasonic wave velocity measurement. The ultrasonic wave propagation was measured by ultrasonic device Sylvatest Duo® (f=22kHz) as shown in Figure 3. The application and measurement consists of positioning two accelerometer transducers on the material to be evaluated. The ultrasonic wave was introduced into the material by one transducer (transmitter) and picked up by the other transducer (receiver), with the time reading in microseconds performed by the ultrasonic instrument it self. The recorded times were used to calculate the ultrasonic velocity and dynamic modulus of elasticity, based on Equation (1, 2).
d
v= (1)
t
[image:14.614.207.431.173.336.2]where, d is the distance between the twO'transducers (cm), and t is propagation time of the pulse from transmitting transducer to the receiving transducer (IlS).
...セMBMGM ..
--i
The ultrasonic velocity is used to express the dynamic modulus of elasticity
•
(MOEd). The MOEd is calculated by the following equations:i
..
.
..
xVu2MOEd= (2)
•
g..
it where, MOEd is dynamic Modulus of Elasticity (kglcm2), p is density (kg/m\ Vu is
ultrasonic wave velocity (m/s) and g is gravitational constantan (9.81 m/s2) .
Static bending test was done to determine the static modulus of elasticity
it
(MOEs) and modulus of rupture (MOR). Bending strength properties test for the
.,
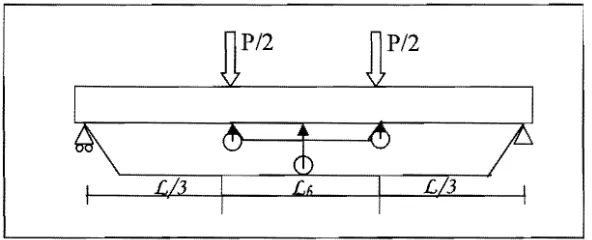
JIIJ specimens are performed by third point loading method (Figure 4) in universal testingmachine (UTM, Senstar®). Actually, the dimension of destructive testing is in accordance with ASTM D 1432000 for bending test (2.5 x 2.5 x 41) cm.
•
..
セ@
セ@
セ@
セ@
セ@ :ij
Nセ@-
セ@:
セ@, セ@
, Nセ@
, Nセ@
, Lセ@
, セ@
, セ@
セ@ ,j
J
•
J
.
..
P/2 P/2
Figure 4. Destructive measurement ofthird point loading method
The MOEs and MOR are calculated by the following equations:
P'xL3
MOEs (kglcm 2 ) (3)
4.7xY'x bx
MOR (kg/cm 2)
=
Pmax xL (4)bxh 2 where
MOEs : static Modulus ofelasticity statis (kglcm2) MOR : Modulus ofrupture (kglcm2)
Pmax : maximum load (kg) L : span (cm)
b : base of specimen (cm) h : height of specimen (cm) P' : load at proportional limit (kg)
Y' : deflection at mid length at proportional limit (cm)
-'" 1
III'
[image:15.614.172.468.261.381.2]••
•
Statistical analyses were observed to find nondestructive variable values in
•
board in which of difference vertical position and direction of propagation..
measurement. Relationship of velocity and density on MOEd and MOR; as well as..
MOEd on MOEs and MOR were assessed to find statistical correlation betweeno.
statically and dynamically established moduli. Least squares regression analyses areused in this study.
•
i
•
o.
i
:1
,
1
01
1
I
•
:.
•
•
-'
:a
:1
c.
:II
:1
8
...セMB@
...
..
4
Ii
•
..
..
セ@if
it
it
セ@
IV. RESULTS AND DISCUS IONS
Beam evaluation
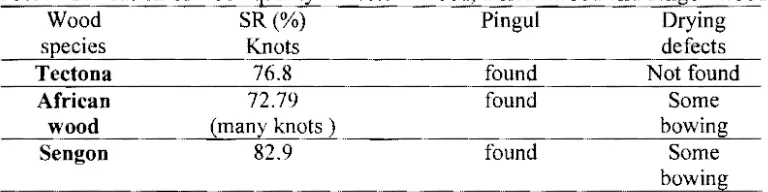
Evaluation of beam quality on three kinds species (tectona wood, African wood and sengon wood) depicted by wood defect (knots, pingul, drying defects) is shown in Table 1.
Tabel 1. Evaluation of wood quality on tectona wood, african wood and sengon wood
Wood SR (%) Pingul Drying
species Knots defects
- .. セ@ Tectona
African
76.8 72.79
found found
Not found Some
セ@
セ@
wood Sengon
(many knots)
82.9 found
bowing Some bowing Note: SR strength ratio according to A STM D2452000
- ij
セ@ More details of wood condition are shown as following Figure 5.
セ@
セ@
Nセ@
セ@
セ@セ@ セ@
a. Tectona wood
Nセ@
_ :l
- J
- ]j
:} :}
Nセ@b. African wood c. Sengon wood
セ@ Figure 5. Appearance of surface woods
セ@
セ@
,
J
.
[image:17.614.113.497.161.257.2] [image:17.614.108.496.298.611.2]iii
-
•
it
-:
セ@
セ@
セ@
"'"
;"
セ@
セ@
Zセ@
セ@
Mセ@
::"\
Lセ@
Acc.ording t.o ASTM 0245 which c.oncerns with visual grading .of W.o.od with s.ome defects parameter was sh.own that African W.o.od had I.ower SR than .other W.oods in which f.ound many knots.
The velocity has been found to be influenced by wood species, W.ood anatomy (cell c.omposition and structure), grow site, level .of W.ood stress, m.oisture content, temperature, relative humidity, and directi.on of waves propagation (l.ongitudinal, radial, tangential) (Smith, 1989). Density d.oes not significantly effect the velocity, but the ratio .of the medium's elastic modulus E to its density p is important; for the case .of rods, the vel.ocity sound V can be shown to be given by V = (E/p)112. More.over
Gerhards (1982) summarized variables influencing of sound vel.ocity as determined by a number of researcher, there are knots, slope grain and WO.od decay.
[image:18.614.114.505.297.529.2]Table 2 shows the mean values of density, ultrasonic velocity, dynamic MOE and energy oftectona WO.od, African wood and sengon wood beams.
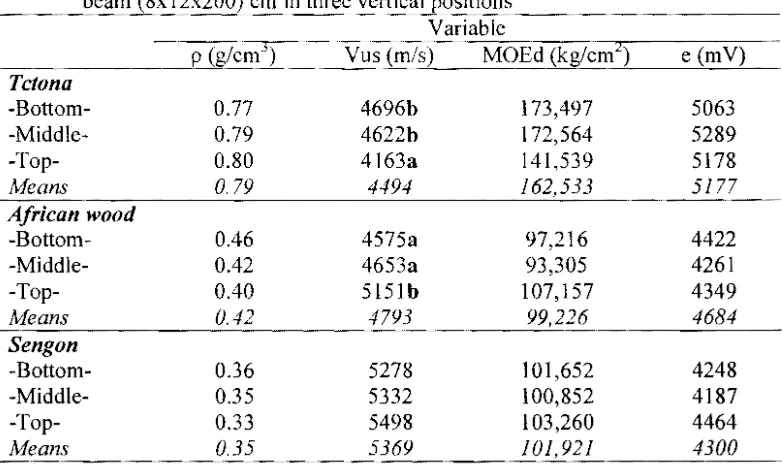
Table 2. Mean values of density (p), ultrasonic velocity (Vus), dynamic MOE (MOEd) and energy (e) of tectona WO.od, African wood and seng.on wood beam (8xI2x200) cm in three vertical positions
Variable
セ@ p (g/cm3) Vus (m/s) MOEd (kg/cmz) e (mV)
Tctona
',",
セ@ -Bottom- 0.77 4696b 173,497 5063
- .... -Middle- 0.79 4622b 172,564 5289
セG@
-T.oP- 0.80 4163a 141,539 5178
-
Nセ@ Means 0.794494
162,533 5177African wood
セ@ -Bottom-
OA6
4575a 97,216 4422-Middle-
OA2
4653a 93,305 4261セ@ -T.oP-
OAO
5151b 107,157 4349Means 0.42
4793
4684
- セ@ Sengon
-Bott.om- 0.36 5278 101,652 4248
-
Mセ@ -Middle- 0.35 5332 100,852 4187-
)
-Top-Means
0.33
0.35
5498 5369
103,260
101,921
4464
4300
Notes: Mean values followed a letter denotes significant difference based on Tukey test in level 5%
-
)
-
)
Table 2 shows that ultrasonic vel.ocity of tectona W.ood is a range in 4163-4969- Nセ@ mls and for African wood and sengon are in a range 4574-5151 mls and 5278-5498
mis, respectively. Dynamic MOE are 141,539-173,497 kg/cm2, 93,305-107,157
- セ@
kg/cm2, 100,852-103,260 kg/cm2 for tect0na, African W.ood, and sengon, respectively.
セ@ Meanwhile, energy oftectona is a range 5063-5289 mY, African wood is 4261-4422
J
mv, and sengon is 4187-4464 mY. Energy is ability .of s.ound pr.opagation t.o pass a•
-:--.
.
It---
...;,
:.
medium. The results confirms previous study by Wahyuna (2005) which denotes that there is significant influence from horizontal position (heartwood and sapwood), but;,
no significant effects from vertical position in tree (bottom, middle and top) forultrasonic velocity propagation and dynamic MOE values .
..
..
セ@Direction of wave propagation (tangential, radial, and longitudinal) was
1
セ@observed to know the influence of that on non destructive variable (Table 3 and
it
Figure 6). The result depicts that means values in longitudinal or axial direction is-.
1.51 2.92 higher than transversal direction (radial and tangential). Meanwhile,
セNB@
1
セ@ MOEd in axial direction is 2.218.49 than transversal direction and 1.071.117 higher...,
in longitudinal direction than transversal for energy values. Bucur (1995) reported the '"
"'! '!J
same trend for some hardwood and softwood. Kollmann and Cote (1968) revealed
1
..., itNセthat ratio of acoustic wave propagation between parallel and perpendicular to grain
セ@ was 3.215.44 for spruce, pine, fir, maple beech, oak and lime species.
i
[image:19.614.103.504.317.506.2]NMセ@
Table 3. Mean values of density (p), ultrasonic velocity (Vus), dynamic MOE
セ@ (MOEd) and energy (e) of tectona wood, African wood and sengon wood beam (8xI2x200) cm in three direction of sound propagation
" セ@ Variable
Nセ@ p (g/cm3) Vus (m/s) MOEd (kg/cm2) e (m V)
セ@
Tectona
セ@ Longitudinal- 0.79a 4494a 162,325a 5177bRadial- 0.78a 3705b 116,545b 4559a
..., Nセ@ Tangential- 0.79a 2463c 53,495c 4555a
African wood
" j Longitudinal- 0.42a 4793a 99,225a 4684b
Radial- 0.42a 2987b 39,545b 4347ab
Mセ@ Tangential- 0.42a 1797c 14,355c 4222a
"
:,
SengonLongitudinal- 0.35a 5369a 101,921a 4300b
Zセ@ Radial- 0.34a 2326b 20,646b 3979aTangential- 0.34a 1520c 8,447c 3999a
Notes: Mean values followed a letter denotes significant difference based on Tukey test in level 5%
)
j
j
Mセ@
セ@セ@
:-".
11•
»
»
セ@
.
••
セBBMMBBMMセBMM _ . . __.__.... _..•.. _.•..•
-•
..
jI-
ャッョァゥエセゥョ。ャ \,tus -. . Radial Vus _ Tangential Vus1...
Longitudinal e IIRadial e ___ Tangential e..
セMMMNセセMMMセセMセセM 6000 tMMセBMBBGMG@ 5000 5000..
,.,
-, ,-セ
..
4000 ; セ@3000l
j3000
..., > . G>
2000 2000\
1000 . 1000
-,
1 . •
o o
Tectona African wood Sengon
, Zセ@
Nセ@
: Nセ@ Figure 6. Histogram of direction wave propagation (longitudinal, radial, and
tangential) for ultrasonic velocity and energy in three species
GNセ@...,
セ@ Table 4 shows that the fastest ultrasonic velocity is 5727 mls for 36 cm length
- ,ij in tectona and 6091 mls and 6505 mls in African wood and sengon, respectively.
Meanwhile, the highest dynamic MOE is for 36 cm length followed by 77 cm, 118
Nセ@
cm, 159 cm and 200 cm for all kinds' species. , Nセ@
セ@: ; / Table 4. Mean values of density (p), ultrasonic velocity (Vus), dynamic MOE
(MOEd) and energy (e) of tectona wood, African wood and sengon wood in
Nセ@ several length beams (8x12x200) cm
Beam length
セ@ セ@ 200cm 159cm 118 cm 77cm 36cm
Tectona
Zセ@ _p (g/cm3)_ 0.71a 0.73a 0.74a 0.75a 0.78a
Lセ@ Vus (m/s)
-MOEd (kg/cm2 )
4493a 162,285a 4637a 162,533a 4856a 178,964ab 4861ab 182.260ab 5727b 239,417b Ii
:;;/
e (mv)-African wood
5177a 5618bc 5591bc 5303ab 5713c
セ@ !) _p (g/cm3)_ 0.38a 0.39a OAOa OA2a OA2a
セ@ Nセ@
Vus
(m/s)-MOEd (kg/cm2 )
4793a 99,226a 4938ab 105,586bc 5149bc 109,632bc 5406c 118.207c 6091d 146,451d
e 4684a 4994ab 4871a 5099ab 5348b
セ@ Sengon
セ@ p (g/cm3)_ Vus (m/s)- 5369a 0.31a 0.33ab 5492a 5660ab 0.34ab 0.34ab 5856b 0.34ab 6505c
Zセ@MOEd (kg/cm2) - e (mv)-101,921a 4300a lO4,31la 4451a 109,046ab 4738ab 117.395b 4778ab 134,535c 4981b Notes: Mean values followed a letter denotes significant difference based on Tukey test in level 5% - :j
セ@ Since the modulus of elasticity is directly proportional to the density, theNセ@ sound velocity should be independent from density (Kollman dan Cote, 1968). The
[image:20.614.110.500.20.190.2] [image:20.614.104.512.372.603.2]
;,
•
i :iI
-, セ@ Lセ@
セ@ Gセ@
セ@
セ@
·i
, Nセ@
.,
7, Lセ@
.,
-.セ@0/
セ@
Lセ@
セ@
- !)
!)
Gセ@
;;;;.>
•
セ@
""
セ@
- !'\
セ@
Nセ@
j
Mセ@
セ@セ@
セ@
•
セ@
•
セ
..
セ@velocity of propagation is still correlated to the modulus of elasticity, but energy will be correlated to the local singularities (knots, grain, and degradation area) which cause acoustic wave attenuation. In fact, the energy damping of the waves is directly dependant of local' singularities (Sandoz et ai., 2002). In the case of density, as mentioned before, Mishiro (1996) indicated three types of relationship between ultrasonic velocity and density (for different Japanese species with density ranging between 90 and 1300 kg/m3): sound velocity increases with density, or it is not affected by density, or it decreases with density. In this study, the lower density the faster of ultrasonic velocity was observed for comparing all wood species. However, for each species within in wood for different length beam, the ultrasonic velocity has been found to be increase with increasing density. It might be due to the shorter dimension has fewer wood defects (e.g. knots)
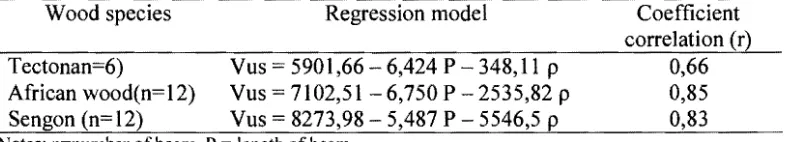
[image:21.614.113.508.372.443.2]The regression analyses were tested to quantify relationship of length of beam and on density ultrasonic velocity (Table 5). In long solid rods, the thickness of which may be neglected compared with the wave length in the case of the propagation of longitudinal waves along axis the rods (Kollmann dan Cote, 1968; Bucur, 1995; Iswindarto, 2006).
Tabel 5. Regression model for relationship between ultrasonic velocity, length beam and densitr
Wood species Regression model Coefficient
correlation (r) Tectonan=6) Vus = 5901,66 6,424 P 348,11 P 0,66 African wood(n=12) Vus = 7102,51 6,750 P 2535,82 P 0,85 Sengon (n=12) Vus = 8273,98 5,487 P 5546,5 P 0,83
Notes: n=number of beam, P = length of beam
Small specimen evaluation Static and dynamic bending test
Analyses statistic performed shows in Table 6. for variable of physical properties and both dynamic and static bending strength properties. The mean values found for the properties studied here are compatible with those usually found in experiments with the same species (Karlinasari, 2005 and Mulyadi, 2006).
i
••
-Table 6. Mean values of physical and bending strength properties in small specimen
:.
for tectona wood, African wood, and sengon woodVariable
:iI Me p Vus MOEd MOEs MOR
(%) Hセ」ュSI@ (mls) (kglcm2) (kglcm2) (Kglcm2)
,
.. '!
..
TectonaMeans 15.8 0.76 5181 205,880 96,157 628
セ@ (20) (270) (270) (270) (113/132) (113/132)
SD 1.9 0.09 562 37,700 18,203 125
セ@ eV(%) 11.8 11.6 10.8 17.5 18.9 2.0
Maximum 19.5 0.96 6403 320,729 148,060 996
セ@ セ@ Minimum 12.0 0.55 3657 39,697 45,098 275
African wood
セ@ Means 12.4 0.43 5420 129,956 62,616 423
(20) (197) (197) (197) (73) (73)
1 •
' SD l.l 0,06 648 28,818 20,980 125
ev 9.2 13.27 11.9 22.2 33.5 29.5
セ@ Maximum 14.0 0.76 6830 217,518 118,870 835
Minimum 9.4 0.20 4242 75,774 20,212 189
セ@ Sengon
Means 14.6 0.32 6416 134,776 64,510 396
!
(20) (272) (272) (272) (1431144) (1431144)SD 1.8 0.04 319 16,387 12,371 90
セ@ ev 12.0 13.3 4.9 12.0 19.2 22.7
Maximum 19.0 0.48 7133 189,422 108,286 611
セ@ Minimum 12.3 0.25 5606 92,712 32,127 181
Notes: SD = standard deviation; CV = coefficient of variation; number in parentheses denotes number
セ@ of specimen (n)
セ@ The results of MOEd values were 50% higher than those MOEs values. It is
セ@ considered to because of microstructural characteristic and viscoleatic properties of
wood. The accuracy of the determination of MOE wood by the ultrasonic test is said
セ@
to be higher than that static test. The difference may be due to the rate of loading ....,
! static test in which creep effects influence the measured static deflection and also may
!
be related to the viscoelastic nature wood (Bodig and Jayne, 1982 and Madson, 1992). 3
Wood is highly impactabsorbent material. In the vibration of wood species, the !
restored elastic force is proportional to the velocity. Therefore, when force is applied for a short time, the material shows a solid elastic behavior, with longer application of!
force; its behavior is equal to that of a viscous liquid. This behavior is more evident in
!
static bending test (long duration) than in ultrasonic test. Thus, the modulus of- i elasticity determined by the ultrasonic method is usually greater than that obtained in
..セ@ static deflection (Oliveira et al. 2002). According to Bodig and Jayne (1982) and
Tsoumis (1991), MOE obtained by vibration test proved to be 515 percent higher
Zセ@
than static test. Meanwhile, Bucur (1995) reported that the value of MOE determined
i
from dynamic was about 10 percent higher than static test for spruce and beech. j
j 14
.I J _ ;J
[image:22.614.113.498.45.328.2]
Oliveira, et al. (2002) used ultrasonic method and obtained 1720 percent higher-
values than static test values for Brazilians wood species. Karlinasari et al. (2005)--
lit evaluated MOE of six tropical wood species (sengon, meranti, manii, mangium,agathis, and pine) and found that dynamic MOE of small clear specimen was about -
..
.'
'!:'50% greater than the static MOE when it is not corrected by Poisson's coefficient. セ@
Relationship of velocity and density on bending strength
セ@
. Relationship between velocity and dynamic MOE, static bending MOE, and
'!'
MOR were analyzed for each species, and the regression parameters are presented in
[image:23.614.106.507.378.659.2]Mセ@
Table 7.
- セ@ Static bending MOE and MOR appeared statistically better correlated with
Mセ@ both density and ultrasonic velocity than only single variable of ultrasonic velocity for both the combined data of three species and sengon wood. For tectona wood,
セ@
multivariable regression model of density and ultrasonic velocity seemed no
!)
difference correlated with solely single variable of ultrasonic velocity. The results セ@
followed the general relationship between density and mechanical properties. セ@ Meanwhile, the comparatively lower correlation coefficient for African wood might
be due to many knots was found on sample.
!>
Table 7. Summary of regression parameters for regression of ultrasonic velocity and
-
セ@ density on static bending MOE and MOR for the three sE,ecies
セ@ species Wood Regression model R R! Significance of model セ@ (a 0.05)
1. Tectona (n=113)
!) MOEs = 20.546 Vus 10797
MOEs 31.108 Vus + 96585.52 P 139826
0.54 0.63
0.29 0.40
0.001** 0.000**
!;\ MOR = 0.11 Vus + 55
MOR = 0.175 Vus + 597.263 £. - 742.884
0.47 0.51
0.17 0.26
0.000** 0.000**
セ@ !)
セ@!)
-
セ@2. African wood (n=73)
MOEs 1.073 Vus + 56594 0.02 0.0006 0.839 ns
MOEs = 1.749 Vus + 50992.661 P + 30095.655 0.12 0.14 0.620 ns
MOR 0.0049 Vus + 451.099 0.19 0.00 0.875 ns
MOR = 0.0013 Vus + 269.926 £. + 310.883 0.10 0.01 0.688 ns 3. Sengon (n=143)
MOEs = 8.4998 Vus + 117522 0.15 0.02 0.078 ns MOEs 9.637 Vus + 199315.1 P 6321.0 0.71 0.50 0.000 **
MOR 0.142 Vus + 1284.184 0.34 0.12 0.000**
MOR = 0.00244 Vus + 1538 £. - 110.724 0.81 0.661 0.000** セ@
Mセ@
セ@
セ@
Mセ@
:
セ@Nセ@
...
:!)All species (n=329)
MOEs 12.205 Vus + 145066
MOEs= 18.805 Vus+ 118301 p"':'93339.9 MOR=0.108Vus+1l01.906
MOR 0.0865 Vus + 742.132 £. 393.668
0.32 0.10 0.000** 0.73 0.53 0.000** 0.42 0.18 0.000** 0.73 0.54 0,000**
Notes: r= coefficient correlation,
l
= coefficient determination, os = no significance; **= very sig.15
__
•
•
-..
The regression models developed for each two species (without African wood)- ,
..
as well as for the combined data were highly statistically significant, except for solelyセ@
Zセ@
, セ@
セ@
Vus for predicting the static bending MOE.
Figure 7, 8, 9, 10, 11, 12, 13 and 14 graphically present data distributions of relationship of ultrasonic velocity on static bending MOE and MOR for each of three species.
NLセ@
セ@
セ@--
セ@セ@
セ@
セ@
セ@
セ@
セ@
!J
セ@
セ@
0:.. セ@
セ@ セ@
セ@ !)
!>
- !)
- !J
セ@Mセ@
セ@
セ@
Nセ@
Mセ@
セ@
Zセ@160,000
140,000
120,000
セ@セ@ 100,000
セ@ 80,000
!
$MNMMMセMM、NMN@
•
1II
W • •
MMKMMセMM
0 60,000
:ill
40,000
20,000
0
3,000 3,500 4,000 4,500 5,000 5,500 6,000 6,500
V (m/s)
セ⦅@ セセセN@
⦅セ@ Nセᄋ]QDェ[ᄋMAN
. r
セ@セ@セ@
Mセ@ Mセ@
•
Figure 7. Relationship between Vus and MOEs oftectona wood
セセMNBセセMセセMMセMM MNMMNセセセNセセMMMMセMセMセMMMMセMMNMMMMMNMセセMM ..
1,200
1,000 .
...
•
---MMセMMMMNM
....
-.
"€" 800
__
-
..,..:'*_
MセM....
•
-
イセZセNャNGB
....
l
セ@u 600 jtセ@ MMMNセM•
•
...
セ••• ':..
.;-t--::e 400
+.
セ@ セMMMKセM•
0
. - 1
200
•
ッKMMMMMMGMMMMMセMMMMMセMMMMLMセセMLMM MMイMMMMMセ@
3,000 3,500 4,000 4,500 5,000 5,500 6,000 6,500
V (m/s)
Figure 8. Relationship between Vus and MOR oftectona wood
III
[image:24.614.159.464.130.310.2] [image:24.614.170.460.377.546.2]:::::r= .....
•
NMGMMセMM .100,000 I
•
•
. ' + + . . :
"Eu 80 000 .
j
• + . . . : 0 : : ; 0 ; ' " • • • Ith ' . • + + +"""
.:.: +.+.,.. . , . . . ,
; 6 0 , 0 0 0 . • • + ....セNN '
w 40,000
+.
⦅セ
•.:_.
セ
___• .
...
++ ,+
20,000 • セM .
-o
MMMMLセMセMM...
3,000 3,500 4,000 4,500 5,000 5,500 6,000 6,500 7,000
[image:25.614.161.466.12.185.2]V (m/s)
Figure 9. Relationship between Vus and MOEs of African wood
900
800
•
•
700
N@
.
"
+.
セ@
....•
" ' _••••
_
• *
....
c • •
セ@
500 , : ' • ', . .l' '.
Nセ
.-"" 600セ@
" ' . . . . ._;:;""'1
I...
,. .
セ@
o
3001
,
•..
_3
..,. 200 100
i
c __o
3,000 3,500 4,000 4,500 5,000 5,500 6,000 6,500 7,000
[image:25.614.163.465.218.391.2]V (m/s)
Figure 10. Relationship between Vus MOR of African wood
120,000 r
I
•
100 000 + ..._
-t i •
! セ
1
80,000 ,.::a·····
; 60,000 . Mセ@
w • •
セ@ 40 000 , MセMMJMKMMMMMN@
..
.
20,000
3,000 3,500 4,000 4,500 5,000 5,500 6,000 6,500 7,000
V (m/s)
Figure 11. Relationship between Vus and MOEs of sengon wood
..iij;"",:;';...
IIi'''':';'iOr-o
LMセMMMNMMMM [image:25.614.167.461.431.594.2]
4 セ@..
..
..
-... セ@ i;J セ@ , セ@ Bセ@ . /
セ@
セ@ セ@ セ@
セ@ セ@ セ@ セ@ セ@ !) , セ@ セ@ セ@ セ@ セ@ セ@
セ@ セ@ , セ@
セ@ ., セ@ セ@ セセ@
•
..
セ@..
..
セ@ 700600 Nセ ...MNセ ..セ ...セセMセセセM
セ@
500..._
.a,
400;.
15
300::iii 200
[image:26.615.164.459.28.192.2] [image:26.615.175.454.232.392.2] [image:26.615.168.454.436.602.2]100 KMMセM ..セセMMMセM ..MMセセM
...
セセN⦅セGNAカNセ@
..
Mjセセ@
..
. .-.._... .,. ..Mセ@ ....
...
⦅セ
___..LL!__
..
J.
NMセNMMMセセ@ MMGセGMMMセNセセセセセMセM ..
oKMMセMMセセMMセMMセLセMMLMMMLMᄋMᄋᄋᄋᄋLMMセセ@
3,000 3,500 4,000 4,500 5,000 5,500 6,000 6,500 7,000
V (mls)
Figure 12. Relationship between Vus and MOR ofsengon wood
300,000 tGMMセセGセMMG@ NセセセNセMセ@
•
250,000
•
..
•
•
セ@ 200,000
u
i»
; 150,000
w
'"
•
セ@ 100,000':'
•
50,000 KMNMセ@ セMMセMセMMセMM
•
セ@ セNZNセ•
..
1;.o KMNセLNML
.,...
···1' ...セLNMBセ@3,000 3,500 4,000 4,500 5,000 5,500 6,000 6,500 7,000
V (m/s) Figure 13, Relationship between Vus and MOEs of all wood species 1200 1000 800 "€" セ@ セ@ 600 II:: 0 :Iii 400 200
.
NセNAャG.. ,.
••••
セ@NBGゥ@
.
ZNセ@
セ
..
..
セ
....
セ
. • .
セ@ G[NGセ@
セZ@
! ...
セゥエᄋ@
セセNN@
..•.
J
. .. ..
セセセセMMNMセ@ セ@ ...:..ッKMMᄋᄋセᄋᄋMセMMMMセMᄋᄋᄋセMMMセセMMセMᄋᄋᄋᄋセMセ@
3.000 3,500 4,000 4,500 5,000 5,500 6,000 6,500 7,000
V (m/s)
Figure 14, Relationship between Vus and MOR of all wood species
...セ@
III
•
Relationship of dynamic MOE on static bending MOE and MOR
Dynamic MOE and static bending MOE were each separately correlated toセ@ MaR for each ofthree species, and the results are presented in Table 8 and Figure 15, 16, l7and 18.
-;,
.
セ@ Table 8. Summary of regression parameters for regression of dynamic MOE on static
Nセ@ 「・ョ、ゥョセoe@ and MaR for the three species
Wood Regression model R R! Significance
species of model
セ@3)
Mセ@
MOEs = 0.399 MOEd + 11976,347 0.64 0.41 0.000**
MOR 0.0023 MOEd + 145.552 0.53 0.28 0.000**
セ@ MOR = 0.0044 MOEs + 203.086 0.64 0.41 0.000**
Mセ@ 2. African wood (n=73)
MOEs 0.0949 MOEd +48962.252 0.12 0.01 0.309 ns
MOR = 0.00032 MOEd + 376.575 0.07 0.05 0.558 ns
セ@ MOR = 0.0051 MOEs + 102.36 0.86 0.74 0.000**
セ@ 3. Sengon (n=143) MOEs = 0.511 MOEd + 4122.01 0.68 0.47 0.000**
MOR = 0.00378 MOEd - 111.193 0.70 0.49 0.000**
セ@ MOR 0.0061 MOEs + 0.9655 0.84 0.71 0.000**
All species (n=329)
Mセ@
MOEs = 0.403 MOEd + 9438.954 0.76 0.57 0.000** MOR 0.00272 MOEd + 38.709 0.75 0.57 0.000**
セ@ MOR = 0.0059 MOEs + 39.839 0.87 0.75 0.000**
Notes: r= correlation coefficient,
l
determination coefficient, ns no significance;**
= very sig.Mセ@
Mセ@
The results for the individual species show that the correlation between static
Mセ@ bending MOE and MaR was only slightly higher than that between dynamic MOE
and MaR, except for African wood which have not good correlation for dynamic
セ@
MOE and MaR relationship. For the combined data, the correlation coefficient =
セ@
obtained for the regression of dynamic MOE on static bending MOEs was 0.76, and
-
セ@ those were 0.75 and 0.87 for the regression of dynamic MOE and static bending- セ@ strength MOE on MaR, respectively. The regression models developed for the
Mセ@ relationship of dynamic MOE on static bending MOE and MaR as well as between
static bending MOE and MaR were all highly statistically significant (u=0.05),
セ@
except for the case of African wood on relation of dynamic MOE on static bending
I!:
-MOE and MaR. The statistically high correlation (r >0.75) and the highly significant
Mセ@
regression models developed for the combined data for the three species seemingly
セ@
-
indicate that both static bending MOE and dynamic MOE may be good indicator forthe MaR of some tropical hardwoods. The trend of the correlation and significant
..
セ@
19
セ@
-iii
..
セ@ ,;;
[image:27.614.104.501.128.358.2];
models obtained in this study compares well with similar study by Karlinasari et at.,
-
(2005).!.,
Evaluation of wood condition
Nセ
..
-, セ@ Another approached to evaluate the condition of wood quality is to use
mapping wood condition itself. In this study, we try to do with ArcView GIS software
Qセ@
to depict this condition. Since this method still preliminary study, we try only for one
NLセ@
sample. The result shows that is possibility to present wood condition with this
=
セ@
method as presented in Figure 19.,.;)
セセ@
セ@
,
.;)セ@ .;)
,.;)
ャセ@
Lセ@
1 セ@
1.;)
.;)
セ@
, セ@
, セ@
セ@ .;)
セ@ -!)
..
セ@Lセ@
Lセ@
Lセ@
Wセ@
Gセ@
..
20セ@
... セG@
-NNセMM
,...i ....· ..
セN@ 1.1 1.1 .. .I , .I , J j J 1.1 , .J j J j ,
, , ,
, I セNj@ lセ@ I " j,
., j _,J I Lセセ@ 1 1,
....,
"" I J.I'
HセI@
,'J ,'J
\l),')
セセ@ ャセ@ llJ tJ) \!J \!J セ@ セ@ セ@\!i
"
l!J セ@ セ@
\!J
l.!J
l!J l!J セ@ I!) i,!) I!) I.!) I!) セ@ I!) II)'I'
0')160,000 ' 1 - 1200 1200 Mセ@
: • +. I
140,000 +- • : 0
:1
セ
: : : : I·セNセセセセセセNセ@
セL@
.
..
セ@ セ@; ED,OOJ • . . . • :
セ@ 6O,000! •
0··
m_l
>
ZセlMMMMMMᄋ@
..
セ@
"E u
l
a:
0
:::;
1000 800 600 400 200 0
'
..
I
...
セセ@..
i+ '"
...
セ@ " . •TNセL@
KMMMMMMMMMセ ... y •
•
N
E
u
0.
セ@
a:
0
:::;
1000 800
600
•
400
200
.....
セM ..
-Mセ@
.
Lu".
--0
\) Q:l\) Q:l\) Q:l\) Q:l\) \)Q:l
.
..
••
••
=1
•
\)Q:l \)Q:l \)Q:l
o 50,000 100,000 150,000 200,000 250,000 300,000 0 50,000 100,000 150,000 200,000 250,000 300,000 '1\)' セL@ セL@ セL@ セG@ セG@ セG@ セG@
r.u:d (kgan') MOEd (kg/em') MOEs (kg/em')
Figure 15. Relationship between dynamic MOE, static bending MOE, and MOR oftectona wood
140,000 I •
120,000 + _ _ t _ . .
800+1-: 1 . 1I • • 900 1
セ@
700 •
セ@ 100,000 1
"E800
u i •
1::
I ..
セBNエZNZ@
NMMセ
セ@ 80,(0) •
r. ·.,:::. •
••
II •
a
500セN
セTPP
セ@ 60,000
.+.
:1
f# ZNセa: 400 , • +""0 • I
セSPP@
::::E 40,000 "1••
-o
t
· · . ·
20020,000 ... 1
セセe@
.:";"
100
oKMMMセMMセM
50,000 100,000 150,000 200,000 250,000 50,000 100,000 150,000 200,000 250,000 20,000 40,000 60,000 80,000 100,000 120,000 140,000
[image:29.792.125.778.130.263.2]MOEd (kg/em', MOEd (kg/em', MOEs (kg/em',
Figure 16. Relationship between dynamic MOE, static bending MOE, and MOR of African wood
[image:29.792.125.760.317.441.2]at
\J) "I) \IJ \..) il) \.) I!i I!i
IJJ
セ@ セ@\!J
セ@\!J
セ@ セ@ セ@ セ@\!J
® ® \!J
I!i I!i
セ@I!i
\!)\!J \!J
\!) i')i"
,I)"E'" u C
o!.
'"
w
0 ::E
120,000 100,000 80,000 . 60,000 40,000
•• • • I
Nセ
....
..
.•
セセ@
セMMZNセ セ@ セN@ セセセセセセセセセセセセセセセセセセセ@
20,000'" " ' ' '
-o '
o 50,000 100,000 150,000 200,000
MOEd (kg/em')
600
I:
700
QセLセBGセBGセL⦅セBGセBGセLLセNLMセMN][ゥjNヲッュ@
200 : . I
, ••••* I
100 •
o j
o 50,000 100,000 150,000 200,000
MOE<! (kgIcm2)
WᄚotMGセGGGセMGGセMMGGGMMセMᄋMGM
E ::
イMMMMMMGMセセセM⦅]BM]MMMMMlBj@
u
0,400
セ@
0:: 300
o
:Ii 200 ゥGMᄋMMセᄋMMMlM
1 0 0 r " " " " " " " ' "
ッセセ]MセMMセMMセセMMセ@
o 20,000 40,000 60,000 80,000 100,000 120,0MOEs (kgIcm2)
Figure 17. Relationship between dynamic MOE, static bending MOE, and MOR of sengon wood
160,000 140,000' 120,000
-f
100,000セ@ 60,000'
.n
o 60,000, ::E 40,000 + GBャセセN⦅G[@ 20,000 .
o
o 50,000 100,000 150,000 200,000 250,000 300,000
MOEd (kg/em2)
1200r'"
1000 t",
-I
l'
600j "" •セ
i"
Cit . . . .• • •
i
600 セLMMMMM . ; : ; . .•••
#:'\
::E 400 I
セG[セュ
•
200
L_.
セBBBGMGMNMNMZセセセセセMMQ@
I
o
1-o 50,000 100,000 150,000