Hochschule
Rosenheim
University of Applied Sciences
Prepared at: Summer Semester 2014
Submitted by: Mohd Firdaus bin Mohd Ab Halim
Student ID: 803966
SUPERVISOR 1: PROFESSOR MIKE ZEHNER
SUPERVISOR 2: PROFESSOR DR. ING MARTIN NEUMAIER
©
Universiti t・セゥォ。ャ@ Malaysia Melaka .Declaration
Hochschule Rosenheim
University of Applied Sciences
AUTHOR DECLARATION
I hereby declare that the project entitled " GRID FREQUENCY STABILITY STUDY"
submitted to the University of Applied Science Rosenheim is a record of an original work
done by me under the guidance of Prof. Mike Zehner and Prof. Martin Neumaeir. This
project is submitted in the partial fulfillment of the requirement for the award of the degree of
Master Electrical/Electronic and Information Technology. The result embodied in this thesis
has not been submitted to any other Institution for the award of any degree.
Mohd Firdaus bin Mohd Ab Halim ID: 803966
Abstract
Abstract
This thesis is focus on the behavior of the electrical grid frequency in European country.
There are many researches' conducted dedicated into maintaining the electricity supply
versus the demand through penetration of more renewable energy, but this thesis will be
looking into how does the grid frequency behaves in day to day and what causes it to
fluctuates or is there any kind of signal pattern that can be analyzed and perhaps use it to
provide more information towards the grid stability control. This research reviews the
strategy of managing the electrical grid stability adopted the European Energy authority and
other method employed by other modem country, for example the United States or The
United Kingdom. A frequency measurement device is designed in our own facility to gather
as much data as time permit because there is no raw grid frequency data published openly by
any researcher thus far. The studies also covers factor contributes to the grid instability,
future electricity model, various frequency control techniques and case study, from the
journal and conference paper. Towards the end of the study, multiple frequency plot will be
presented and discussed so that it can provide valuable the authorize institution, to maintain
network grid stability.
ii
Table of Content
ACKNOWLEDGEMENT
I have taken enormous efforts in this thesis. However, it would be difficult without the kind
support and help of many individuals and organizations. I would like to extend my sincere
thanks to all of them.
I am highly indebted to Professor Mike Zehner and Professor Martin Neumaier for their
guidance and supervision as well as for providing necessary resources especially the working
office for me at D building at the University of Applied Science Rosenheim.
Not to forget Professor Prof. Werner Braatz, for so his advice and guidance throughout my
study in Rosenheim, extending my gratitude to Prof. Dr.-Ing. Holger Stahl and Madam Sylvia
Bergmaier for organizing such a wonderful Master Program in Rosenheim.
Very special thanks to Prof. Dr.-lng. Simon Schramm, whom had shared his frequency data
for the purpose of reference data for our measurement validation.
I would like to express my gratitude towards my wife and my son for always reminding me to
work hard every day for this project and University Teknikal Malaysia Melaka for their kind
co-operation and encouragement which help me in the completion of this project. I would
like to express my special gratitude and thanks to Study Leave Division for their relentless
support during my study leave time in Germany.
Many thanks to all Malaysia students in Rosenheim for giving me valuable advice and guide
me during my stay at Rosenheim.
My thanks and appreciations also go to Sam Langdon- Arms in helping me to get familiar
Table of Content
TABLE OF CONTENT
Abbreviation and acronyms ... vii
List Of Tables And Figure ... ix
Figures ... ix
Table ... xi
Chapter 1 Introduction ... 1
Chapter 2 Thesis Planning ... 4
2.1 Gantt Chart ... 4
2.2 Explanation ... 4
Chapter 3 Grid Frequency Regulation ... 5
3.1 Overview of European Transmission System ... 5
3.2 North America (Texas) Grid Frequency Regulation ... 5
3.3 Grid Frequency Regulation Issues ... 6
3.4 Renewable Energy Scenario in Germany ... -... 8
3.5 Effect of Wind Turbine and Solar Power Towards Grid Stability ... 9
3.6 ENERGY Trading ... .. 12
Chapter 4 Dynamic Demand ... 14
4.1 World Electricity Demand Pattern ... ... ... 14
4.2 Frequency Adaptive Power Energy Reschedules (FAPER) ... 14
4.3 Dynamic Demand Technology in UK ... 15
4.4 Dynamic Demand Home Appliance as Frequency Regulation ... 16
Chapter 5 Alternatives Method in Stabilizing Power Grid ... . 18
5.1 Smart Metering ... 18
5.2 Rolling Blackout or Load Shedding ... 18
5.3 Energy Storage as Frequency Regulation ... 19
Chapter 6 Development of the Grid Frequency Measurement Device ... 22
6.1 Literature about Grid Frequency Measurement ... 22
Table of Content
6.1.1 Frequency Disturbance Recorder ... ... .... ... ... ... ... ... ... .... ... ... : ... ... ... 22
6.1.2 Other Frequency Measurement Site ... ... ... ... ... .... .. ... .... .. ... ... .. .. ... ... .... .. ... .. ... 23
6.2 Input Signal Design ... ... ... ... ... 24
6.3 Testing Arduino Board And Sketch ... 26
6.4 Arduino Built-In Clock ... 2 7 6.5 GoBetwino Data Logging to File ... 34
6.6 Hardware Setup ... 35
6. 7 Result Validation ... 36
6. 7.1 Graph Minute Data Validation ... ... .... .. ... ... ... ... ... .... .. ... ... . 36
6. 7.2 Understanding the Measurement Data Differences ... ... .. ... ... .. ... ... ... .. .... ... ... ... .... ... ... 37
6.7.3 Data Durability at Larger Time Frame ... ... ... ... .... .. ... ... ... ... ... ... .. ... 39
6.7.4 Solution for Data Logging Durability ... .. ... ... .. ... ... .. .. ... ... ... ... .... ... ... . 39
6.7.4 .1 Processing Program Version 2.2 .. ... .. ... .... ... .. ... .... ... ... ... ... ... ... 40
6.8 Measurement Device Maintenance ... 42
Chapter 7 Frequency Behaviors Analysis ... 44
7.1 Data Analysis Method ... 44
7.1.1 Data logging information ... ... ... ... ... .. ... ... ... ... ... ... 44
7.2 Paper Review on Grid Frequency predictability study ... ... .. ... 44
7.3 Data Analysis perform by Markus Jaschisnky ... .46
7.4 Carpet Plot by Thomas Gobmaier ... 47
7.5 Grid Frequency Variation Study by ENTSO-E.. ... 48
7.5.1 Criteria for Stable Grid Frequency ... ... .. ... ... ... ... ... .... 48
7.5.2 Case Study December 2011 ... ... ... ... ... ... ... .... ... .... ... ... ... .... ... ... ... .... 49
7.S.2.l lntroduction ... ... .... ... .... ... ... ... .. ... ... .. ... ... .. ... ... ... .... ... .... 49
7.5.2.2 Specific Event of the Frequency Deviation .... ... .... ... ... ... ... .... .... ... .. .... ... ... ... SO 7.5.2.3 Cause of Frequent Frequency Variation ... ... ... ... ... ... .... 51
7.5.2.4 Proposed Measures ... .... .. ... ... .... ... .. ... ... ... ... 52
7.6 Data Analysis Method in General versus Period ... 54
7.6.1 One Minute Analysis .... ... ... ... ... ... .... ... ... ... ... ... 54
7.6.2 Fifteen Minutes Analysis ... ... .. ... ... ... ... 56
7.6.3 Hourly Analysis ... ... ... ... ... .. ... .. ... ... ... .... ... ... 57
7.6.3.l Hourly Analysis Discussion ... ... .. ... ... ... ... ... .... ... ... .. 60
7.6.4 Day to Day Comparison ... ... ... ... .. ... .. ... ... ... .. ... ... ... ... .. ... ... ... .. . 61
7.6.5 Specific hour frequency data early morning and late evening on smaller time frame ... .. ... ... .. 64
7.6.5.1 Scatter Plot Hourly Average Early Morning and Late Evening ... .. ... .. .. ... ... 64
7.6.5.2 Box Plot Hourly Average Early Morning and Late Evening ... .... ... ... .... .. ... 65
7.6.5.3 Normal Distribution Plot Hourly Average Early Morning and Late Evening ... ... ... ... .. 66
Table of Content
8.1 Work done ... 69
8.2 Analysis outcome ... 70
Chapter 9 REFERENCE ... 74
Chapter 10 Appendices ... 77
A. Sketches to perform Analog Read on Arduino pin 0 ... 77
8. Matlab program code to generate the sampling voltage graph ... 78
C. Sketches to Perform Frequency Measurement with Improved Accuracy Method ... 78
D Frequency Distribution Tables for Figure 7-11 ... ... ... ... .. 80
E Frequency Distribution Tables for Figure 7-15 ... 81
F Frequency Plot from 28 July to 9 August ... .. ... 82
Fl MINIMUM Hourly Frequency ... ... ... 82
F2 maximum Hourly Frequency ... 82
G Gnu Plot Code for carpet plot ... 83
Abbreviation and Acronyms
ABBREVIATION AND ACRONYMS
a) AC
b) ADC
c) AUFLS
d) CPU
e) DDC
f) DEC
g) DG
h) EEPROM
i) EEX
j) EMS
k) ENTSO-E
l) EPEX
m)ERCOT
n) ESB
o) FAPER
p) FCDM
q) FDRS
r) FNN
s) FTP
t) GW
u) IDE
v) KV
w) mHz
x) MVA
y) PC
z) PV
aa) REG
bb)RMSE
cc) SCADA
dd)SGM
Alternating Current
Analog Digital Converter
Automatic Under-Frequency Load Shedding
Central Processing Unit
Dynamic Demand Control)
Decimal
Distribution Generation
Electrically Erasable Programmable Read-Only Memory
European Energy Exchange
Energy Management System
European Network Transmission System Operator For Electricity
European Power Exchange
Electric Reliability Council Of Texas
Electricity Supply Board
Frequency Adaptive Power Energy Reschedules
Frequency Response By Demand Management
Frequency Disturbance Recorders
Forum Network Technology I Network Operation
File Transfer Protocol
Giga Watt
Integrated Development Environment
Kilo Volt
mili Hertz
Mega Volt Ampere
Personal Computer
Photovoltaic
Regulation Reserve
Root Mean Square Error
Supervisory Control And Data Acquisition
ee) TSO
ff) UCTE
gg)VAC
hh)VDE
ii) WTG
Abbreviation and Acronyms
Transmission System Operator
Union For The Co-Ordination Of Transmission Of Electricity
Voltage Alternating Current
Association for Electrical, Electronic & Information Technologies
Wind Turbine Generator
List of Tables and Figures
LIST
OFT
ABLES
AND
FIGURE
FIGURES
Figure 1-1 Map of European System Operator by Group ... 1
Figure 1-2 EU27 Electricity production distributed by source ... 2
Figure 1-3 Number of incident where the frequency if beyond the normal operation 49.9Hz to 50.lHz. Source: Statnett ... 3
Figure 2-1 Subject Code 9591 Master Thesis Schedule ... 4
Figure 3-1 Regulating Reserve Classification versus response time ... 5
Figure 3-2 SCADA/EMS System Block Diagram ... 6
Figure 3-3 Grid Tie-Inverter Block Diagram ... 7
Figure 3-4 Solar PV growth in Germany by year ... 8
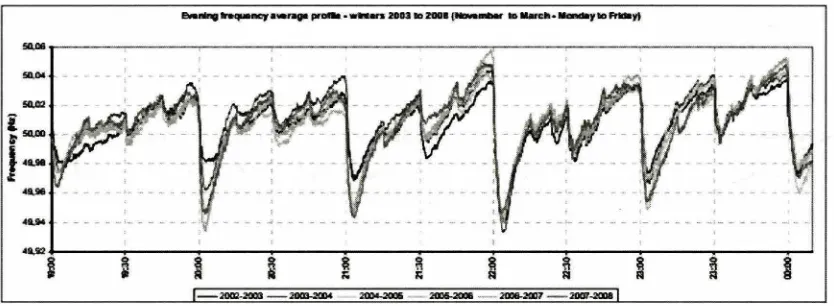
Figure 3-5 Frequency deviation in the evening from 2002-2008 ... 9
Figure 3-6 typical power output distribution of wind mill driven at optimum location (blue) and standard location source [10] (red) ... 10
Figure 3-7 System frequency dynamics when WTGs participate in system frequency regulation function source [10] ... 10
Figure 3-8 Frequency Data of 15% PV penetration at two SGMl (slow) and SGM2 (fast) source [12] ... 10
Figure 3-9 Frequency Data of 30% PV penetration at two SGMl (slow) and SGM2 (fast source [12] ... 10
Figure 3-10 Generation unit behavior in the schedule time frame source Transelectrica ... 13
Figure 3-11 Power system market flows of operation source University of Stuttgart.. ... 13
Figure 4-1 FAPER System Overview ... 15
Figure 4-2 Operation Strategy of Dynamically Controlled Refrigerato Source [18] ... 16
Figure 4-3 Comparison simulated system frequency regulates by dynamic demand versus spinning reserve Source [18] ... 16
Figure5-1 Frequency Deviation without Energy Storage Source [21] ... 20
Figure 5-2 Figure Frequency Deviation with Energy Storage Source [21) ... 20
Figure 5-3 Typical Flywheel main component.. ... 21
Figure 6-1 FDR System Block Diagram Source [23) ... 23
Figure 6-2 FDR Equipment ... 23
Figure 6-3 Schematic diagram to produce desired output voltage ... 25
Figure 6-4Voltage signal of desired output voltage ... 25
Figure 6-5 Setup for trial measurement ... 26
Figure 6-6 Voltage versus nth number of sample ... 27
Figure 6-7 Analog input versus nth number of sample ... 27
Figure 6-8 Two signal with same sample size with different points of reading start.. ... 29
Figure 6-9 Signal with larger sample size ... 29
Figure 6-10 Flow chart of frequency measurement technique for Arduino board ... 30
Figure 6-11 Zero-crossing method slow sampling rate ... 31
Figure 6-12 Zero-crossing method slow sampling rate ... 32
Figure 6-13 GoBetwino Window Interface ... 34
List of Tables and Figures
Figure 6-16 Hardware Setup for Frequency Measurement.. ... 36
Figure 6-17 Excel graph with data from Arduino versus Screenshot graph from Netfrequenz.info website ... 36
Figure 6-18 Excel graph with data from Arduino lHOUR versus Screenshot graph from Netfrequenz.info website ... 37
Figure 6-19 Scatter Plot Comparison Arduino data(blue) and Reference data (red) 26 July 2014 ... 38
Figure 6-20 Scatter Plot Comparison Arduino data(blue) and Reference data (red) 27 July 2014 ... 38
Figure 6-21 Frequency at 16/6/2014 2:36PM Figure 6-22 Frequency at 16/6/2014 4:58PM . ... 39
Figure 6-23 Screenshot of Processing program to Log data to file ... 40
Figure 6-24 Screenshot data captured from processing ... 41
Figure 6-25 Frequency data 27 /6/2014 3:27PM Figure 6-26Frequency data 27 /6/2014 6:24PM ... 41
Figure 6-27 Frequency data at 27 /6/2014 9:22PM ... 42
Figure 6-28 Frequency data at 30/6/201411:37AM ... 42
Figure 7-1 Frequency Graph during Earth Hour day and a week before ... 46
Figure 7-2 Carpet Plot of frequency deviation from nominal values in July 2011 to Jan 2012 posted 10.2.2012 ... 4 7 Figure 7-3 Carpet Plot ofFrequency deviation from nominal values in the morning Figure Figure 7-4 Carpet Plot of Frequency deviation from nominal values in the late evening ... 48
Figure 7-5 Quality of Grid Frequency by Swissgrid ... 49
Figure 7-6 Frequency versus time from 2003 to 2010- Swissgrid ... 50
Figure 7-7 Frequency variation versus time from 2003 to 2010- Swissgrid ... 51
Figure 7-8 Simulated Frequency Deviation for Different Amount Of Secondary Reserve Source Red Electrica de Espana (REE) ... 52
Figure 7-9 Simulated Frequency Deviation for Different Time Constant Source Red Electrica de Espana (REE) ... 53
Figure 7-10 Simulated Frequency Deviation for Different Max Gradient Source Red Electrica de Espana (REE) ... 54
Figure 7-11 One Minute Graph 12:53PM to 12:54PM ... 54
Figure 7-12 One Minute Graph 12:54PM to 12:SSPM ... 54
Figure 7-13 One Minute Graph 12:SSPM to 12:56PM ... 55
Figure 7-14 Frequency Distribution of all three data groups ... 55
Figure 7-15 lSMinutes Graph 12:52PM to 1:12PM ... 56
Figure 7-16 15 Minutes Graph 1:12PM to 1:31PM ... 56
Figure 7-17 15 Minutes Graph 1:32PM to 1:46PM ... 57
Figure 7-18 Frequency Distribution Combination of all three data group ... 5 7 Figure 7-19 Line plot of grid frequency at 15:30PM to 16:30PM ... 58
Figure 7-20 Average, Max and Min of Frequency Data versus Time (decimal) ... 59
Figure 7-21 Average, Max and Min of Frequency Data versus Time (decimal) ... 59
Figure 7-22 Average, Max and Min of Frequency Data versus Time (decimal) ... 60
Figure 7-23 Frequency Distributions a n Hour Ave rage Combina tion of all three data groups .... 60
Figure 7-24 Frequency Hourly Average 28 Jun to 9Jul... ... 61
Figure 7-25 Frequency 3D Hourly Average 5 July to 9 July ... 62
Figure 7-26 Frequency Hourly Deviation (SOHz -Average Hz) 28 July to 9 August.. ... 62
x
List of Tables and Figures
Figure 7-27 Phelix volume traded and Frequency Deviation versus time at 10 July 2014 ... 63
Figure 7-28 Phelix volume traded and frequency deviation versus time at 11 July 2014 ... 64
Figure 7-29 Frequency 6 Minute Average July to 9 August 06:00AM to 12 :00PM ... 64
Figure 7-30 Frequency 6 Minute Average 28 July to 9 August 20:00PM to 24:00PM ... 6S Figure 7-31 Box Plot of 6 minutes data at early morning ... 66
Figure7-32 Box Plot of 6 minutes data at late evening ... 66
Figure 7-33 Frequency Distribution Early Morning Figure 7-34 Frequency Distribution Late Evening 67 Figure 7-3S Frequency Distribution Early Morning Figure 7-36 Frequency Distribution Late Evening ... 68
Figure 8-1 Frequency Deviation Carpet Plot for 32 days ... 72
Figure 8-2 Carpet Plot Frequency Deviation from year 2011 to year 2014 ... 73
TABLE Table 3-1 Frequency Statistic for Case 1 Source [12) ... 12
Table 3-2 Frequency Statistic for Case 2 Source [12) ... 12
Table 6-1 Arduino clock rate and the number of sample to reach SO Hz ... 28
Table 6-2 Possible result using 116 microseconds Clock Rate ... 30
Table 6-3 Analog data of 116 sampling rate ... 33
Table 6-4 Expected Result from Improved Accuracy ... 33
Table 6-S Error between Arduino Data versus reference data ... 39
[image:12.530.57.488.278.448.2]Introduction
Chapter 1
INTRODUCTION
There are multiple power plants connected to the network grid in general to meet the
consumer demand. In Europe, some countries are sharing the same grid as it is economical
and practically could increase grid stability by having alternatives energy source if
unexpected event occurs. The European Network of Transmission System Operator for
Electricity (ENTSO-E) was formed in 2008 to minister the network grid operation and
development plan for EU country. ENTSO-E is divided into regional groups, and each
member is responsible to monitor and manage the supply and demand of their respective
area. Refer to Figure 1-1 to see the region group distribution across Europe continent.
Figure 1-1 Map of European System Operator by Group'
1 http://epp.eurostat.ec.euro pa.eu/
1
[image:13.528.54.436.293.496.2]Introduction
3% 6%
52%
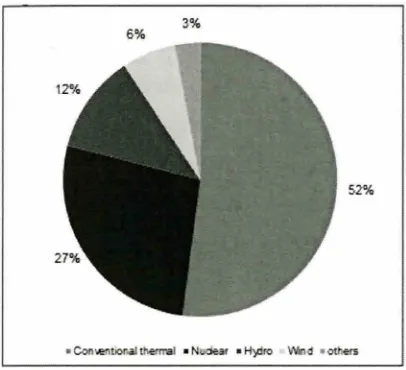
Figure 1-2 EU27 Electricity production distributed by source2
Electricity generation around the world still largely rely on fossil fuel (natural gas, coal) as
the energy source because it is the cheapest way to produce electricity. According to
European Commission Eurostat up to November 2012, the electricity production distributed
by source, 52% of the electricity comes from conventional thermal , 27%, 12%, 6% and 3%
respectively comes from nuclear, hydro, wind and other sources [I]. The electricity
transmission through the grid therefore largely influenced by the power generated through
thermal energy. This thermal energy heats the water in a structured piped around the boiler to
create high pressure steam. The steam then drives the turbine blades which connected to the
turbine generator which converts mechanical energy to an AC electrical energy. A
transformer is used to convert this generated electricity to a higher voltage AC and connected
to the grid. The inertia of a turbine generator on the other hand refers to the turbine
generators external force to change its speed of rotation. To change the speed of the turbine
generator, the plant operator should either add more energy (increase the speed) or remove
the energy (decrease the speed) of the turbine. Synchronous generator used in power plant
means the generator is locked into synchronization with the grid frequency its ' connected [2].
Electricity produced at the power plant is step up to a high voltage (120 KV or higher) to
minimize the loss of energy especially at a long distance transmission. The energy available
on the grid must closely match the load or demand. More power on the grid would result in
loss of effo1t because energy on transmission line cannot be stored while insufficient power
would result in power failure on state or even national level if it is not being managed
properly. Power plant is geographically distributed in distribution system and the operation of
[image:14.528.47.250.62.247.2]Introduction
powering up of shutting down due to any reason has to be carefully studied to ensure the grid
stability. There are two type of power regulation, voltage based regulation and frequency
based regulation. In mesh network, voltage based regulation is not a suitable due to the
complex of parameters reconfiguration each time new plant is introduced. Therefore,
frequency based regulation is used in all power plant to control the generation amount to
match the demand. The drop in frequency at the grid indicates that the demand is higher than
the supply, hence signaling the plant operator to speed up the generator. Hopefully the study
that we journeyed could help to give beneficial information to the power company and grid
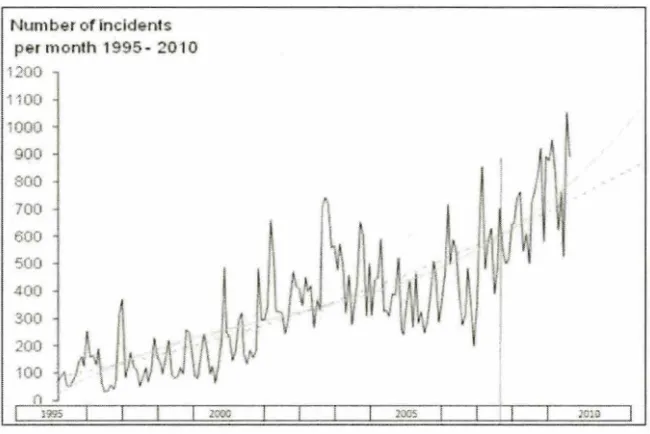
operator to create a better strategy to control the grid frequency. Figure 1-3 provides us with a
very good indicator that how the frequency deviation increases its trend between year 1995 to
year 2010 and how important this research is to community as a whole.
Num ber of incident s
p 1 m onth 1995 - 20 10
QセPP@
1100
1000 900
800
700 600 500 400 300 200
100
()
lClll
Figure 1-3 Number of incident where the frequency if beyond the normal operation 49. 9Hz to 50.lHz. Source: Statnett3
3 http://www.statnett.no/en/
3
[image:15.530.56.381.286.503.2]Gantt Chart
Chapter 2
THESIS PLANNING
[image:16.530.53.484.187.420.2]2.1
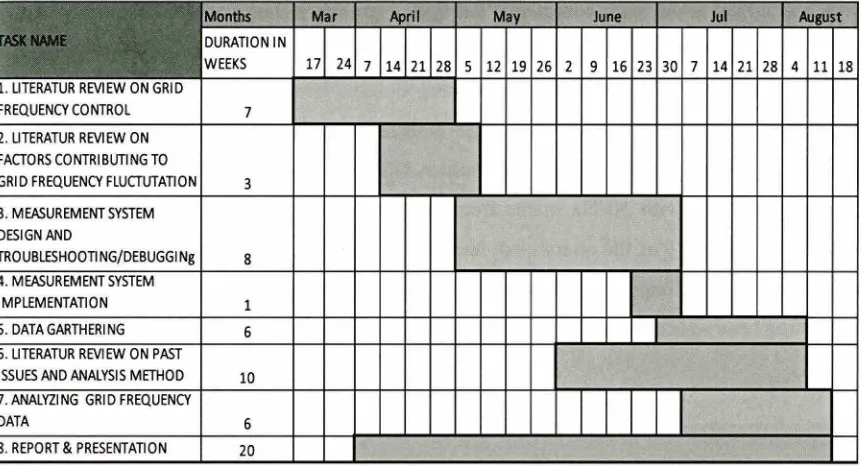
GANTT CHARTFigure 2-1 Subject Code 9591 Master Thesis Schedule
;·
•
;,:;..
セANLL@ セBG@ \
Months Mar April May June Jul August
DURATION IN
.. セ@ ,_ > セ@ セ@ - WEEKS 17 24 7 14 21 28 5 12 19 26 2 9 16 23 30 7 14 21 28 4 11 18
1. LITERATUR REVIEW ON GRID FREQUENCY CONTROL
2. LITERATUR REVIEW ON FACTORS CONTRIBUTING TO
7
GRID FREQUENCY FLUCTUTATION 3
3. MEASUREMENT SYSTEM
DESIGN AND
TROUBLESHOOT! NG/DEBUGGI Ng 8
4. MEASUREMENT SYSTEM
IMPLEMENTATION 1
5. DATAGARTHERING 6
6. LITERATUR REVIEW ON PAST
ISSUES AND ANALYSIS METHOD 10
7. ANALVZING GRID FREQUENCY
DATA 6
8. REPORT & PRESENTATION 20
2.2
EXPLANATIONThe thesis planning is divided into eight major steps. As the reader can see in Figure 2-1 Master Thesis Schedule, some of the tasks are overlapping each other for us to be as efficient as possible. Some minor steps were not included inside the chart such as discussion with the supervisor, equipment sourcing, purchasing process and literature on other topics related to grid frequency analysis.
Grid Frequency Regulation
Chapter 3
GRID FREQUENCY REGULATION
3.1
OVERVIEW OF EUROPEAN TRANSMISSION SYSTEMThe "Union for the Co-ordination of Transmission of Electricity" (UCTE) for continental
Europe had came out with continental Europe Operational Handbook on frequency control
and regulating reserve. The Operational Handbook can be obtained online from the UCTE
main website and the sole purpose is to keep balance between demand and supply of the
electricity. It comprises of guideline to the Transmission System Operator (TSO), electricity
generation companies and relevant stakeholder. UCTE grid is the largest synchronous electric
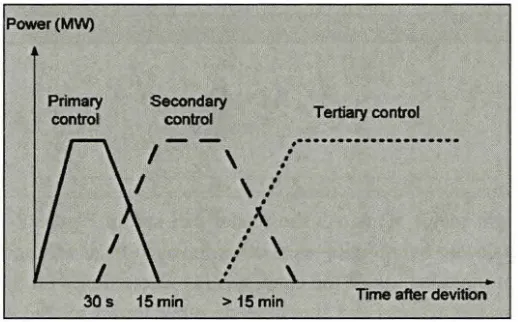
grid in the world with 50 Hz mains frequency [3]. Three stages of frequency control are
defined in Policy Pl of the operational handbook. Each has its own scope of operation such
as responses time, frequency deviation limit and megawatt amount [4]. Graph 3-1 shows the
regulating reserve classification versus response time
Power(MW)
Primary
cantrol
Secondary
control Tertiary control
•....•.•..•...••
\
.
...
\
...
.
(
.
.
:
\
•
•
.
[image:17.530.56.315.403.564.2]30s 15min > 15min Tme after devition
Figure 3-1 Regulating Reserve Classification versus response time4•
3.2
NORTH AMERICA (TEXAS) GRID FREQUENCY REGULATIONIn Texas United State, The Federal Energy Regulatory Commission was given the authority
to ensure that the bulk power system is operated under mandatory reliability standard and
4 Asko Vuorinen, "Planning of Optimal Power Syst em" Finland 2007
5
Grid Frequency Regulation
cyber security protection for the bulk power system [ 6]. It employs similar frequency control
guideline as published in Operational Handbook by UCTE. The deviation of the frequency at
the initial stage is managed by the Primary Frequency Response govern by Turbine
Governor, generally delivered completely within 12 seconds to 14 seconds. Secondary
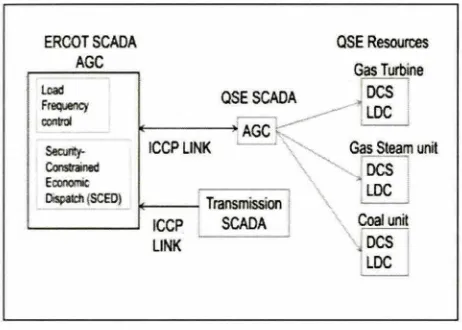
Frequency Response handled by Electric Reliability Council of Texas (ERCOT) which is a
single balancing authority. The control is done through Automatic Generation Control (AGC)
which is part of SCAD A/EMS (Supervisory control and data acquisition/Energy Management
System/Generation Management System) . Regulation Reserve (REG) operates in two ways.
REG UP Reserve increases the generation by controllable load reduction while REG DOWN
Reserve decreases the generation by controllable increase load.
ERCOTSCADA AGC
Load Frequency aintrol
QSE Resoun:es
Gas Turbine
qs セ
a@
セ@
1t--->' AGC
セ
セ@
ICCP LINK L - . . セ@ Gas Steam unit
\ セ@ DCS
I
I Transmission
I
ICCP : SCADA LINK, LDC j " Coal unit
DCS j
LDC 1
Mセ G@
Figure 3 -2 SCADA/EMS System Block Diagram5
3.3
GRID FREQUENCY REGULATION ISSUESMost of the electrical powers supplied to the grid are generated by synchronous generators;
hence controlling the power supply using frequency regulation is the ideal way to go. As of
today, we are aware that the trend of producing electricity is greater towards an alternative
and clean energy which could trigger some concern towards the current frequency regulation
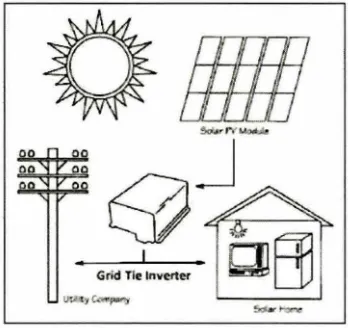
method of controlling the balance of the grid. Alternatives sources such as wind generator
and photovoltaic are connected to the grid via grid-tie inverter. The grid-tie inverter controls
the frequency, phase angle and voltage value of the alternative source so that it matches the
5Arthur Gardiner, "Frequency Control" 27 th ERCOT Region Operations Training Seminar, Texas Reliability
[image:18.528.52.283.271.436.2]Grid Frequency Regulation
main grid parameters. This problem may not be occurring at any time soon, but as more
grid-tie inverter source increases, the stability of the grid frequency may be affected one day.
There have been many researches about the effect of grid-tie inverter on the grid stability.
One of the notable researches is using Matlab/Simulink to simulate the condition of the grid
as more and more source coming from the grid-tie inverter. The simulation of the distributed
generation was done through a simple single phase surrogate model. The relationship
between grid phase and the corresponding change in the inverter voltage were determined
through multiple derivation and calculated assumption. The results from the simulations are
obtained over a full exploration of parameter space via simplified models. The study
conclude that the grid - tie inverter does not affect the frequency of the grid, however it only
applicable if the system allows an acceptable steady state solution Nevertheless, as the
inverter continues to supplies a larger percentage of the load, the power factor of the
distribution system as seen by the grid will decrease as long as there is a reactive component
on the load that is not steady state. Typically any power factor above 0.9 from the grid-ties
inverter is acceptable to a utility, although this varies based on local regulations. In cases
such as this, power factor restrictions might define the practical limits of inverter penetration
[ 6]. It is hope that more research will be done in this field not only to understand the effect of
the grid tie inverter, but also to extend the use of the technology as frequency regulation.
Fig ure 3 -3 Grid Tie -Inverter Block Diagram6
6 Eric Glover et all, "Frequency Stability for Distributed Generation Connected through Grid-Tie Inverter"
Power System Technology IEEE International Conference on Power System Technology (POWERCON),
2012
7
[image:19.530.55.229.446.610.2]Grid Frequency Regulation
3.4
RENEWABLE ENERGY SCENARIO IN GERMANYIn the year 2000 to 2005, photovoltaic (PV) power plant operated in a small number. The
requirement during that particular period for a low voltage generation plant connected to the
network grid, it must switch off immediately if the system frequency increased to 50.2 Hz.
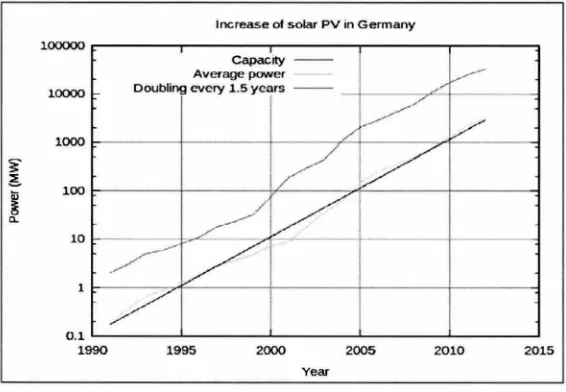
After several years of economic booming in Germany, more PV plant were installed and
connected to the network grid reaching more than 14 GW in 20 l 0. Figure 3-4 shows the
growth of solar PV energy in Germany. Since the old requirement could potentially lead to
disconnecting large capacity of power when the grid frequency reaches 50.2 Hz, VDE/FNN
transitional agreement was introduced in 2010 [8]. Based on the requirement in general, the
existing plant and new plant had to retrofit according to the recommended setting of
VDE/FNN (Association for Electrical Electronic & Information Technologies)/Forum
network technology I network operation). A reconnection of the PV power plant after
disconnection procedure is defined in the application guide Option 1 and 2, and it can be
implemented via inverter' s firmware update or changing
Electrically Erasable Programmable Read-Only Memory EEPROM. Option 3, m the other
hand can be implemented through parameter change, which requires the change of software
parameter; in which the distribution generation (DG) has to be disconnected from the
network in order to implement Option 3.
Increase of solar PV in Germ a ny
capacity -Average power
10000 Doubling every 1.5 y ears - - - - t - - - , , = - - t - - ---1
0 .1 セ@ _ _ __._ _ _ _ _._ _ _ _ ....___ _ _ ____..___ _ _ __,
1990 1995 2000 2005 2010 2015
[image:20.528.52.335.452.648.2]Year
Figure 3-4 Solar PV growth in Germany by year'
7Jens. C. Boemer et all, "Overview of German Grid Issues and Retrofit of Photovoltaic Power Plants in
Grid Frequency Regulation
An emergency discussion was taken place in August 2008 by UCTE ad-hoc group due to
rising concern on the grid frequency variation increases in the evening when no more PY
energy is being harness. Figure 3-5 shows the rising trend of frequency variation by
comparing different years, represented by colors. The normal operation of the UCTE grid is
between 49.95 Hz to 50.05 Hz. The figure below shows that the grid frequency operates
within the normal boundary most of the times during evening until 2004. In 2005 onwards, it
the frequency variation goes beyond the normal boundary down to 49.93 Hz during evening.
The development of the electricity markets in the European countries in combination with the
continuous increase in market participant and its activities has its consequences. The grid was
experiencing more and more frequency deviation and at higher peak swings around the
[image:21.530.51.468.284.437.2]change of the full hours, specifically at times when tariffs and schedules are being changed.
Figure 3-5 Frequency deviation in the evening from 2002-2001!
3.5
EFFECT OF WIND TURBINE AND SOLAR POWER TOWARDS GRID STABILITYUnlike conventional power plant, wind turbine and solar photovoltaic produce variable
output. During windy day and sunny day both power plant respectively will have higher
output peak. The power output is sometimes predictable and sometimes way off than what is
expected based on the change of the weather. The variability output impact the reliability of
the power supplied to the grid. Even known to have a reliability issue, more wind turbine is
installed across the world due to its environmental friendly features . This situation also
impacts the conventional power plant, where it has to ramp up or ramp down its generation
whenever the supply from wind and solar power plant is not meeting the expected output.
ENTSO-E Region Continental Europe" 1st International Workshop on Integration of Solar Power into Power Systems, Aarhus, Denmark 2011.
8 https:/ /www.entsoe.eu/ fileadmin/ user _upload/ _library /publications/ ce / otherreports/090330 _U CTE_
FrequencylnvestigationReport_Abstract.pdf
9
Grid Frequency Regulation
The worst case scenario would be when the wind or solar power plant reaches peak for a
small period of time the conventional power plant has to reduce its generation reaches a point
where it has to be shutdown or lost it productivity. The scenario would be very uneconomical
for the conventional power plant as the fuel will cost more during start up, not to mention the
lost made from not selling the electricity. Figure 3-6 shows the differences in power output
produce by wind turbine generator (WTG) at optimum location and standard location. It
shows how big is the effect of the location of installation of the wind turbine on its output.
Figure 3 -6 typical power output distribution of wind mill driven at optimum location {blue) and standard location source {10] (red)
50 I
50
wゥャ、セ@
- 0'4 - 30'4 - 10% - 40'!• 20% 50'4
[image:22.530.58.475.209.420.2]Qセ@ 20
Figure 3-7 System frequency dynamics when WTGs participate in system frequency regulation function source {10}.
Figure 3-7 shows the simulation of the effect of wind turbine generator towards the grid
frequency as the WTG' s sources increase in the network grid [10]. The simulation uses a test
system of 100 MV A turbo generators as a based power system and a wind farm model of 67
MV A Double Feed Induction Generator where the data was taken from [11].
60.7
セ@ 605
セ@ 60.3
セ@ 601
!
59.9u.
59.7
- Frequency: SGMl - frequency: SGM2
Figure 3-8 Frequency Data of 15% PV penetration at two SGM1 (slow) and SG/112 (fast) source {12]
67
セ@ 66
:t 65
f
セ@
- ftequMCV: SGMl - fr!quency: SGMZ
i
62it 61
セセ イヲᆬQセ セMMMMMM セ イ|jャャセ@
59..._...____.__..___.____._...__""""""-_..___.
[image:22.530.274.475.213.377.2]1000 2000 3000 4000 5000 6000 7000 8000 9000
Figure 3-9 Frequency Data of 30% PV penetration at two SG/111 {slow) and SGM2 (fast source {12]
[image:22.530.289.474.521.631.2] [image:22.530.73.472.521.634.2] [image:22.530.52.242.522.632.2]Grid Frequency Regulation
at 50% from 67 MY A9. The frequency dropped below than 49.5 Hz at 0% or when no power
produced from the WTG. Even though frequency regulation takes only 15 second to
compensate the supply lost, it will be devastated to even think what happen to the whole
system when the wind energy peaks and dip every now and then. The author concludes that it
is not technically sound to even consider wind turbine to replace the conventional thermal
generator for grid frequency regulation.
Another study in the United States was also conducted regarding the impact of renewable
energy, specifically on the increased of PV penetration on the 60 Hz grid frequency. The
author used two Simplified Grid Model (SGM) slow response generator (in Western North
America) and fast response generator (such as in Hawaii), to resemble the actual grid at
distribution level, without spinning reserve. The reason was to really evaluate the impact of
the PV on the grid frequency in the order of seconds. Two concentrated PV penetration
values were studied, Case 1-15% and Case 2- 30 %. The result of 9000 second of simulation
with a variable solar insolation is shown in Figure 3-8 and Figure 3-9. Table 3-1 and 3-2
shows the statistic of the grid frequency data [ 12]. The study also touched on other related
issues on the PV, but we will only focus on the frequency variation from the two level of PV
penetration.
It appears that the minimum frequency has dropped to another 0.43 Hz while maximum
frequency increased 6.67 Hz from Case 1 to Case2 on SGMl. Even thought better statistic
simulated for SGM2, it still shows that when PV penetration increases, the grid frequency
will fluctuates higher.
9 With no wind share, the increased load at Ss resulted in a fall in frequency from 50 to 49.48 Hz whereas
with 50% wind presence, the frequ ency falls to 49.24 Hz. Likewise, during the load change at lSs, the frequency rises to 50.11 Hz without wind support and to 50.18 Hz with wind support [1 2).
11
Grid Frequency Regulation
Table 3 -1 Frequency Statistic for Case 1 Source
[image:24.528.283.470.62.197.2]{12}
Table 3-2 Frequency Statistic for Case 2 Source
{12}
Minimum Maximum Average S!and!!d
RMSE ttequertj' freqtien.")' freq&) deliation
(Hz)
(Hz) (Hz) (Hz) (Hz)
Minimum Muiurum Areiagt S!mWd
RMSE
freqimy frequm.j ヲイセ・ッ」ケ@ dtiiatim
(Hz)
(Hz) (Hz) (Hz) (Hz)
SGM1 59.51 60.67 60.03 0.12S 0.133 SGMI 59.14 67.32 6032 0.636 0.711
SGM:l i9.9i 60.33 60.09 0.084 0.126 SG1l2 60.06 60.79 60.32 0.167 0.361
-3.6 ENERGY
TRADINGElectrical energy trading in European country is managed by European Energy
Exchange operates in Leipzig, Germany10. The trading activity has a significant impact
towards the network grid stability and is an important part of the demand balancing
system11. An imbalance demand and generation can occur in a short period of time
during settlement of the trading. Figure 3-10 shows the small mismatch between
demand and generation due to dynamic behavior of the generation. An illustration of
how the power system market operates is shown in block diagram, Figure 3-11. A case
study further discuss about the issues related to the frequency deviation and energy
trading is discussed in Chapter 7.5
10 http://en.wikipedia.org/wiki/European_Energy_Exchange
1 1 Looking at the morning hours of the day, the demand side shows a forecasted increasing behaviour of
[image:24.528.48.235.63.196.2]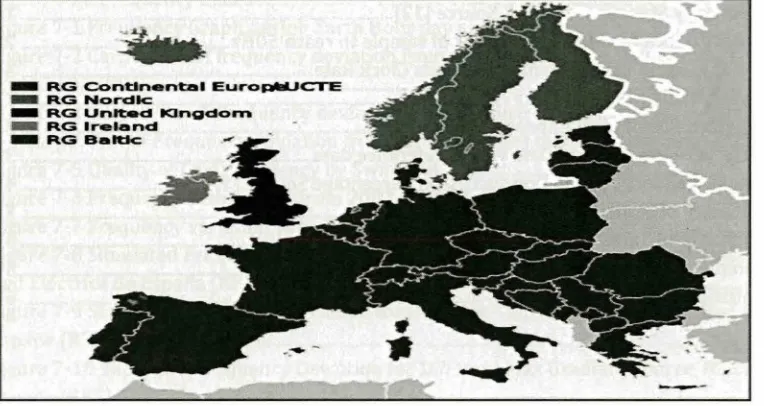
![Figure 3-6 typical power output standard locatiwind mill driven distribution of at optimum location {blue) and on source {10] (red)](https://thumb-ap.123doks.com/thumbv2/123dok/518979.59395/22.530.52.242.522.632/figure-typical-output-standard-locatiwind-distribution-optimum-location.webp)
