4 – 6 April 2012
STUDY ON THE LOAD DISTRIBUTION BY A CHARGE CONTROLLER OF
A PASSIVE SOLAR GREENHOUSE
M.R. Yaacob1,a*, W.S. Yuan1,b, M.Y. Lada1,c
1Faculty of Electrical Engineering, UTeM, Durian Tunggal, Malaysia.
aEmail:[email protected], bEmail: [email protected], cEmail: [email protected]
Abstract—This paper presents a study on the load distribution in a passive solar greenhouse through a self-developed charge controller. The study has been conducted in which the controller was being tested with 12 V 1.2Ah battery to measure the battery voltages over time in different load’s conditions. The battery voltage measurement was taken from a digital panel display consists of IC TC7107 and seven segments display which were connected to the SPC3 charge controller. This controller consists of both charging and low voltage disconnect circuits and is able to work with solar charged 12V DC system. The results obtained are the values of the battery voltage connected with no load, fan, motor and both fan and motor. These data were then converted into graph that illustrates the behavior of load distribution in a passive solar greenhouse.
Keywords—Loads; Battery; Controller .
I. INTRODUCTION
In the new era of agriculture industry, greenhouse has come to provide an alternative way of having a continuous supply to the non-stop demand of fruits and vegetables throughout the year. In a passive solar greenhouse, a smart irrigation and cooling system are also embedded which demands the usage of additional loads such as motor pump and fan. A charge controller is then needed to control the energy distribution as these loads consume different amount of energy.
In a passive solar greenhouse, battery is used as the source of energy during night time and it needs to be charged effectively during the day time. Meanwhile the loads need to be disconnected when the battery voltage level becomes low in order to ensure a longer life-span of the battery. It is a good opportunity to know how much actual energy is needed by each load so that each of the components can operate efficiently without distracting the overall system of the greenhouse. Hence, this study was done to provide a better understanding on the load distribution from the battery to the greenhouse.
Previous researches have been done which employ the different types of charge controllers. In the year 2008, Mikihiko Matsui has completed a solar charger module with the limit-cycle Maximum Power Point Tracking (MPPT)control. This circuit comes with the buck-boost chopper which provides a wide charging range. All the control function is controlled by the HITACHI H8 microprocessor and all functions are implemented in digital algorithm. Meanwhile the RS-232C port can be
used to monitor the input and output voltage through a PC [1].
In 2009, Ke Liu and John Makaran have designed a controller that converts solar energy into electricity with the use of photovoltaic (PV) panel. The charging current and the output voltage are controlled by DC/DC converter. A diode is used to block the reverse current from the battery to the PV panel. However the output voltage of the PV must be greater than the battery voltage for charging process to take place. Also, the efficiency of this system is low since the PV panel is not converting all the solar energy into electricity. So the authors have considered different voltages between PV panel and battery, and then suggested the use of buck-boost converter to solve the problem [2].
Forrest Cook has also developed an SPC3 solar charge controller for medium power application back in 1998. The advantage of this charge controller is that it can increase battery life-span by preventing over-charging and discharging. The circuit contains both charging and low voltage disconnects circuits and is able to work with solar charged 12V DC system [3]. Based on this feature, SPC3 solar charge controller is chosen for this research paper. The development was done on the circuit to suit the load components used in the greenhouse together with the development of digital display to for the battery voltage readings.
4 – 6 April 2012
II. METHODOLOGY
III. SPC3 Solar Charge Controller
A charge controller is the fundamental equipment in one solar system that is used to keep the battery charged. The purpose of charge controller is to protect the batteries from being overcharged as being used in solar system.
For this project, 16F877A microcontroller was used with a total of eight Analog-to-Digital Converter (ADC) modules being embedded in it. Each of the ADC module can only receive 5V and voltage divider was used to measure the battery voltage. The ADC module with 10bits is producing 1024 steps. The calculation of the voltage divider and the ADC itself is shown below:
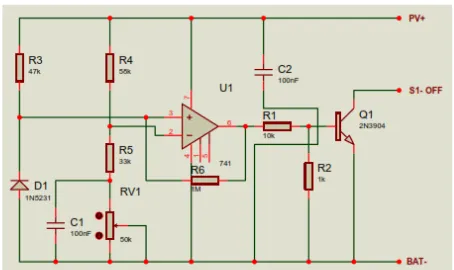
The charging process is activated when the battery voltage is below 13.4V and deactivated when the battery voltage is above 13.5V. There are two LEDs which indicate either charging or discharging process. The red LED indicates that the charging is on going while the green LED indicates that the battery is full as shown in Fig. 1.
Fig. 1 Solar charge controller circuit in Proteus 7.1
IV. Low Voltage Disconnect Circuit
If a battery is operated within proper charge and discharge voltages, it may last longer. While the necessity of a charge controller is for over-charging prevention, low voltage disconnect circuit is necessary to prevent excessive battery discharge. It is then possible to keep the battery running within a proper operating range by using a combination of both circuits.
The low voltage disconnect circuit is shown in Fig. 2 before being conctructed on the circuit board. However, in this project, two extension circuits are also added to the low voltage disconnect circuit to control the load cut off voltage as well as the controller cut off voltage. Both extension are shown in Fig. 3 and Fig. 4, respectively.
Fig. 2 Low voltage disconnect circuit in Proteus 7.1
4 – 6 April 2012
Fig. 4 Extension circuit for controlling the controller cut off voltage
The variable resistor is the extension circuits was turned on to set the load disconnect and controller turn off voltage. In line with this, the DC power supply was set to 12V and the variable resistor is fine tuned for all loads being disconnected. Then the power supply was set to 10.5V and the variable resistor was fined tuned until the low voltage diconnected circuit turned off. To indicate that the battery is low, a blinker circuit was also added to the low voltage disconnect circuit.
V. Digital Panel Display
The dipslay basically consists of an IC7107 which is a monolithic analog to digital converter, and 7-segment display as shown in Fig. 5.
Fig. 5 Digital panel display circuit in Proteus 7.1
The reference voltage between pins 35 and 36 needs to be adjusted to 100mV in order to measure the voltage range from 0 to 199.9mV. Meanwhile the reference voltage was adjusted to 1V when measuring the voltage range from 0 to 1.999V. This adjustment could be done by adjusting the trimpot and measuring the reference voltage with multimeter. Voltage divider was used for measuring the voltage greater than 0.2V and the calculation is shown as below:
VI. Voltage Indicator
Voltage indicator is used to indicate the battery voltage with LED. Unlike the digital panel dipslay, voltage indicator only indicates the range of the voltage instead of the exact value. The voltage indicator circuit was constructed with the low voltage disconnect circuit with no other connection is needed to indicate the voltage.
Fig. 6 shows the voltage indicator circuit diagram with the use of different color LEDs to indicate the range of the battery voltage. This circuit was then constructed on the same PCB with the low voltage disconnect circuit. The voltage indicator was supplied with 14V and the variable resistor R1 was fine tuned until all the LEDs turned ON. Then the voltage supply was slowly tuned until all the LEDs turned OFF. Based on the simulatiom, all LEDs were ON when the supply reached above 13V and all LEDS were OFF when the supply dropped below 9V.
4 – 6 April 2012
VII. EXPERIMENTAL SETUP
The objective of this experiment is to measure battery voltage for three different conditions of the load which are with no load, fan, motor as well as both fan and motor. In order to obtain that, an experimental setup was built up to allow the voltage readings in the most practical way.
The whole setup consists of a battery, solar panel, low voltage disconnect, charge controller, digital panel display and greenhouse as the load, as shown in Fig. 7.
Fig. 7 Overall project overview
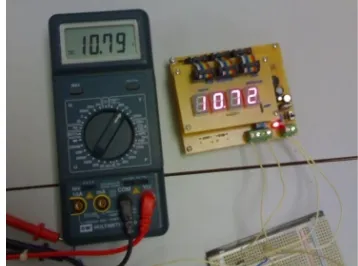
The digital panel display was first constructed on PCB as shown in Fig. 8. It is made of two layers of PCB with the first layer consists of a digital panel display IC TC7107 whereas the upper layer consists of 7-segment display to display voltage readings. This circuit was also constructed with LM7805 which supplies a 5V DC for the IC to operate. The voltage displayed is slightly different from the multimeter due to the internal resistance of the components on the PCB.
Fig. 8 Testing the 7-segment display with a Multimeter
Likewise, the voltage indicator circuit was also tested with a Multimeter as shown in Fig. 9. The red and yellow LEDs light up when the voltage is equal to 11.78V as seen in Fig. 9(a). On the other hand, all LEDs light up when the voltage increase to 13.5V as seen in Fig. 9(b).
Fig. 9(a) Red and yellow Fig. 9(b) All LEDs light up LEDs light up
The low voltage disconnect circuit constructed on the PCB was tested with 12V DC supply module before testing with the battery. The circuit connection is shown in Fig. 10 where the readings of 5.03V and 10.95V referring to the voltage at the loads, while 12.88V is the battery voltage.
Fig. 10 Low voltage disconnect circuit on PCB
The extension circuit for load disconnect controllerand controller cut off circuit is shown in Fig. 11. The variable resistors were adjusted for the load to be disconnected when the battery voltage dropped to 12V. Meanwhile the red LED on the LED blinker circuit was blinked when the battery voltage dropped to 11.6V and blinked off when the battery voltage increase above 11.6V. The low voltage LED blinker circuit is shown in Fig. 12.
4 – 6 April 2012
Fig. 12 Low voltage LED blinker circuit
All the circuits were then arranged and allocated as can be seen in Fig. 13. The 12V terminal is connected to the fan and water pump while 5V terminal is connected to the irrigation and temperature controllers of the greenhouse. Meanwhile the whole experimental setup of this project is shown in Fig. 14 combining the charge controller, battery and the greenhouse having pump and fan as the loads.
Fig. 13Overall allocation of the charge controller
Fig. 14 Overall experimental setup of the project
VIII. RESULTSAND ANALYSIS The controller was tested with 12V 1.2Ah battery for four different conditions of load combination which are with no load, 12V 0.2A fan, 12V 1A motor and also both fan and motor. Note that the motor refers to the one
embedded with the pump for the irrigation system while the fan is the one being used for the cooling system. The battery voltage was measured for the duration of 1 hour in 5-minutes interval time. The data is tabulated in Table 1 and the graph is plotted in Fig. 15.
Table 1 Battery voltage over time for four different load conditions
Battery Voltage (V)
Time
(Minutes) No Load Fan Motor
Motor and Fan
0 12.43 12.29 12.43 12.48
5 12.32 12.22 12.33 12.31
10 12.24 12.16 12.27 12.2
15 12.16 12.09 12.23 12.13
20 12.11 12.06 12.17 12.08
25 12.08 12.01 12.13 12.03
30 12.04 11.98 12.08 11.98
35 12.01 11.95 12.05 11.95
40 11.97 11.91 11.98 11.91
45 11.93 11.87 11.94 11.86
50 11.89 11.83 11.9 11.83
55 11.86 11.78 11.85 11.78
60 11.82 11.76 11.81 11.75
4 – 6 April 2012
For the no load condition, the battery voltage decreases dramatically over time from initial to approximately 20 minutes due to the battery self-discharge and energy consumption of the controller itself. Meanwhile when the controller is connected to the fan, the voltage decreases dramatically from the initial time to approximately 15 minutes. The fan has consumed energy at the beginning and the voltage decrease consistently around 12V because the load disconnect controller has cut off the load.
When the controller is connected to the water pump, the battery voltage decreases gradually from the initial time to approximately 25 minutes before the load being cut off when the battery voltage drops to 12V. For the last case, when the controller is connected to both fan and water pump, the voltage drops significantly from initial to around 15 minutes. The pump and fan consumed more energy at the beginning and the battery voltage drops gradually after the load was being cut off at around 25 minutes.
Graph for the condition of combination of fan and water pump illustrates the steepest slope at the beginning since the total power needs to run these two loads together is 14.40W, which is the highest among the other conditions. The battery voltage seems to decrease very fast. Therefore the charge controller will distribute a sufficient amount of energy to the load.
As the conclusion, the load of the greenhouse with higher power rating consume higher battery power and therefore a fast charging is required to charge up the battery from the solar panel through the solar charge controller.
REFERENCES
[1] Mikihiko et al., "A solar battery charging module by means of Limit-cycle MPPTcontrol", IEEE ICPE'08 Conf., pp. 572-575. [2] K. Liu, and J. Makaran, "Design of solar powered battery
charger", IEEEElectrical power &Energy Conference, 2009. [3] G, Forrest Cook (1998,March). Solar Charger Controller for
Medium Power