UNIVERSITI TEKNIKAL MALAYSIA MELAKA
OPTIMIZATION PROCESS BY USING DESIGN OF
EXPERIMENT (DOE) FOR FIBER OPTIC DISTANCE
SENSOR
This report submitted in accordance with requirement of the Universiti Teknikal Malaysia Melaka (UTeM) for the Bachelor Degree of Engineering Technology
(Telecommunication) (Hons.)
By
AMIRUL ALIFF BIN AMINUDDIN
B071210143
901112-08-5749
UNIVERSITI TEKNIKAL MALAYSIA MELAKA
BORANG PENGESAHAN STATUS LAPORAN PROJEK SARJANA MUDA
TAJUK: OPTIMIZATION PROCESS BY USING DESIGN OF EXPERIMENTS (DOE) FOR FIBER OPTIC DISTANCE SENSOR
SESI PENGAJIAN: 2015/16 Semester 2
Saya AMIRUL ALIFF BIN AMINUDDIN
mengaku membenarkan Laporan PSM ini disimpan di Perpustakaan Universiti Teknikal Malaysia Melaka (UTeM) dengan syarat-syarat kegunaan seperti berikut:
1. Laporan PSM adalah hak milik Universiti Teknikal Malaysia Melaka dan penulis. 2. Perpustakaan Universiti Teknikal Malaysia Melaka dibenarkan membuat salinan untuk
tujuan pengajian sahaja dengan izin penulis.
3. Perpustakaan dibenarkan membuat salinan laporan PSM ini sebagai bahan pertukaran antara institusi pengajian tinggi.
4. **Sila tandakan ( )
SULIT
TERHAD
TIDAK TERHAD
(Mengandungi maklumat yang berdarjah keselamatan atau kepentingan Malaysia sebagaimana yang termaktub dalam AKTA RAHSIA RASMI 1972)
(Mengandungi maklumat TERHAD yang telah ditentukan oleh organisasi/badan di mana penyelidikan dijalankan)
Alamat Tetap:
NO 15, JALAN CJ4/15-3A
TAMAN CHERAS JAYA,
43200 BALAKONG, SELANGOR.
Tarikh: 9 DEC 2015
Disahkan oleh:
Cop Rasmi:
i
DECLARATION
I hereby, declared this report entitled “OPTIMIZATION PROCESS BY USING DESIGN OF EXPERIMENTS (DOE) FOR FIBER OPTIC DISTANCE SENSOR”
is the results of my own research except as cited in references.
Signature : ……….
Author’s Name : AMIRUL ALIFF BIN AMINUDDIN
APPROVAL
This report is submitted to the Faculty of Engineering Technology of UTeM as a partial fulfillment of the requirements for the degree of Bachelor of Engineering Technology (Telecommunication) (Hons.). The members of the supervisory committee are as follow:
………
(Principal Supervisor)
………
iii
ABSTRACT
ABSTRAK
v
DEDICATIONS
To my beloved parents
Mr Aminuddin bin Ahmad
Mrs Dayang Siti Aini binti Abdul Salam
To my supportive wife and sibling
Mrs Azwani binti Ahmad Adzhar
Mrs Nurul Azniezah binti Aminuddin & Husband
To my supervisor
Mrs Rahaini binti Mohd Said
and my treasured friends
ACKNOWLEDGEMENTS
Firstly, I would like to express my greatest appreciation to my supervisor Puan Rahaini binti Mohd Said for her guidance, advice and support during I start the project preparation until now. The supervision and support really helping me to finish this progress of project preparation smoothly.
My grateful thanks also go to my parents and my wife. With their love and support, I never give up when I faced whatever troubles and problems. I can stand strong until today.
vii 1.2 Design of Experiment (DOE)
1.3 Type of Design of Experiment (DOE) 1.3.1 Full Factorial Design
1.3.2 Fractional Factorial Design 1.3.3 Screening Design
1.3.4 Mixture Experiment Design 1.4 Problem Statement
1.5 Objectives of Project
CHAPTER 2: LITERATURE REVIEW
2.0 Literature Review
2.1 Factorial Design usage in Optimization 2.1.1 2k Factorial Design
2.2 Fiber Optic Cable
2.3 SC Fiber Optic Connector 2.4 Fiber Optic Sensor
2.5 Concept of Fiber Optic 2.6 Light Source
2.6.1 Light Emitting Diode (LED) 2.6.2 Laser Diode (LD)
2.6.3 Fiber Optic Transmitter Summary 2.7 Optical Fiber Cable
2.7.1 Single Mode
2.7.2 Multimode Stepped Index 2.7.3 Multimode Graded Index 2.7.4 Plastic Optical Fiber (POF) 2.8 Transmission Window of Fiber Optic
2.8.1 First Window (Short Wavelength Band) 2.8.2 Second Window (Medium Wavelength Band) 2.8.3 Third Window (Long Wavelength Band) 2.9 Application of Distance Sensor
2.9.1 Positioning and Locating 2.9.2 Dimensioning and Selecting 2.9.3 Liquid Level Sensor
2.9.4 Counting and Controlling
ix
CHAPTER 3: PROJECT METHODOLOGY
3.0 Methodology 3.1 Project Planning 3.2 Gantt Chart
3.3 Parameters Identification 3.3.1 Light Sources 3.3.2 Distance
3.3.3 Type of Fiber Optic Cable (Diameter) 3.3.4 Permittivity
3.4 Method Selection (Factorial Design) 3.5 Design of Experiment (DOE) Procedure
3.5.1 Clarify and State Objective 3.5.2 Choose Responses
3.5.3 Choose Factors and Levels 3.5.4 Choose Experimental Design 3.5.5 Perform the Experiment 3.5.6 Analyze the Data
3.5.7 Draw Conclusions and Make Recommendations 3.6 Setup and Assign Parameter
3.6.1 Equipment Used 3.6.2 Parameter Used 3.7 Cut and Splicing Process
3.7.1 Stripping Process 3.7.2 Splicing Process 3.8 Develop Sensor
3.10 Run Experiment and Run Simulation by Using Design Expert 9 Software
3.11 Data Collection
3.12 Analysis Result and Data 3.13 Optimization
CHAPTER 4: RESULTS AND DISCUSSION
4.1 Results
4.2 Analysis of Variance (ANOVA) Output Power 4.3 Pareto Chart – The Rank Of Significant Effect 4.4 One Factor Effect of the Parameter
4.5 Interaction Effect of the Parameter 4.6 Optimization of Output Power 4.7 Discussion
4.8 Optimize Output Power Selected by Design Expert 9 4.9 Comparison between 1310nm and 1550nm of Light Source 4.10 Comparison between 10µm and 62.5µm of Diameter 4.11 Comparison between 20cm and 200cm of Distance 4.12 Comparison between Air and Water of Permittivity
CHAPTER 5: CONCLUSION AND RECOMMENDATION
xi
LIST OF FIGURE
FIGURE NO. TITLE PAGE
2.1 Flow Chart of Design of Experiment 8
2.2 Fiber Optic Cable Construction 9
2.3 The SC Connector for Fiber Optic Cable 10
2.4 Two Fibers Distance Sensor Technique 12
2.5 Light Source Graph 13
2.6 LED Light Source Device 14
2.7 Laser Diode Light Source Device 15
2.8 Single Mode Propagation Diagram 17
2.9 Multimode Stepped Index Propagation Diagram 18 2.10 Multimode Graded Index Propagation Diagram 19
2.11 The Light Spectrum of Fiber Optic 21
2.12 The Graph of Attenuation in Fiber Optic versus Wavelength
22
2.13 Positioning and Locating Distance Sensor 23 2.14 Dimensioning and Selecting Distance Sensor 24
2.15 Liquid Level Sensor 24
2.16 Counting and Selecting Sensor 25
3.1 Flow chart of the project 28
3.2 Experimental Workflow 28
3.3 Light Source Device 37
3.4 Optical Fiber Power Meter 37
3.5 Single Mode Cable with SC type Connector 37
3.6 Multimode Cable with SC type Connector 37
3.7 Fiber Optic Stripper 38
3.8 Fiber Optic Cleaver 38
3.9 Splicing Machine 38
3.11 Splicing Machine Ready to Used 41
3.12 Splice Machine Adjusting the Angle 41
3.13 Splice Machine Identify Type of Optical Cable Used 41
3.14 Finish Splicing with 0dB Loss 42
3.15 Optical Cable Splicing Process is Completed 42 3.16 Fiber Optic Distance Sensor Block Diagram 43 3.17 Single Mode fiber with 20cm of Distance Block
Diagram
44
3.18 Single Mode fiber with 20cm of Distance Model 44 3.19 Single Mode fiber with 200cm of Distance Block
Diagram
45
3.20 Single Mode fiber with 200cm of Distance Model 45 3.21 Multimode fiber with 20cm of Distance Block
Diagram
46
3.22 Multimode fiber with 20cm of Distance Model 46 3.23 Multimode fiber with 200cm of Distance Block
4.1 Pareto Chart (The Rank of Significant) 56
4.2 Main effect plot of output power (One Factor) 57
4.3 Interaction effect of output power 58
4.4 Report of an optimize output power and parameter selected
62
xiii
LIST OF TABLE
TABLE NO. TITLE PAGE
2.1 Color code of SC Connector 10
2.2 Characteristic of LED and Laser Diode 16
2.3 Material and Value of Permittivity 26
3.1 Gantt chart 30
3.2 Parameter of the Experiment 34
3.3 Matrix Design of Experiment 35
3.4 Value and Level for Each Parameters 48
3.5 Parameters Level of 16 Run 49
3.6 Parameters Value for Each Run 50
4.1 Output Power 54
4.2 ANOVA Table for Output Power 55
4.3 Optimum Parameter and Predicted Responses Value 59
4.4 Significant Factor with Coded Value 60
4.5 Summary of the Confirmation Run Output Power 61 4.6 Optimize Parameter Selected by Design Expert 9 62 4.7 Different results between 1310nm and 1550nm of
LIST OF ABBREVIATIONS
DOE = Design of Experiment FODS = Fiber Optic Distance Sensor LED = Light Emitting Diode
LD = Laser Diode
DX9 = Design Expert 9
OSA = Optical Spectrum Analyzer FFD = Full Factorial Design ANOVA = Analysis of Variance PI = Prediction Interval
SM = Single Mode
MM = Multimode
cm = Centimeter
µm = Micrometer
1
CHAPTER 1
INTRODUCTION
1.0 Introduction
This chapter will give a brief explanation about this project, based on the project title ‘Optimization Process by using Design of Experiment (DOE) for Fiber Optic Distance Sensor, have two topics will be discuss in this project which are about the Design of Experiment and Fiber Optic Distance Sensor. Besides that, it also cover the background, problem statement, objectives, scope project and summary of this chapter.
1.1 Background of the Study
1.2 Design of Experiment (DOE)
Design of Experiment (DOE) is a method with a systematic process to define or determine the relationship that affect a system or process and the output of the process. To find the cause and effect of a problem, DOE can be used. To manage process inputs, the information about the process is needed in order to optimize the output. The arrangement of various conditions or situations to which experiment subject will be exposed is the main concerns of Design of Experiment (DOE). An analysis of variance is performed on the data gathered and observation of the responses of the subjects is made. (Wayne Lee, 1975).
Design of experiment is used to manipulate and determine their effect on a desired output or responses and can allow for multiple input factors. DOE can identify the most important interaction that may be missed when experimenting with one factor at a time by manipulating multiple inputs at the same time.All possible combinations can be investigated by using full factorial or only a portion of the possible combinations by using fractional factorial.
To improve product quality and reliability is to integrate them in the design and manufacturing process design of experiment (DOE) is a one of effective ways. A useful tool that can be integrated into the early stages of the development cycle is design of experiment (DOE) because by many industries including automotive, semiconductor, medical devices, chemical product and many others it has been successfully adopted DOE. But until now still not be applied in fiber optic experiments (Wayne Lee, 1975).
3
1.3 Type of Design of Experiment (DOE)
There are many types of DOE, for example, full factorial design, fractional factorial design, screening design and mixture design.
1.3.1 Full Factorial Design
1.3.2 Fractional Factorial Design
An adequately chosen fraction of the treatment combinations required for the complete factorial experiment is selected to be run is a factorial experiment. For fractional factorial design, need to add a good number of center point runs and need to quickly run up a very large resource requirement for runs with only a modest number of factors. Fractional factorial design is used to solve this problem if the experiment can find a very large resource requirement to run, so fractional factorial design will select only a fraction of the runs specified by the full factorial design. To select the variable which runs make and which to leave out is the main topic of interest here. Normally, from the runs called full factorial will be selected by picking a fraction such as ½, ¼ and etc. To ensure an appropriate choice of runs need to use several of strategies and do some more research. (ASQC, 1983)
1.3.3 Screening Design
5
1.3.4 Mixture Experiment Design
Mixture Design is a design can supports experiment with factors that are ingredients in the mixture. The properties of a mixture are almost always a function of the relative proportions of the ingredients rather than their absolute amounts. A factor value is its proportion in the mixture, which falls between zero and one of the experiments with mixtures. The sum of the proportions in any mixture recipe is one or 100%. Designs for mixture experiments are fundamentally different from those for screening. With mixtures, it is impossible to vary one factor independently of all the others. When you change the proportion of one ingredient, the proportion of one or more other ingredients must also change to compensate. This simple fact has a profound effect on every aspect of experimentation with mixtures: the factor space, the design properties, and the interpretation of the results. Because the proportion sum to one, mixture designs have an interesting geometry. The feasible region for a mixture takes the form of a simplex (Simon M.J., 1997).
1.4 Problem Statement
1.5 Objectives of Project
Based on the title “Optimization Process by using Design of Experiment (DOE) for Fiber Optic Distance Sensor (FODS)”, below is the objectives of the project to be achieved at the end of this project.
i. To apply Design of Experiment (DOE) for optimization of fiber optic distance sensors.
ii. To identify the parameter that will optimize the output power by using Design of Experiment (DOE).
iii. To develop fiber optic distance sensor.
1.6 Project Scope / Work Scope
7
CHAPTER 2
LITERATURE REVIEW
2.0 Literature Review
This chapter reviews some references from previous projects and information of the projects. Propose of this chapter is to identify and analyze all the intellectual information and necessity in the process of build fiber optic distance sensor by using design of experiment.
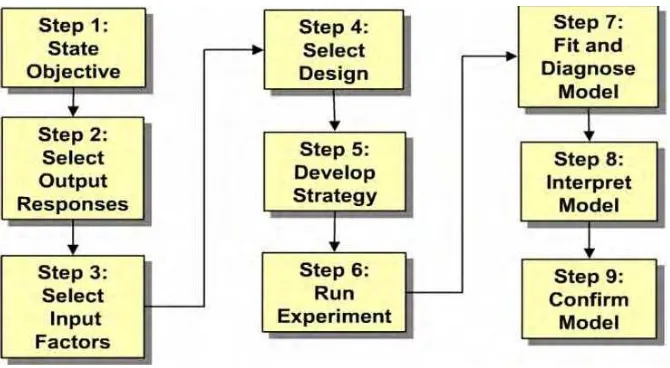
2.1 Factorial Design usage in Optimization
Figure 2.1: Flow Chart of Design of Experiment
2.1.1 2k Factorial Design
Factorial design is widely used in the experiments involving several factors where it is necessary to study the intersection of the factors on a response. The most important of these cases is that of k factors, each at only two levels. These levels may be quantitative, such as two value of temperature, pressure or time, or may be qualitative such as two machines, two operators, and the high and low level of a factor. A complete replicate of such a design requires 2 x 2 x …. x 2 = 2k observations and is called a 2k factorial design. In these designs we will refer to the levels as high and low, +1 and -1, to denote the high and the low level of each factor. (S.R. Schmidt, 1997)