DOI: 10.12928/TELKOMNIKA.v14i1.2486 254
Morphological Feature Extraction of Jabon’s Leaf
Seedling Pathogen using Microscopic Image
Melly Br Bangun*1, Yeni Herdiyeni2, Elis Nina Herliyana3
12
Department of Computer Science Bogor Agricultural University, Dramaga Bogor-Indonesia
3Department of Silviculture Bogor Agricultural University, Dramaga Bogor-Indonesia
*Corresponding author, email: [email protected], [email protected],
Abstract
This research aims to analyze morphological techniques for feature extraction of Jabon’s leaf seedling pathogen using digital microscopic image. The kinds of the pathogen were Curvularia sp., Colletotrichum sp., and Fusarium sp.. Pathogens or causes of disease were identified manually based on macroscopic and microscopic observation of morphological characters. Morphological characters describe the characteristics of shape, color and size of a pathogen structure. We focused on shape feature by using the morphological techniques to feature extraction. The morphology features extraction used were area, perimeter, convex area, convex perimeter, compactness, solidity, convexity, and roundness. The methodologies were acquisition, preprocessing, features extraction and data analysis for derivative features. With features extraction, we got the pattern that described each pathogen for pathogen identification. From the experimental result showed that compactness and roundness feature were able to differentiate each pathogen due to that the characteristics of each pathogen class were separated.
Keywords: feature extraction, Jabon, microscopic image, pathogen, morphological
Copyright © 2016 Universitas Ahmad Dahlan. All rights reserved.
1. Introduction
Jabon (Anthocephalus cadamba (Roxb.) Miq) is a native Indonesian forestry plant widely cultivated because it has many advantages over other plants. It is known as a fast growing species [1-3], a cylindrical rod with a good level of alignment rods and little branching [2-4], able to grow on various types of soil, silvicultural treatment is relatively easy [1], and it is one of the popular alternative medicinal plants in Indonesia recent years [3]. The seedling of Jabon has problems with diseases in the nursery area because it has the potential to be a host for the pathogen and succulent seedling condition that are still relatively vulnerable [5]. The disease is one of the obstacles because it can reduce quantity and quality. Most diseases in Jabon are caused by fungi [3]. One symptom or disease can be caused by different pathogen and the treatment is different either. Diseases and pathogens that have been reported to attack Jabon in nurseries include leaf spot disease caused by Rhizoctonia sp. [6] and Colletotrichum sp. [7], leaf blight caused by Fusarium sp. [6] and dieback diseases caused by Rhizoctonia solani Kuhn. [8] and Botryodiplodia sp. [5, 6]. The most significant characteristics of fungi to be identified are spore and mycelium [9]. Spore is one important part in the identification of morphological characteristics [10]. In this study pathogens came from Deuteromycetes class that are imperfect fungi because the only known as anamorphic phase or asexual phase, so to identify it based on the characteristics of asexual spores called conidia [11]. The morphological feature of pathogen can be seen in Table 1 [5, 10, 12].
Research related to Jabon performed by [13] which identify the type of Jabon’s fungi in Sampali Medan nurseries, this research [5] was to identify and test the primary causes of fungal pathogenicity dieback disease on Jabon seedling.
extraction of Batik image using Cardinal Spline Curve Representation. [18] to do the feature extraction and classification for multiple species of Gyrodactylus Ectoparasite.
Research related pathogen identification in Jabon’s leaf seedling is still a little to do especially in computer science, this is an opportunity to develop pattern recognition and image processing on it. Focus of this research will extract morphological features of Jabon’s leaf seedling pathogen using digital microscopic image.
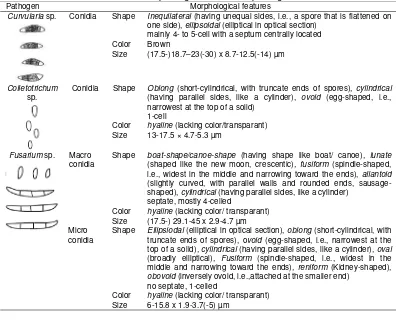
Table 1. Morphological feature of pathogen
Pathogen Morphological features
Curvularia sp. Conidia Shape Inequilateral (having unequal sides, i.e., a spore that is flattened on
one side), ellipsoidal (elliptical in optical section) mainly 4- to 5-cell with a septum centrally located
Color Brown
Size (17.5-)18.7–23(-30) x 8.7-12.5(-14) µm
Colletotrichum sp.
Conidia Shape Oblong (short-cylindrical, with truncate ends of spores), cylindrical
(having parallel sides, like a cylinder), ovoid (egg-shaped, i.e.,
narrowest at the top of a solid) 1-cell
Color hyaline (lacking color/transparant)
Size 13-17.5 × 4.7-5.3 µm
Fusarium sp. Macro
conidia
Shape boat-shape/canoe-shape (having shape like boat/ canoe), lunate
(shaped like the new moon, crescentic), fusiform (spindle-shaped,
i.e., widest in the middle and narrowing toward the ends), allantoid (slightly curved, with parallel walls and rounded ends, sausage-shaped), cylindrical (having parallel sides, like a cylinder)
septate, mostly 4-celled
Color hyaline (lacking color/ transparant)
Size (17.5-) 29.1-45 x 2.9-4.7 µm
Micro conidia
Shape Ellipsiodal (elliptical in optical section), oblong (short-cylindrical, with truncate ends of spores), ovoid (egg-shaped, i.e., narrowest at the top of a solid), cylindrical (having parallel sides, like a cylinder), oval
(broadly elliptical), Fusiform (spindle-shaped, i.e., widest in the
middle and narrowing toward the ends), reniform (Kidney-shaped),
obovoid (inversely ovoid, i.e.,attached at the smaller end)
Color
no septate, 1-celled
hyaline (lacking color/ transparant)
Size 6-15.8 x 1.9-3.7(-5) µm
2. Research Method
Research method composes four stage. There are data acquisition, preprocessing, feature extraction and data analysis.
2.1. Data Acquisition
Data acquisition was conducted in the Laboratory of Entomology Department of Silviculture Faculty of Forestry at Bogor Agricultural University in January-Mei 2015. Microscopic image data was taken using a microscope optilab camera and stored in JPG format. The magnification of the microscope used the same value for analyzing which each image acquisition process is about 400x. The data acquisition stage is shown in Figure 1.
The example of a microscopic image is shown in Figure 2. Before doing preprocess, the microscopic image is cropping manually and then we get sub-image.
Figure 2. manual cropping (a) microscopic image (b) sub-image
2.2. Preprocessing
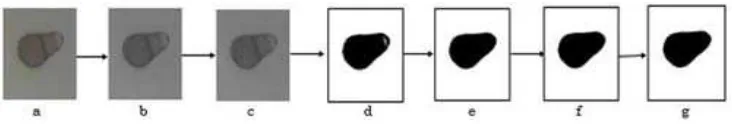
We conducted a series of preprocessing image to get the best segmentation image that will be extracted. The preprocessing stage can be seen in Figure 3. In this research, we used 150 sub-images from three pathogens. Sub-image should be converted to a grayscale image, then we used median smoothing. The smoothing filter is used for blurring and reducing noise. The median filter is a commonly used nonlinear operator that replace is the original gray level of a pixel by the median of the gray levels in the pixels of specified neighborhood [19, 20]. This filter is often useful because it can reduce noise without blurring edges in the image. Moreover, then we used Otsu thresholding, Otsu method is aimed at finding the optimal value for the global threshold [21]. It is based on the interclass variance maximization [22, 23]. We applied region filling if the image has a hole so that it can be solved. We used median smoothing again as removal of small details from an image prior to (large) object extraction, and bridging of small gaps in lines or curves [19, 21] and finally we used dilate operation.
Figure 3. Preprocessing (a) sub-image (b) grayscale (c) median smoothing (d) Otsu thresholding (e) fill hole (f) median smoothing (g) dilate operation
2.3. Feature Extraction
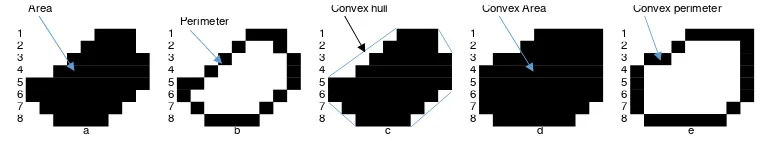
Features of an object are usually used to classify the object. The goal is to transform the images into data and then to extract information reflecting the visual pattern [16]. The morphological features consist of basic features (area, perimeter, convex area, convex perimeter) and derivative features (compactness, solidity, convexity and roundness). The explanation of basic and derivative features are as follows:
The area is represented by the total number of non-zero pixels within the boundary [24]. Area of a binary region R can be found by simply counting the image pixels that make up the region [22].
The convex area is calculating the convex hull area in which the empty area between the convex hull boundary and the boundary object, loaded object and the pixel values that included in the object area.
The convex hull is the smallest polygon convex that contains all points of the region R [22]. The convex perimeter is the circumference or limits on the convex hull. The illustration of basic features is shown in Figure 4.
Area Convex hull Convex Area Convex perimeter
Perimeter
1 1 1 1 1
2 2 2 2 2
3 3 3 3 3
4 4 4 4 4
5 5 5 5 5
6 6 6 6 6
7 7 7 7 7
8 8 8 8 8
a b c d e
Figure 4. Basic features (a) area, (b) perimeter, (c) convex hull, (d) convex area, (e) convex perimeter
Compactness is the relation between a region’s area and its perimeter [22]. According to [16], compactness is defined as the ratio between the area of an object and the area of a circle with the same perimeter. The maximum value of 1 to form a circle. Compactness calculation is defined in Equation (1) as below.
(1)
Roundness is the ratio of the area of an object to the area of a circle with the same perimeter of the convex hull object [16]. Roundness calculation is defined in Equation (2).
_ (2)
Solidity is the ratio of the area of an object to the area of a convex hull of the object. Solidity measures the density of an object [16]. Solidity calculation is defined in Equation (3).
_ (3)
Convexity is the relative amount that an object differs from a convex object, and this value represents the ratio of the perimeter of an object’s convex hull to the perimeter of the object itself [16]. According to [25] the convexity is defined as the ratio of perimeters of the convex hull with original contour. Convexity calculation is defined in Equation (4) as below:
_
(4)
The illustration of derivative features is shown in Figure 5.
2.4. Data Analysis
At this stage, we focused on analyzing derivative features that can differentiate each pathogen. The derivative features are compactness, solidity, convexity, and roundness.
3. Results and Analysis
From all research methods, we analyze error of each stage. In data acquisition, we have an error because we did not focus on acquisition data stage, it can effect to identify each pathogen correctly so in the preprocessing the segmented image has not precise shape with sub-image. The data has errors in the acquisition and preprocessing which are shown in Figure 6.
Figure 6. Error in data acquisition and preprocessing (a) sub-image and preprocessing result of data-7 (b) sub-image and preprocessing result of data-8 (c) sub-image and preprocessing result
of data-14.
The analysis result of each derivative features pathogen are shown in Figure 7-11.
a b
0.2 0.3 0.4 0.5 0.6 0.7 0.8 0.9
0 2 4 6 8 10 12 14 16 18 20 22 24 26 28 30 32 34 36 38 40 42 44 46 48 50
co
m
p
act
n
ess
data
colletotrichum curvularia fusarium
Figure 7. Compactness feature analysis of each pathogen (a) distribution data of compactness feature (b) compactness boxplot
Compactness is defined as the ratio between the area of an object and the area of a circle with the same perimeter [16]. From Figure 7(a), we can see that Curvularia sp. has more circle shape than others. Almost all data of each pathogen can discriminate and they have similar circle shape, but there are some pathogens that belong to Colletotrichum sp. (data_8, data_27 and data_40) got observed into Fusarium sp. group because there are a similar shape with Fusarium sp. the shapes are oblong and cylindrical and data distribution of data_8, data_27 and data_40 are in Fusarium sp.. From Figure 7(b), we can see that Colletotrichum sp. (data_8, data_27 and data_40) include as an extream data. Based on its small variance, the compactness feature of Fusarium sp. is uniform. Besides, Colletotrichum sp. does not have uniform data because the variance of value is higher than Curvularia sp. and Fusarium sp. This feature can be able to differentiate each pathogen.
and Colletotrichum sp. have more circular or round shape than Fusarium sp., almost all the pathogen data are represented to each pathogen, but there are some pathogens that belong to Colletotrichum sp. (data_8, data_27 and data_40) got observed into Fusarium sp. because there are similar shape with Fusarium sp. the shapes are oblong and cylindrical. in Figure 8(b) we can see that Colletotrichum sp. (data_8, data_27 and data_40) includes an extream data. Based on roundness feature, Colletotrichum sp. has not uniform data because the variance value is higher than Curvularia sp. and Fusarium sp..
a b
Figure 8. Roundness feature analysis of each pathogen (a) distribution data of roundness feature (b) roundness boxplot
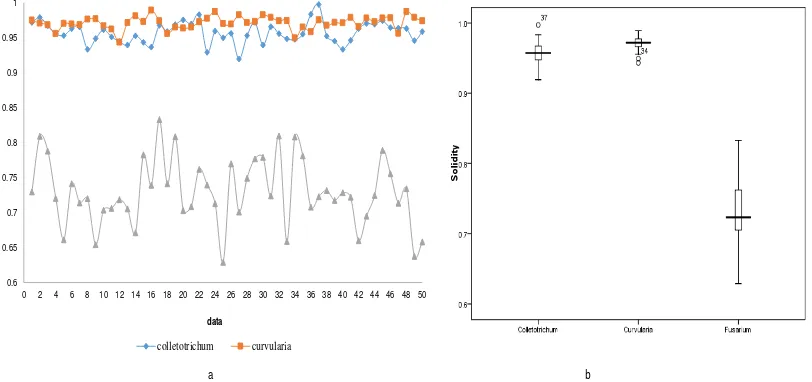
Figure 9. Solidity feature analysis of each pathogen (a) distribution data of solidity feature (b) solidity boxplot
differentiate pathogen Fusarium sp. but it is hard to differentiate pathogen Colletotrichum sp. and Curvularia sp., so solidity feature is not able to represent the type of pathogen.
a b
Figure 10. Convexity feature analysis of each pathogen (a) distribution data of convexity feature (b) convexity boxplot
Convexity is defined as the ratio of perimeters of the convex hull over that of the original contour [25]. In this feature, the perimeter of an object and its convex perimeter have significant influence if their value are equal. The convexity feature does not have a uniform data due to its high variance. Fusarium sp. does not have a uniform data because the variance value is greater than others but overall from Figure 10(b) we can see that convexity feature is not able to differentiate each pathogen because all pathogens have convex shape. Convexity is not able to represent the type of pathogen, it is caused by three types of pathogens have spread almost the same data that would be difficult to distinguish between the three types of pathogen.
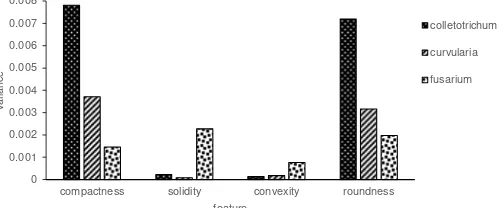
Compactness and roundness feature can be used to differentiate each pathogen differentiate because their variance value are discriminated. The variance of each feature is shown in Figure 11.
Figure 11. The variance value feature of each pathogen
4. Conclusion
represent the type of pathogen, this is caused by the value of pathogen Colletotrichum sp. and Curvularia sp. so tightly that it gets difficult to distinguish between the two pathogens, but overall of data are solid without a hole. Convexity is not able to represent the type of pathogen, it is caused by three types of pathogen have spread almost the same data that would be difficult to distinguish between the three types of pathogen. Other derivative feature may be used to get more feature represented. For the best result, it is necessary to add other feature like texture feature or fusion of several feature. Further studies will be focused on pathogen classification or identification of Jabon’s leaf seedling using microscopic images without cropping and systems can identify pathogens of a colony image.
References
[1] Krisnawati H, Kallio M, Kanninen M. Anthocephalus cadamba (Miq.): Ecology, Silviculture and Productivity. Bogor: Center for International Foresty Research. 2011.
[2] Mulyana D, Asmarahman C, Fahmi I. Bertanam jabon. Jakarta: Agro Media Pustaka. 2011.
[3] Warisno, Dahana K. Peluang investasi: jabon tanaman kayu masa depan. Jakarta: Penerbit PT Gramedia Pustaka Utama. 2011.
[4] Duladi. Panduan lengkap pembibitan jabon (Anthocephalus cadamba (Roxb.) Miq). Bogor: IPB Pr. 2013.
[5] Aisah AR. Identifikasi dan patogenisitas cendawan penyebab primer penyakit mati pucuk pada bibit
jabon (Anthocephalus cadamba (Roxb.) Miq). Thesis. Bogor: IPB; 2014.
[6] Herliyana EN, Achmad, Ardiansyah P. Pengaruh pupuk organik cair terhadap pertumbuhan bibit
jabon (Anthocephalus cadamba miq.) dan ketahanannya terhadap penyakit. Jurnal Silvikultur
Tropika. 2012; 03(03): 168-173.
[7] Anggraeni I. Colletotrichum sp. Penyebab Penyakit Bercak Daun Pada Beberapa Bibit Tanaman
Hutan Di Persemaian. Mitra Hutan Tanaman. 2009; 4(1): 29-35.
[8] Rahman MA, Baksha MW, Ahmed FU. Diseases and pests of tree species in forest nurseries and plantations in Bangladesh. Dhaka: Bangladesh Agricultural Research Council; 1997.
[9] Agrios GN. Plant Pathology. Fifth edition. New York: Elsevier Academic Pr. 2005: 423.
[10] Watanabe T. Pictorial Atlas of Soil and Seed Fungi Morphologies of Cultured Fungi and Key to Species. London: CRC Pr. 1994.
[11] Herliyana EN. Biodiversitas dan potensi cendawan di Indonesia. Bogor: IPB Pr. 2014.
[12] Barnett HL, Hunter BB. Ilustrated Genera of Imperfect Fungi. Fourth edition. Minnesota: Burgess
Publishing Company. 1998.
[13] Purba MD. Identifikasi fungi pada pembibitan jabon (Anthocephalus cadamba (Roxb.) Miq) di
Sampali Medan. Scription. Medan: Universitas Sumatera Utara; 2013.
[14] Ramos CMA, Nino E, Santos M. Automatic classification of Nosema pathogenic agents through
machine vision techniques and kernel-based vector machines. Computing Colombian Conference. 2013: 1-5.
[15] Scotti F. Automatic morphological analysis for acute leukemia identification in peripheral blood
microscope images. Proceedings of IEEE International Conference on Computational Intelligence for Measurement Systems and Applications. 2005: 96-101.
[16] Putzu L, Caocci G, Di Ruberto C, Leucocyte classification for leukaemia detection using image
processing techniques. Elsevier. 2014.
[17] Fanani A, Yuniarti A, Suciati N. Geometric Feature Extraction of Batik Image Using Cardinal Spline
Curve Representation. TELKOMNIKA. 2014; 12(2): 397-404.
[18] Ali R, Hussain A, Man M. Feature Extraction and Classification For Multiple Species of Gyrodactylus
Ectoparasite. TELKOMNIKA. 2015; 13(3): 503-511.
[19] Gonzalez RC, Wood RE. Digital image processing. Third edition.New Jersey: Pearson Pretice Hall.
2008.
[20] Wu Q, Merchant F, Castleman KR. Microscope Image Processing. New York: Elsevier Academic Pr. 2008.
[21] Hermawati FA. Pengolahan citra digital. Yogyakarta: Penerbit ANDI. 2013.
[22] Burger W, Burge MJ. Principles of Digital Image Processing-Core Algorithm. London: Springer. 2009.
[23] Otsu N. A Threshold Selection Method from Gray-Level Histograms. IEEE Trans. SMC. 1979; 9(1):
62–66.
[24] Saraswat M, Arya KV, Automated microscopic image analysis for leukocytes identification : A survey.
Elsevier. 2014: 20-33.