Reflection Decomposition in Single
Images Using an Optimum
Thresholding-based Method
Habibullah Akbar, Nanna Suryana, Shahrin
Sahib, Gede Pramudya, Halizah Basiron
Department of Industrial ComputingFaculty of Information and Communication Technology Universiti Teknikal Malaysia Melaka
Article Info
Received: 31st July 2012
Accepted: 6th September 2012
Published online: 15th November 012
ISSN: 2231-8275 © 2012 Design for Scientific Renaissance All rights reserved
A
BSTRACTTraditional methods of separating reflection components have been developed based on multiple images. There are only few methods which are able to use a single image. However, their applicability is limited due to offline setting of its arbitrary parameter. In this study, we propose an effective method to separate specular components using a single image which based on an optimum thresholding-based technique. This method employs modified specular-free image and selects an optimum value for the offset parameter. In contrast to prior method, the proposed method processes all the steps automatically and produces better performance. Experimental results for inhomogeneous objects demonstrate the promising applicability for real-time implementation. However, this method is unsuitable for objects with strong specular reflection. An extension is suggested to include the specular lobe reflectance into Shafer dichromatic model.
Keywords: threshold selection, specular and diffuse images, modified specular-free image
1. Introduction
Many computer vision algorithms ignore the specular reflection components from objects. Consequently, the performance of these algorithms is decreased when dealing with objects that exhibit pure or partially-specular reflectance. Indeed, Huge amount of manufactured products inherently exhibits specular reflection in some degree (Balzer & Werling, 2010). According to an aesthetical purpose, the manufactured product normally is painted to produce the desired visual appearance. Therefore, these kinds of objects exhibit both specular and diffuse reflectance.
Many methods have been developed to handle the object’s specular properties. One of the
185
noticeable progresses. However, the requirement of using multiple images prevents these methods to go beyond theoretical framework.
A single-based method offers more practical use for the real-time applications. Most of these methods was developed using Shafer dichromatic reflection model (Shafer, 1985). An exploitation of color histogram was presented by (Klinker et al., 1988). They separate specular and diffuse components by identifying two limbs on the T-shaped color distribution. More advanced method was presented by (Tan & Ikeuchi, 2005) by introducing the concept of specular-free (SF) image. The method does not require direct color segmentation. The diffuse pixel can be estimated using logarithmic differentiation operations. However, the diffuse maximum chromaticity is determined manually. A more efficient method to estimate the SF image was proposed by (Shen & Cai, 2009). A direct calculation of SF image can be done by simple finding the minimum pixel value from the color channels. Then, the diffuse image can be obtained by adding the SF image with an offset parameter. A threshold is required to determine the offset parameter. The threshold was calculated using mean and standard deviation that multiplied by specular degree coefficient. However, this method required an assumption about the coefficient value. A recent survey of specularity removal methods is available in (Artusi et al., 2011).
The prior methods show promising results due to its efficiency and robustness to dichromatic material. However, the choice of arbitrary parameter is remain unsolved as an open problem. This paper aims to introduce an alternative to estimate the specular degree coefficient using optimization techniques. In the proposed method, discriminant criterion (Otsu, 1979) is used to determine the specular coefficient parameter as a function of intra-class separability of pixels in the histogram. The advantage of this method is obvious because the process of specular-diffuse reflectance decomposition can be done automatically.
2. Reflection Model Formulation
2.1.Shafer Model
Most of specular-diffuse components separation methods are developed based on Shafer dichromatic reflection model (Shafer, 1985). The model assumes that the surface reflectance from an object is a linear combination of body and interface reflections. Each reflection can be decomposed into geometry scale factor and spectral distribution function as follows.
s s d
d I w I
w
I(,) () () () (1)
where wd() and ws() denote the diffuse and specular geometrical scale factor
respectively at pixel position, X(x,y). The Id()and Isare diffuse and specular reflection
components respectively. The specular component is independent to the color of illumination as assumed by (Lee et al., 1990).
2.2.Modified Specular-Free Image
186
more efficient representation to produce SF image is given by (Shen & Cai, 2009) and (Shen et al., 2008) by subtracting the minimum value from the RGB color components:
))
The coefficient is related to the degree of the image specularity. The value is assumed as scalar value equal to 0.5 for most materials. However, some objects might have different specularity value and this assumption can lead to an erroneous interpretation.
3. The Proposed Method
3.1.Otsu Criterion
We proposed the method for selecting the coefficient value based on a clustering-based thresholding technique. In this paper, we utilize thresholding-clustering-based method which based on discriminant criterion (Otsu, 1979) to compute a global threshold value by minimizing the intra-class variance of the black and white pixels, where the level is a normalized intensity value that lies in the range [0, 1].
Consider the input image has minimum and maximum luminance at gray-level 0 and L respectively. Hence, each pixel might have any gray-level value between [0, 1, 2, ... L – 1]. The occurrence probability of gray-level i can be denoted and normalized as follows.
1
where ni is the number of pixels at gray-level i and N is the total number of pixels in the
input image which satisfies the following condition: N = n0 + n1 + n2 + ... + nL-1.
Originally, this method aims to separate input image into object (foreground) and its background. In this case, we use it to separate diffuse and specular components. Therefore, the image pixels can be separated into two classes Cf and Cb by a threshold at a gray-level T.
187
The foreground class Cf and the background class Cb consist of gray-levels range between [0,
T-1] and [T, L-1] respectively. Then, the occurrence probability can be denoted as follows.
( )and the class mean levels are given in the following equations.
)
which holds the first-order cumulative moment of the histogram and total mean level of input image as follows.
Consequently, optimal threshold T* that maximizes the separability of the threshold at gray-level T can be obtained through the following equation:
)
In constrast to (Shen & Cai, 2009), we do not need to adjust the specularity level in the image. The diffuse reflection component of pixel X can be calculated as follows:
188
where
) ( ) ( )
( Imin
ws (16)
4. Results and Discussion
The proposed method is evaluated on a Core2Duo 1.83-GHZ computer with 2 GB RAM and MATLAB. There are two types of objects that are used for the experiments. The first type represents the sample of inhomogeneous objects which are fish and toys images. These
images can be obtained on Tan’s homepage website (please check on the last reference). The second type represents the sample of objects with stronger specular reflection. The experimental setup is shown in Fig. 1.
Fig. 1. Experimental Setup for capturing images of industrial samples, (left) the CCD camera (right) camera and bar light.
These images (part1, part2 and part3) were taken using a CCD camera: of Basler ACE GigE Camera with 25mm Camera Fix Lens. The illumination system is LED Bar Light with length of 190 mm. Both types of images are shown in Fig. 2 and 3 at the left most side.
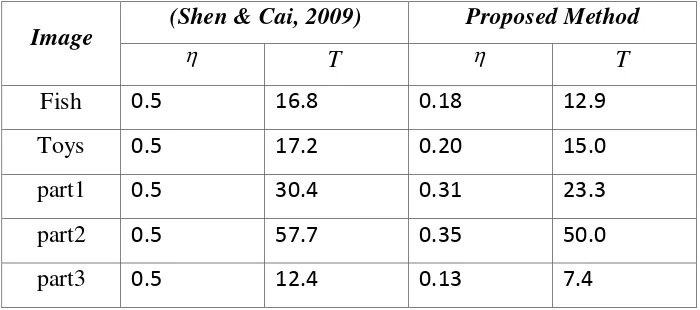
TABLE 1: COMPARISON OF COEFFICIENT VALUES
Image (Shen & Cai, 2009) Proposed Method
T T
Fish 0.5 16.8 0.18 12.9
Toys 0.5 17.2 0.20 15.0
part1 0.5 30.4 0.31 23.3
part2 0.5 57.7 0.35 50.0
189
Table 1 shows the experimental results of coefficient values and the corresponding threshold values T . The results of the proposed method are always lower than (Shen & Cai, 2009). This means that the optimum value of coefficient not necessary has to bet set as 0.5. In the results, these values can go beyond the lower boundary i.e. 1/3 which is opposite to their maximum chromaticity definition. The proposed method also verified that this parameter can be obtained automatically using Otsu criterion.
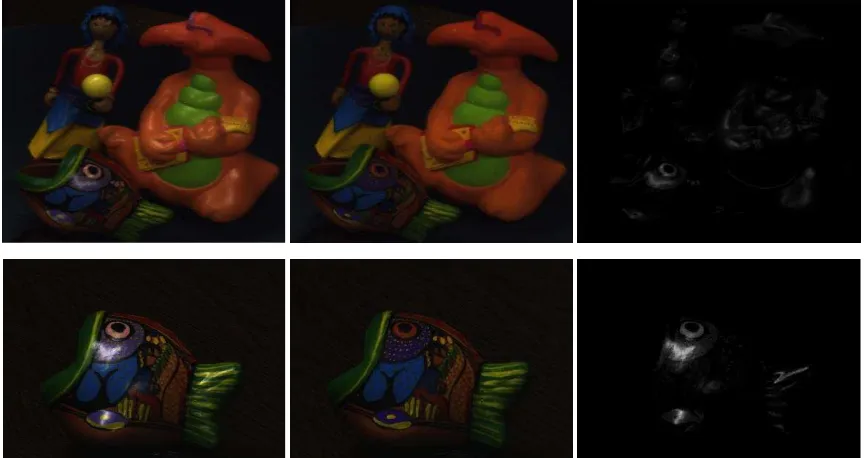
Fig. 2. Results on two benchmark images i.e. (top) toys and (bottom) fish, (left) original images; (middle) diffuse images; (right) specular images
On one hand, Fig. 2 shows the evaluation of the proposed method for inhomogeneous objects. For the two benchmark images, the partial specular reflectance is well separated. The diffuse image shows no sign of specular components and the specular image shows isolated specular components only. This demonstrate that the proposed works well for this kind of objects.
On the other hand, Fig. 3 shows the results for objects that exhibits very strong specular reflection and very weak diffuse reflection. In contrast to inhomogeneous material, the diffuse image shows that the algorithm over estimate the specular reflection and leave some blank area on its surface. This area, in fact, becomes empty because the metal surfaces almost do not have diffuse properties. Moreover, Shafer’s model assumes that particular object of interest has both diffuse and specular reflections that can be violated by some metal surfaces or objects with specular lobe reflectance.
190
Fig. 3. Results on three industrial part images i.e. (top) part1; (middle) part2; (bottom) part3, (left) original images; (middle) diffuse images; (right) specular images
5. Conclusion
This paper proposes the extension version of separation algorithm for decomposing diffuse and specular components in a single image. The threshold selection is estimated under Otsu criterion that based on the optimization method. The method offers one type of solution to close the gap on prior separation algorithm where manual selection or assumption is required to choose the arbitrary parameter. The incorporation optimization method enables the fully automatic calculation for the whole separation processes. The experimental results on inhomogeneous objects demonstrate the feasibility of the proposed method for practical use. However, the results objects with very strong reflectance show the limitation of this method. The estimated diffuse image loss of its some pixel values especially for the strong specular reflectance. In future, we aim to include the specular lobe components to the
Shafer’s model.
Acknowledgment
191 References
Artusi, A. and Banterle, F. and Chetverikov, D. (2011). A survey of specularity removal methods. Computer Graphics Forum 30 (8), 2208–2230.
Balzer, J. and Werling, S. (2010). Principles of shape from specular reflection 43 (10), 1305– 1317.
Klinker, G. J., Shafer, S. A. and Kanade, T. (1988). The measurement of highlights in color images. International Journal of Computer Vision 2 (1), 7–32.
Lee, H. C., Breneman, E. J. and Schulte, C. P. (1990). Modeling light reflection for computer color vision. Transaction on Pattern Analysis and Machine Intelligence 12 (4), 402–409.
Lin, S. and Shum, H. Y. (2001). Separation of diffuse and specular reflection in color images. Proceedings of the IEEE Computer Vision Pattern Recognition, 1-341.
Nayar, S. K., Fang, X. S. and Boult, T. (1997). Separation of reflection components using color and polarization. International Journal of Computer Vision 21 (3), 163–186.
Otsu, N. (1979). A Threshold Selection Method for Grey Level Histograms. Transactions on System, Man and Cybernetics 9 (1), 62–66.
Sato, Y. and Ikeuchi, K. (1994). Temporal-color space analysis of reflection. JOSA A (11), 2990–3002.
Shafer, S. A. (1985). Using color to separate reflection components. Color Research and Application 10 (4), 210–218.
Shen, H. L., Cai, Q. Y. (2009). Simple and efficient method for specularity removal in an
image. Applied Optics 48 (14), 2711–2719.
Shen, H. L., Zhang, H. G., Shao, S. J. and Xin, J. H. (2008). Chromaticity-based separation of reflection components in a single image. Pattern Recognition 41 (8), 2461–2469.
Tan, R. T. and Ikeuchi, K. (2005). Separating reflection components of textured surfaces using a single image. Transaction on Pattern Analysis and Machine Intelligence 27 (1), 178–193.