DEVELOPING TOURING PLAN USING
GEOGRAPHIC INFORMATION SYSTEM BASED ON
VISUAL, NATURAL, AND CULTURAL QUALITIES
IN PARANGTRITIS COASTAL AREA,
YOGYAKARTA, INDONESIA
MEITY SETIAWATY
GRADUATE SCHOOL
STATEMENT
I, Meity Setiawaty, here by stated that this thesis entitled:
Developing Touring Plan Using Geographic Information System Based on Visual, Natural, and Cultural Qualities in Parangtritis Coastal Area,
Yogyakarta, Indonesia
is the result of my own work during the period of April until September 2006 and
that it has not been published before. The content of the thesis has been examined
by the advising committee and the external examiner.
Bogor, November 2006
DEVELOPING TOURING PLAN USING
GEOGRAPHIC INFORMATION SYSTEM BASED ON
VISUAL, NATURAL, AND CULTURAL QUALITIES
IN PARANGTRITIS COASTAL AREA,
YOGYAKARTA, INDONESIA
MEITY SETIAWATY
A Thesis submitted for the degree of Master of Science of Bogor Agricultural University
MASTER OF SCIENCE IN INFORMATION TECHNOLOGY
FOR NATURAL RESOURCES MANAGEMENT
GRADUATE SCHOOL
AKNOWLEDGMENT
It has been a great pleasure for me to have this study accomplished, which
has been a great work during those 6 months time. There are many people who
have been very helpful in regard to this work. Therefore, I would like to
gratefully acknowledge the great contributions of the following individuals to this
work:
1. Dr. Yuli Suharnoto, MEng and Dr. Siti Nurisjah, MSLA as my supervisor and
co-supervisor, as well as Dr. Anton B. Wijanarto as the external examiner.
2. Ibu Dewayany Soetrisno, Bapak Suwahyuono, Ibu Niendya, Bapak Ari
Dartoyo, Bapak Suprajaka, and all staffs in PSSDAL Bakosurtanal for the
helps and supports during the research.
3. Bapak Nyoman Sukmantalaya, Bapak Anto, Bapak Budi, and all staffs in
Geospatial Lab. of Parangtritis for the valuable supports and helps, especially
during the field survey.
4. Bapak Tlau Sakti Santosa from Tourism Office of Bantul Regency, for the
expertise and valuable helps.
5. Pak Jaka and Pak Arry for a great chance of working together as a team;
Ferrari and Wenwen, who have been very helpful during the mapping process;
Mba Ati and Pak Yuni for the great supports, helps, and valuable advices.
6. All the respondents and also the experts who have given their judgment for the
necessity of this study accomplishment, especially for: Bapak A.B. Suriadi
from Bakosurtanal, Bapak Qodarian Pramukanto from Dept. of Landscape
Arch. IPB, Bapak Irwan Ariefyanto from Republika, Rahman Andra and Pak
Iman P. from Sheils Flynn Asia, Mba Elis and Mas Dendi from Envirospace
Indonesia.
7. Vera DD who have been very helpful during the study; Mba Atha and Mba
Oly who always be there for me; Mba Yusi, Mas Iwan, and Bapak Yudi Rizka
for the great suggestions and corrections.
8. Finally, with all my honor, love, and respect, to my parents, and all my brother
and sisters, as well as my nieces and nephews, who always be the great
CURRICULUM VITAE
Meity Setiawaty was born in Pontianak, West Kalimantan,
Indonesia on May 18, 1978. She finished her undergraduate
study of Landscape Architecture from Faculty of
Agriculture, Bogor Agricultural University in 2001. From
the year of 2001 to 2004, she worked as a lecturer assistant
at the same institution for Site Analysis and Landscape Planning Lectures.
During the same time, she also worked as researcher assistant in doing some
research projects majoring Urban and Tourism Landscape Planning for some local
government institutions.
In the year of 2004, Meity Setiawaty is registered as one of the students in
program of MSc in Information Technology for Natural Resources Management,
Bogor Agricultural University. She finished her study there in 2006. Her thesis
was on “Developing Touring Plan Using Geographic Information System Based
on Visual, Natural, and Cultural Qualities in Parangtritis Coastal Area,
ABSTRACT
MEITY SETIAWATY (2006). Developing Touring Plan Using Geographic
Information System Based on Visual, Natural, and Cultural Qualities in Parangtritis Coastal Area, Yogyakarta, Indonesia. Under the supervision of YULI SUHARNOTO and SITI NURISJAH.
Parangtritis is one of tourist destination place in Indonesia that is visited by plenty of visitors because of its local legend of Kanjeng Ratu Kidul and its beautiful landscape and scenery of beach, as well as many other varieties of tourism objects, which are rarely including in a touring system that can serve the visitors with informative and recreative interpretation within the current tourism management. The objective of this study is studying on developing a touring plan in coastal area of Parangtritis based on its visual, natural, and cultural quality assessment. Those three aspects of quality are used as the basic consideration for site assessment in acquiring the potential tourism area, which is subsequently used in developing a touring system.
Scenic Beauty Estimation (SBE) and visual character variables assessment are used in assessing the visual quality of the study area. The technique of potential zones mapping applied by Gunn (1994) combined with cartographic regionalization (Smith, 1989) are used in assessing both natural and cultural quality of the area. GIS technology is used in this study, especially to perform spatial analysis in integrating those three resources assessments to obtain a composite result considered as potential tourism area.
The assessments of the study area explain that Parangtritis Area has a good quality of visual, natural, and cultural resources that are potential to be developed as tourism resources and attractions. In general, Parangtritis is dominated with high to medium quality of potential area for tourism, which includes beach, sand dunes, woodlands, and a big part of agricultural area.
Research Title : Developing Touring Plan Using Geographic Information System Based on Visual, Natural, and Cultural Quality in Parangtritis Coastal Area, Yogyakarta, Indonesia
Name : Meity Setiawaty
Student ID : G051040081
Study Program : Master of Science in Information Technology for Natural
Resource Management
Approved by,
Advisory Board
Dr. Ir. Yuli Suharnoto, MEng Dr. Ir. Siti Nurisjah, MSLA
Supervisor Co-supervisor
Endorsed by,
Program Coordinator Dean of the Graduate School
Dr. Ir. Tania June, MSc Dr. Ir. Khairil A. Notodiputro, M.Sc
TABLE OF CONTENTS
STATEMENT …..……… i
AKNOWLEDGEMENT ……..……… ii
CURRICULUM VITAE ……… iii
ABSTRACT ……….. iv
TABLE OF CONTENTS ……… vi
LIST OF TABLE ……… ix
LIST OF FIGURE ……… x
I. INTRODUCTION ……… 1
1.1. Background ……… 1
1.2. Objectives ……… 4
1.3. Scope of Study ………...…... 4
II. LITERATURE REVIEW ……… 6
2.1. Coastal Zone ……… 6
2.2. Tourism ……… 7
2.3. Tourism Landscape Planning ... 9
2.4. Visual Quality …...……… 12
2.5. Interpretation of Tourism Site ……… 13
2.6. Geographic Information System ……… 15
2.7. Analytical Hierarchy Process … ……… 18
2.8. Coastal Area of Parangtritis ……… 19
III. METHODOLOGY ……….……… 22
3.1. Time and Location of Study ………...……… 22
3.2. Method of Study ……….……… 23
3.2.1. Flowchart of Study ……….……… 23
3.2.3. Analysis ……….. ……… 25
3.2.3.1. Visual Quality Assessment ……... 25
3.2.3.2. Natural and Cultural Element Assessment …. 31 3.2.4. Synthesis……… 35
3.2.4.1. Acquiring the Potential Tourism Area ……… 35
3.2.4.2. Developing Touring Plan Alternatives ……... 36
3.2.4.3. Analytical Hierarchy Process ………. 38
IV. RESULT AND DISCUSSION ………... 41
4.1. Visual Quality Assessment ………. 41
4.1.1. Visual Preferences Assessment ………. 41
4.1.2. Visual Character Variables Assessment ……… 45
4.1.3. Visual Quality of Parangtritis Coastal Area ..…………. 46
4.2. Natural Quality Assessment ……….. 50
4.2.1. Landform and Topographic Factor ………. 51
4.2.2. Hydrology Factor ………... 53
4.2.3. Vegetation Factor ……….. 54
4.2.4. Supporting Factor ……….. 55
4.2.5. Natural Quality of Parangtritis Coastal Area …………. 57
4.3. Cultural Resources Assessment ……… 59
4.3.1. Legend and Historic Factor………. 59
4.3.2. Architectural Factor ………... 60
4.3.3. Ethnical Factor ……….. 62
4.3.4. Tourism Economic Factor ………. 63
4.3.5. Cultural Quality of Parangtritis Coastal Area………... 64
4.5. Developing Touring Plan Alternatives with Interpretation
Concept ……… 69
4.5.1. Touring Alternative 1 ……… 69
4.5.2. Touring Alternative 2 ……… 73
4.5.3. Touring Alternative 3 ……… 77
4.6. Prioritizing Touring Plan Alternatives Using Analytical Hierarchy Process (AHP) ……….…… 82
V. CONCLUSION AND RECOMMENDATION ….……… 85
REFFERENCES ……….. 88
LIST OF TABLE
No. Caption Page
1. Data Inventory and Collecting Methods ……….. 24
2. Hardware and Software Used in Research Process ………. 30
3. Criteria for Scoring the Visual Character Aspects ……….. 34
4. Weighted Factors in Parangtritis Coastal Area ……… 35
5. Calculations of SBE Value ……….. 41
6. SBE Values for 63 Photos Based on Their Landscape Character ... 42
7. Average Scores of Visual Character Variables for Each Landscape Character in Parangtritis Coastal Area ……… 45
8. Landscape Characters in Parangtritis Area with Their Visual Quality ………. 49
9. Landform and Topography in Parangtritis Coastal Area …………. 51
10. Cultural Factors and Quality in Each Neighborhood ……….. 66
11. Themes and Objectives for Each Stop along Touring Alternative 1 70 12. Themes and Objectives for Each Stop along Touring Alternative 2 74 13. Themes and Objectives for Each Stop along Touring Alternative 3 78 14. Matrix of Pairwise Comparison for Criteria Contributing to the Goal ………. 82
LIST OF FIGURE
No. Caption Page
1. Framework of Study ……… 5
2. A Development Guideline for Coastal Beaches (Source: Simonds, 1978) ……… 7
3. Functioning Components of Supply (Source: Gunn, 1994) ……... 10
4. Study Location ………. 22
5. Flowchart of Study………... 23
6. Landscape Character Map of Parangtritis Coastal Area ………….. 26
7. Landform Map of Parangtritis Coastal Area ………... 32
8. Village Map of Parangtritis ………. 33
9. Composite Mapping Process Based on Resource Factors ……….. 35
10. Hierarchy Structure of AHP Method ……….. 40
11. Spatial Distribution of SBE Values ………. 44
12. Spatial Distribution of Visual Character Variables Score ………... 47
13. Visual Quality Map of Parangtritis Coastal Area ……… 47
14. Landscape Characters with Very High Visual Quality …………... 48
15. Landscape Characters with High Visual Quality ……… 48
16. Landscape Characters with Medium Visual Quality ………... 48
17. Landscape Characters with Low Visual Quality ……… 50
18. Landscape Characters with Very Low Visual Quality ……… 50
19. Map of Landform and Topographic Factors ……… 53
20. Map of Hydrology Factor of Parangtritis Coastal Area ………….. 54
21. Map of Vegetation Factor of Parangtritis Coastal Area ………….. 55
22. Condition of Each Type of Infrastructure in Parangtritis Area …... 56
23. Map of Supporting Factor of Parangtritis Coastal Area …………. 57
24. Natural Resources Quality Map of Parangtritis Coastal Area ……. 58
25. Map of Legend and Historical Factor in Parangtritis Coastal Area 60 26. Some Houses with Dominant Architectural Style ………... 61
28. Map of Architectural Factor of Parangtritis Coastal Area ……….. 62
29. Map of Ethnical Factor in Parangtritis Coastal Area ……….. 63
30. Map of Tourism Economic Factor in Parangtritis Coastal Area …. 65 31. Cultural Resources Quality Map of Parangtritis Coastal Area …… 65
32. Map of Potential Tourism Area Based on Visual, Natural, and Cultural Resources Quality ……….. 68
33. The Layout of Touring Alternative 1 ……….. 72
34. Number of Potential Stops Along The Touring Alternative 1 ……. 73
35. The Layout of Touring Alternative 2 ……….. 76
36. Potential Stops Along The Touring Alternative 2 ………... 77
37. Potential Stops Along The Touring Alternative 3 ………... 80
38. The Layout of Touring Alternative 3 ……….. 81
I. INTRODUCTION
1.1. Background
Tourism is now one of the world’s biggest industries and will continue to
have significant role over the coming years. Over the past several decades, the
tourism industry has become one of the fastest growing industries within the
services sector. The level of contribution of the tourism industry to many
countries’ economic growth, like in Indonesia, has shown an increase over the
years. Tourism can create jobs, generate spending, stimulate business activity,
support local amenities and conservation, and add to the vitality and attractiveness
of places. Tourism must be properly managed, if its full potential is to be
realized.
In Indonesia, tourism industry has been giving a large contribution to the
country’s economic growth, especially in increasing the national income as the
third biggest contributor after oil and gas, and textile industry until 1997 (Tim
KLH and UNDP in Roslita, 2001). Though it has showed deprivation trends for
the last decades because of world economic crisis, but it still perform as a
promising industry for the country to be developed in future time. Its importance
is set to grow even more as the economy transforms into a post-industrial society.
With the rapid economic expansion that many countries have experienced, it is
highly likely that the tourism industry will be the main driver to bring about both
economic and social evolution∗).
∗
It is the existing potentials of the diversity of cultural, arts and natural
beauty of Indonesia that have become the basis of tourism development in
Indonesia∗). They also become important resources that play an essential role in
tourism industry. Indonesia is an archipelago country in South Asia that is
enriched with varied landscape forms and tropical natural beauty, as well as has a
large variety of cultural assets. There are many beautiful and attractive places all
over the country, either because of the cultural or natural beauty or even both of
them, which become very popular tourist destination places. Indonesia is also
known as one of the biggest tropical tourism destinations. It has the second
longest shoreline than any other countries in the world. The coastline has long
been a magnet for tourists, which has raised concerns about sustainable
development. Indonesia has plenty of beaches that become the famous tourist
destination places. One of the most famous beaches is the one that is located on
south coast of Java Island, namely Parangtritis Beach.
Parangtritis Beach is located on the south coast of Central Java, about 27
km to the south of Yogyakarta. It is the local legend that has claimed the
Parangtritis Beach as the location of the palace of Kanjeng Ratu Kidul, the ruler of
the Southern Ocean invisible world. It also has an important meaning based on
the history of Mataram Kingdom, which views the Parangtritis Beach as a part of
Merapi Mount – Kesultanan Palace – Parangtritis Beach trilogy. This kind of
trilogy is very strongly influenced by Javanese culture in which these three
components are associated with the unity of Agni – Udaka – Maruta trilogy
(Surono and Soelist, 1997).
∗
3
Regardless the truth, the Parangtritis beach is one of tourism site that is
visited by plenty of visitors from other places, both from domestic and abroad.
Unlike the other beaches that are normally associated with light colored sand,
Parangtritis Beach is covered with black colored sand, a specialty of Javanese
beaches due to the presence of volcanoes (Mahdzan, 2003). What is more, the
presence of sand dunes, as one of unique natural phenomena on earth, in this area
has added the quality of natural beauty of this destination. The sand dune
phenomenon in this area is the only one that can be found in Indonesia, even in
South East Asia. Moreover, at the site, there are many other interesting tourism
objects beside its famous beach, such as Parangwedang Hot Spring, Cepuri
Parangkusumo, Parangkusumo Beach, Maulana Maghribi grave yard, and Syeh
Belu-Belu grave yard.
Even though Parangtritis Beach has already known as tourist destination
place with its variety of tourism objects, but it is rarely including in a touring
system that serve the visitors with informative and recreative interpretation within
the current tourism management. The current tourism management still tends to
put emphasis on the value of each separate object within the coastal area with less
information about the area as a whole.
Concerning that issue, it is important to develop a touring plan for the
tourism network in the coastal area of Parangtritis integrated with the
interpretation of its local quality of natural, visual, and cultural factors. That
interpretive touring plan may lead to the successfulness of conservation and
conservation indirectly, by provoking the visitors about the significance values of
the tourism objects as well as tourism sites (Damayanti, 2003).
1.2. Objectives
The main objectives of this study is studying on developing a touring plan
in coastal area of Parangtritis based on its visual, natural, and cultural quality
assessments. Specifically, the objectives are:
! to analyze the visual quality of the study area based on its scenic beauty
estimation integrated with the visual character consideration;
! to analyze the natural and cultural quality of the coastal area of
Parangtritis;
! to make an integration among the visual quality assessment result and the
natural quality as well as the cultural quality to obtain a potential tourism
area and potential stops within the coastal area of Parangtritis; and
! to prioritize the most preferable touring plan that will be the linkage
among the potential stops or tourism objects within the coastal area of
Parangtritis.
1.3. Scope of Study
The main interest of this study is developing a touring plan in coastal area
of Parangtritis by assessing its potencies of visual, natural, as well as cultural
elements. The assessment of natural elements will characterize the natural quality
of the area. Meanwhile, visual element will be evaluated based on the scenic
together with visual character assessment which later will describe the visual
5
element. This assessment will evaluate the cultural pattern influences on the site
which usually represented by a variety of cultural forms, such as festivals,
architecture, historic sites, artistic performances, and heritage sites, as well as any
experiences that bring one culture in contact within the area.
All those three factors will be integrated in ranking from the most
potentially attractive area to the less ones for tourism within the coastal area of
Parangtritis. This arrangement together with interpretation program will be
considered in sequencing the visitor movement within the tourism area so that the
visitors can be served not only with the experiences of enjoying the visiting but
also with the informative interpretation of the sites they visit. The framework of
this study is illustrated in Figure 1.
Figure 1. Framework of Study
Coastal Area of Parangtritis
Cultural Element Natural Element
Scenic Visual
Character Spatial
Analysis
Spatial Analysis
Cultural Quality
Potential Tourism Area
Interpretation Program
Visual Element
Natural Quality Visual Quality
Spatial Analysis
II. LITERATURE REVIEW
2.1. Coastal Zone
Simonds (1978) viewed coastal zone as the area where land and ocean
meet. It is characterized by the wave that roll in to break upon sandy beaches, and
the wind currents strong, as well as the sufficient supply of sands. A rise of dunes
may be formed to the landward, and in rare cases these may tower to a height of
500 feet above mean sea level. The arrangement of beaches, dunes, and the
associated tidal wetlands has been perfectly formed by nature to serve as a
resilient buffer against the onslaught of the wind and sea.
Sain and Knecht (1998) also defined coastal zone as the place where the
waters of the seas meets the land, which is indeed the unique place in global
geography. What is more, the coasts are unique in a very real economic sense as
sites for port and harbor facilities, as well as the most productive and richest
habitats on earth as resulting bounty in fishes and other marine life. They are also
highly valued and greatly attractive as sites for resorts and as vacation
destinations, as well as valuable in many other ways.
But all those values can be easily diminished or even lost if the coasts are
being overused in any type, as there are definable limits to the amount of use to
which a beach can be subjected (Simonds, 1978). The presence of large and
growing populations in the world’s coastal areas creates major problems,
especially in developing countries, where more people in the coastal zones means
more pollution of coastal waters, more pressure on nearby natural resources, and
7
Obviously, the tendency of ever greater numbers of population migrating
to the coastal areas and also faster growing tourism industry based on the
resources have been causing serious pressure on these areas that could put the
value and productivity of them at risk. Unless effective step to manage these
areas are taken soon (Sain and Knecht, 1998). More specific, Simonds (1978)
argued a guideline in developing coastal beaches and wetlands, where all land
below the natural mean high water line should be in public ownership. A building
setback line from the beach should extend to the landward toe of the primary
dune, where one exists, or to the limits of highly productive or essential
stabilizing growth. Within conservation areas limited development may occur as
long as the more important landscape features are protected (Figure 2).
Figure 2. A development guideline for coastal beaches (Source: Simonds, 1978)
2.2. Tourism
Tourism is often associated with travel for pleasure. But actually it is not
all about the pleasure things, though nowadays tourism term always use as
synonymous as travel, as what Gunn (1994) has cited that tourism is defined as all
travel with the exception of commuting. More over, he also argued the most
people to destinations outside their normal places of work and residence, the
activities undertaken during their stay in those destinations, and the facilities
created to cater to their need. Tourism implies travel from one place to another.
Tourism can also be viewed as a system of generating areas connected to
destinations by routes traveled between these two sets of locations (Boniface and
Cooper in Gunn, 1994).
The purpose of traveling in tourism can be varied. It is explained with
another definition of tourism proposed by World Tourism Organization and UN
Statistical Commission in Holden (2000) that tourism comprises the activities of
persons traveling to and staying in places outside their usual environment for not
more than one consecutive year for leisure, business or other purposes. It is no
doubt that tourism for leisure is the most usual form of tourism, but there are still
many other types of tourism. It is endorsed by Davidson in Holden (2000) that
recreation or leisure is the main type of tourism, which includes travel for
holidays, sports, cultural events, and visiting friends and relatives, but people also
travel for business, study or education, religious and health purposes.
The main reason of why people visiting one place is that there is such
certain magnetism about that place. Gunn (1994) noted that the reasons are
grounded in the destination’s resources, natural and cultural, and the attractions
that relate to them. Generally the term ‘natural resources’ refers to five basic
natural features: waters, topographic changes, vegetations, wildlife, and climate.
Natural resources are very critical in supporting outdoor recreation that has been a
major travel purpose for many years. Cultural resources include all resources
9
included in this category are prehistoric sites, historic sites, places of ethnicity,
lore, and education; industries, trade centers, and galleries; and sites important for
entertainment, health, sports, and religion. Both of these two categories of
resources may also be used to classify attractions that are found in a tourist
destination place. Furthermore, Smith (1989) categorized the attractive factors in
a tourism site in five main categories, which are natural factors, cultural and social
factors, historical factors, recreational factors, and tourism infrastructure factors.
The attractions of a destination constitute the most powerful component of
the supply side of tourism. Attractions are those developed locations that are
planned and managed for visitor interest, activity, and enjoyment (Gunn, 1994).
Kelly (1998) concurs that the primary type of the attractions in a tourist
destination is the one that is mostly emphasized in tourism product which is being
marketed and delivered, such as ecotourism, nature tourism, adventure tourism,
getaway and stay, and cultural tourism.
2.3. Tourism Landscape Planning
Gunn (1994) noted that tourism cannot be planned without understanding
the interrelationships among the several parts of the supply side, which is
commonly associated with tourism site/product, especially as they relate to market
demand that is associated with population or visitors. In order to satisfy this
market demand, a variety of development and services as the supply side must be
well provided. How well this supply side matches the market is the key to reach
Gunn (1994) also viewed supply as composed of four components:
transportation, attractions, services and information and promotion, which are
related one to another. Tourism planning should identify opportunities in all five
components of supply (Figure 3).
Figure 3. Functioning Components of Supply (Source: Gunn, 1994)
Moreover, Kelly (1998) defined each of those five components in more
details. Transportation has to be considered on two levels. First is the linkage
between the tourists' place of origin and their destination; the second is the
destination region's transportation network. Attractions, which should be
explicitly expanded to include events, function in two ways in successful tourism
planning. One is they are the magnets that often entice a person to travel to a
particular destination, that dreamed experience, and second they are part of the
real tourism experience of a destination region. Service is the other significant
experience generating component of tourism. The focus of this component is
accommodation, and food and beverage establishments and their personnel. The
last structural component is information and promotion. It is important to provide
each tourist market segment with information and promotional materials that
Attraction
Transportation
Information Services
11
create the experience expectation and bring tourists to a destination. Another
aspect of these two components is providing good signage in the destination
region to ease and direct movement of people.
Gunn (1994) referred that a good tourism planning can provide betterment
of tourism that can enhance visitor satisfactions, improve the tourism economy,
stop the resource degradation and protect the resource assets, as well as enhance
the social and economic life of community integrated in the area. Kelly (1998)
emphasized that a successful tourism plan should take community vision and
community involvement that reflects the willingness of local residents to go the
cost necessary to support tourism in their living space. He also implied that
implementation and action plans are a must in tourism planning in order to create
coordination among people and organizations in a destination area. Monitoring
and evaluation are important to measure the success of the plan and to modify it if
it is not working out. It is unnecessary to measure everything about a plan; select
several key indicators and work with those over time.
In order to achieve a certain desired goals, tourism planning needs to be
approached at three different scales. The range of scale in tourism planning could
be from site specific physical plans to intermediary community and regional
destination plans to national policy plans. The site scale planning is an individual
property development. On the other hand, the destination planning works on a
destination zone that is formed from several primary elements including the
community, attractions, and traveler access and linkage between the communities
regional planning is needed when the greatest potential for a region or nation are
desired to determine (Gunn, 1994, 1997)
2.4. Visual Quality
Laurie (1975) defined landscape evaluation as the comparative
relationships between two or more landscapes in terms of assessments of visual
quality. In this context, assessments are the process of recording visual quality
through an observer’s aesthetic appreciation of intrinsic visual qualities or
characteristics within the landscape. Essentially, visual quality evaluation is but
one form of sensory perception of landscape and only one aspect of
comprehensive landscape evaluation for regional planning purposes.
There is another term used to express the visual quality of a landscape:
landscape aesthetics or landscape scenic beauty. As Porteous (1996) referred to
aesthetic is clearly of vital importance to the human sense of well-being and it
involves the art of discrimination of making judgments. Daniel and Boster (1976)
used scenic beauty in expressing human judgment of the environment visually in
response to his perception of a landscape. Moreover, they cited that landscape
scenic beauty is one of the most important of our natural resources.
Laurie (1975) cited that the need of visual quality in landscape evaluation
is commonly accepted as a product of the increased pressure of landscape changes
and of a growing need to protect the scenic qualities of the landscape as a resource
in limited supply. Evaluation in landscape may be either purely philosophic and
13
the fields of geography, planning, environmental psychology, economics, and
landscape design.
In assessing landscape aesthetics are not just a matter of qualitative
assessment, but it also requires quantitative assessment, as Fabos has referred in
Porteous (1996) that the familiar, vague, and subjective feelings about beauty,
expressed with emotion alone, are not enough. Quantitative assessment
techniques will ultimately provide that needed scientific rigor on which a new era
of planning and design can expand.
Daniel and Boster (1976) applied a method in measuring landscape visual
quality, namely Scenic Beauty Estimation (SBE). The general procedure of this
method is starting with determining the vantage point or observer position, taking
a photograph on selected landscape features or components, selecting photos that
should represent a particular landscape feature or component, and showing the
photographic representations to observers and obtaining their judgments.
2.5. Interpretation of Tourism Site
Alderson and Low (1996) cited the term of interpretation as both a
program and an activity. The program establishes a set of objectives for the things
we want our visitor to understand, meanwhile the activity has to do with the skills
and techniques by which that understanding is created. Essentially, how well the
visitor can understand the important meanings and relationships of the site they
visit depends on the program and the activity that together make up the
Veverka implied definition of interpretation that is defined as a
communication process designed to reveal meanings and relationships of our
cultural and natural resources to the public, through first hand experiences with
objects, artifacts, landscapes, or sites∗). Knudson et.al. (1995) emphasized this
definition by arguing that interpretation helps people to gain a sense of place, to
respond to the beauty of their environment, and the significance of their cultural
surroundings. How well the visitor understands the important meanings and
relationships of the site become the final product of the interpretive effort.
Interpretation is not just information that in many cases only presents
answers to questions that visitors are not asking. Interpretive communication
takes the information by transforming and translating the information into the
language of the visitor. To be truly "interpretive", the message (interpretive panel,
brochure, etc.) must follow the following criteria:
! The communication must first provoke the attention or curiosity of the
audience.
! Relate to the everyday life of the visitor – tell them "why they need to
know this information".
! Reveal the key concepts of the message or story through a unique
viewpoint – save the surprise ending or answer for last.
! Address the Whole – illustrate to the visitor how each individual stop
along the byway relates to the larger main interpretive theme or
educational concept of the total byway experience or story.
∗)
15 ! Has Message Unity– the design and presentation of the interpretive media
along the total byway will have a uniformed themed look (design, fonts,
historic dating, etc.).
2.6. Geographic Information System
Geographic information system (GIS) is a science of spatial information
based on convergence of the technological fields and conventional disciplines. It
acts as an inventory tool, analysis tool, and management tool. It essentially helps
in transformation of the discrete raw data via overlays into information for
decision making process (Krishna et al, 2000).
Geographic Information System is a very powerful tool in combination of
different types of data. It is defined as a powerful set of tools for collecting,
storing, retrieving at will, transforming and displaying spatial data from a real
world for a particular set of purpose. GIS allows the combination of different
kinds of data using models. GIS allows for the combination of the different kinds
of spatial data, with non-spatial data, attribute data and use them as useful
information in the various stages of spatial analysis (Gupta, 2000). Gunn (1994)
concurs that GIS is a very helpful tools in tourism planning process, as it can
assure that the speed and accuracy of performing computer mapping and spatial
analysis are improved greatly.
There are three important stages of working with GIS, as referred from de
By (2000):
! Data Entry, which is the early stage to collecting data about the study and get
! Data Analysis; which is the middle stage, while within this stage, the data is
reviewed to discover some desired information or solution.
! Data Presentation; the final stage in which the results of earlier analysis are
presented in appropriate way.
GIS provides a tool for effective and efficient storage and manipulation of
remotely sensed data and other spatial and non-spatial data types for both
scientific management and policy oriented information. This can be used to
facilitate measurement, mapping, monitoring and modeling of variety of data
types related to natural phenomenon. GIS can play a role at the following levels
(Banger, 2000):
! National level:
At national level, GIS can provide useful information at such a general level.
The objective is to give an inventory of many kind of specific information
within the areas affected or threatened for an entire country. Mapping scales
will be in order of 1:1,000,000 or smaller.
! Regional level:
At regional level the use of GIS is intended for planner in the early phase of
regional development projects or large engineering projects. GIS can be
utilized more for analysis at this scale, although the type of analysis will
mostly be qualitative, due to the lack of detailed information. But it can be
used to investigate the potential area on the development of rural, urban or
infrastructural projects. The areas to be investigated are large, generally
17
data is still rather low. Typical mapping scales for this level are between
1:100,000 and 1:1,000,000.
! Medium level:
At this level GIS can be used for the pre-feasibility study of developmental
management programs, at all inter-municipal or district level. Typical
mapping scale is in the order of 1:25,000 - 1:100,000. Slope information at
this scale is sufficiently detailed to generate Digital Elevation Models, and
derivative products such as slope maps.
! Local level:
The level of application is typically that of a municipality. The use of GIS at
this level is intended for planner to formulate programs at feasibility levels.
Typical mapping scales are 1:5,000 - 1:25,000. The details of information will
be high, including for example cadastral information. The size of area under
study is in the order of several tenths of square kilometer, indicating the
probability of occurrence for mapping units, with areas down to one hectare or
less.
! Site investigation scale:
At site investigation scale GIS is used in the planning and design of
engineering structure and in detail engineering measures to address the
management action on site. Typical mapping scale are 1:2,000 or larger.
Nearly all of the data is of a quantitative nature. GIS is basically used for the
data management, and not for data analysis, since mostly external
deterministic models are used for that, as 3D GIS can be of great use at this
2.7. Analytical Hierarchy Process
Analytical hierarchy process (AHP) is a systematic method for comparing
a list of objectives or alternatives. It is a comprehensive, logical, and structured
framework that allows improving understanding of complex decisions by
decomposing the problem in a hierarchical structure. The method will be
performed based on the three principles of AHP∗):
! Decomposition of the decision problem
! Comparative judgment of the elements
! Synthesis of the priorities.
The incorporation of all relevant decision criteria, and their pair wise
comparison allows the decision maker to determine the trade-offs among
objectives. This procedure recognizes and incorporates the knowledge and
expertise of the participants. It makes use of their subjective judgments, which is a
particularly important feature for decisions to be made on a poor information
base∗).
In the AHP, elements of a problem are compared in pairs with respect to
their relative impact on a property they share in common. A 1–9 scale is used in
the comparison, with 1 for representing the comparison value if the two objectives
are equal in importance, 3 if an elementis weakly more important than the other
one, 5 if the elementis strongly more important than the other one, 7 if itis very
strongly more important than the other one, and 9 is for absolutely more important
than the other. The values of 2, 4, 6, and 8 will represent the scale of intermediate
values between two adjacent judgments (Saaty and Kearns, 1985). A hierarchical
∗)
19
structure is used to illustrate the problem. The hierarchy is structured from the top
(Level 1: the goal of the study), through intermediate levels (Level 2: criteria on
which subsequent levels depend) to the lowest level, which is usually a list of
alternatives (Saaty and Kearns, 1985).
2.8. Coastal Area of Parangtritis
Based on the local legend, Parangtritis Coastal Area is believed to be
founded at the same time as the arrival of Dipokusumo, a fugitive from the
Empire of Majapahit. The term of Parangtritis is believed to be taken from
Javanese terms of Parang tumaritis, which mean dropping water (tumaritis) that
comes from top of the stone (parang), which is located near the meditation place
of Dipokusumo (Surono and Soelist, 1997).
Located about 27 km to the south of Yogyakarta, Parangtritis Beach has
long been famous, not only as a beach resort where sand-dunes, sandy beaches
and rocky cliffs meet, but also as a historical place closely linked to the
mysterious legend of the Queen of the South Sea, "Kanjeng Ratu Kidul".
Together with her confidant, the feared Nyai or Nyi Roro Kidul, the ever youthful
and beautiful queen, Kanjeng Ratu Kidul reigns over sea-nymphs and spirits.
According to legend, any person wearing clothing colored green will be lure into
the sea by the Queen and to their fate - a superstition firmly entrenched in the
minds of all Javanese; even as far North as Jakarta (Birchall, 1997).
The legend of Nyi Roro Kidul herself is very popular. Before turning into
daughter of King Mundangwangi and his first wife∗). The popularity of Dewi
Kandita and her mother Dewi Rembulan was beyond doubt. They were known
for their beauty, kindness and friendliness, and people loved them. However, the
misery of their lives began when Dewi Mutiara, another wife of King
Mundangwangi, became green with envy and grew ambitions to become the first
wife, thereby deserving full affection and attention from the king.
Dewi Mutiara's dream came true when one day she bore the son that the
king had long been yearning for. Through the assistance of a witch, Dewi Mutiara
made the king's wives Dewi Rembulan and Dewi Kandita suffer from 'strange'
disease, with their bodies covered with scabies that created the odor of fish. The
disease led them to be sent into exile in the forest where later Dewi Rembulan
died. After a long, hard and helpless journey, the scabies-covered Dewi Kandita
eventually arrived at a beach where she met a young, handsome man who
promised to cure her illness. At the request of the young man, Dewi Kandita
chased after him as he ran along the beach. When she reached the water, the man
disappeared and, to her surprise, all the scabies had disappeared but, strangely, she
could not move her legs. Half her body, from the waist down, had turned into the
body of a fish. Since then she became a sea-nymph, and the locals believe that
Nyi Roro Kidul is the manifestation of Dewi Kandita.
In some discussion of historical legend of Mataram Empire is always
related to the trilogy of Parangtritis Beach, Mount Merapi, and Yogyakarta Palace
(Kraton). It is believed there is a south axis connecting Mount Merapi, the
Kraton and Parangtritis Beach. The legends say that Kanjeng Ratu Kidul was
∗)
21
married to one of the Mataram Monarchs, Panembahan Senopati, a ruler of the
mighty Mataram Kingdom, whom she visited and enjoyed his company on certain
occasions. The Western section of Parangtritis beach - Parangkusumo Beach - is
believed to have been the meeting place between the two mighty rulers; that of the
sea and of the land (Birchall, 2002). Related to this, 'Labuhan' is performed there
every year, on the 30th day of the Javanese month of 'Rejeb'. It is the ceremony
of offerings given to Kanjeng Ratu Kidul that consist of fingernail cuttings and
hair of the Sultan of Yogyakarta, food and clothing - all cast into the sea in the
hope that the Sultan and the people of Yogyakarta will have continuous peace and
prosperity. The same ceremony is held on top of Mount Merapi and Lawu
(Birchall, 2002).
According to legend, volcanic activity also occurred at Parangkusumo
Beach. This resulted in a formation of rocks supposedly where the Sultan of
Yogyakarta and Kajeng Ratu Kidul met to discuss the well-being of the people of
Yogyakarta - and of their love for each other. Upon this formation of rock was
built a small rest house. On two special nights - Friday and Tuesday Kliwon
according to the Javanese calendar - people come from all over to meditate in the
spiritual ambience. Most nights, people can be found meditating at this small rest
III. METHODOLOGY
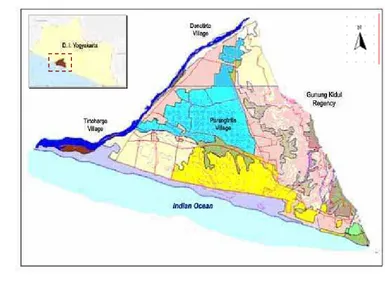
3.1. Time and Location of Study
This study was carried out from April until September 2006. It is
conducted in Parangtritis Village in Bantul Regency, Province of Yogyakarta.
This area is located between 110o16’40’’ to 110o20’20’’ East and between
07o59’15’’ to 08o01’10’’ South. Parangtritis Village is located within Kretek
District which covers an area of 967,201 hectares. Figure 4 shows the Parangtritis
Village inside of Yogyakarta Province.
23
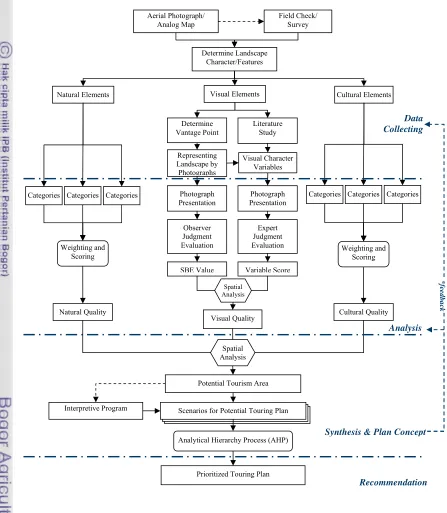
3.2. Method of Study 3.2.1. Flowchart of Study
The process of this study is diagrammatically illustrated in Figure 5.
Figure 5. Flowchart of Study
Natural Elements
Potential Tourism Area
Interpretive Program
Prioritized Touring Plan Visual Quality
Scenarios for Touring Alternatives Scenarios for Touring Alternatives Scenarios for Potential Touring Plan
Analytical Hierarchy Process (AHP) Field Check/
Survey
3.2.2. Data
Two methods will be carried out to collect the data, which are field
surveys and document or literature study. The data will be classified in four
aspects. The first three aspects are the main aspects to be considered in this study,
i.e.: natural (physical) aspect, cultural aspect, and visual aspect. The last aspect is
supporting aspect, which is used as additional but not less important than other
aspects in determining the most appropriate touring system on the synthesis stage.
The list of required data and the method used for collecting the data can be seen in
Table 1.
Table 1. Data Inventory and Collecting Methods
Collecting Methods Aspect Factor
Survey Literature
Hydrology ! !
Vegetation ! !
Natural/Physical
Landform and Topographic !
Legend/Myth ! !
Architectural !
Ethnicity ! !
Cultural
Tourism Economic ! !
Vantage/viewpoint assessment ! !
Visual
Landscape inventory ! !
Infrastructure ! !
Accessibility ! !
Administrative Boundary !
Supporting
Law and regulation !
Especially for Legend and Ethnicity factors within the cultural aspect, the
survey method for data collecting is by interviewing purposively some people
who are assumed to have a good knowledge about the legend and some histories
associated with Parangtritis Village. This information is also verified by some
information acquired from literature study.
25
3.2.3. Analysis
This stage will consist of two main types of analysis. It is differentiated
by the method used in the analysis. The first stage is analysis for visual quality
assessment, and the second one is analysis for natural and cultural element
assessment.
3.2.3.1. Visual Quality Assessment
In this stage, visual resources will be analyzed based on visual preferences
and visual character variables using Scenic Beauty Estimation (SBE) procedures
(Daniel and Boster 1976). The application of SBE method involves three main
steps: representing landscapes by color photos, presenting the photos to observers,
and evaluating observer judgments.
a. Visual Preferences Analysis
Daniel and Boster (1976) argued that to avoid introducing the biases as to
what is representative, an impartial sampling procedure is used here in
determining the vantage point. But first of all, the area needs to be stratified into
approximately equal sub areas based on certain characteristics. For this study,
land cover is used as the main classifier for the area’s diversity derived from
Bakosurtanal’s analog map at 1:25,000 scales and aerial photograph of
Parangtritis Village at 1:20,000 scales from Puspics UGM (2002), and verified by
field survey. This classification area consequently will affect the number of
photos required. Based on the previous study, three photos were considered to be
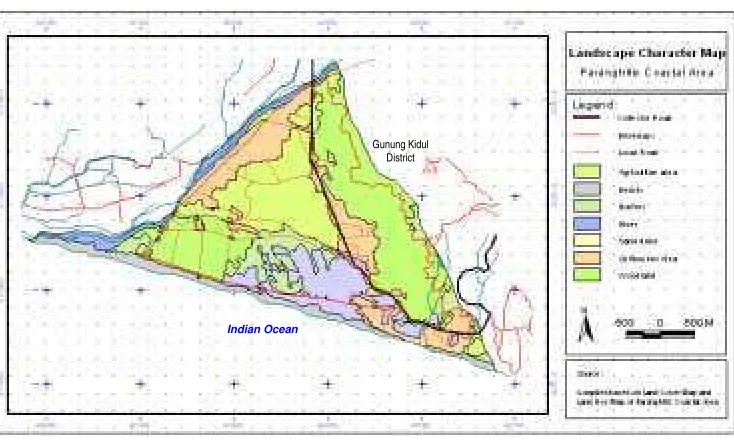
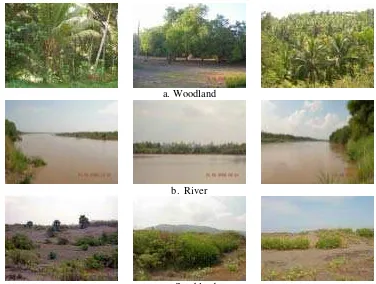
For this research, there are seven types of landscape character determined
based on land covering, which are:
1. beach,
2. sand dune,
3. rivers,
4. bushes (scrubland),
5. woodland,
6. agriculture area (farmland),
7. settlement area.
Three locations are taken within each landscape character to represent the sub area
with certain character, while within each location three photographs are taken
with different angles, so that there are totally 63 selected photographs to be
presented and being judged by the observers. Figure 6 shows the landscape
character map of Parangtritis Coastal Island.
Figure 6. Landscape Character Map of Parangtritis Coastal Area
The photographers will be equipped with a GPS and a camera when
pacing across each sub areas following randomly determined directions, and
Gunung Kidul District
27 stopping at locations dictated by a pre-determined pacing distance. At each
viewpoint, a picture is taken at an eye level along a randomly determined heading.
This procedure is repeated until the desired numbers of pictures are taken.
The acquired photos are then scrambled into a random order and
presented one at a time, using LCD projector device, about 8-10 seconds for each
photo, and being judged directly by the observer. The judgment values range
from 1-10 in scale, where 1 represents the lowest, and 10 represent the highest
judgment of visual preferences.
The observers selected here are college students, as for purpose of
developing, testing, and refining the method, college student served very well, and
also they can represent the total population in many respects (Daniel and Boster,
1976). Parts of the students are from landscape tourism planning class and the
rest of them are students of landscape architecture program. The other observers
are some practitioners in Landscape Architecture field and Mapping and Survey
field. They are selected based on their supporting background for scenic
assessment and also for their acknowledgments about varied landscape characters.
The number between 20 and 30 observers is assumed to be adequate by Daniel
and Boster (1976), and in this research, 60 observers were participated which
consist of 30 numbers of students and 30 numbers of practitioners.
After the photo judgment session, SBE values collected from observers are
calculated for each photo from an area based upon the judgments from observers.
The calculation starts by calculating the frequency of each score (f), the
cumulative frequency (cf), and cumulative probability (cp). Then the z values is
of the cumulative probability values, with adopting the convention of cp = 1 –
1/2n or cp = 1/2n for the cases where cp = 1.00 or cp = 0 (z = ± ∞) respectively
(Bock and Jones, 1968 in Daniel and Boster, 1976). Then the mean value of z for
each sub area can be determined to be further used to estimate SBE value of
particular sub area using the following formula:
where: x = 1, 2, 3, …, 63
SBEx = SBE value for sub area ‘x’
Zx = mean value of z for sub area ‘x’
Zo = determined z value of certain sub area as standard value
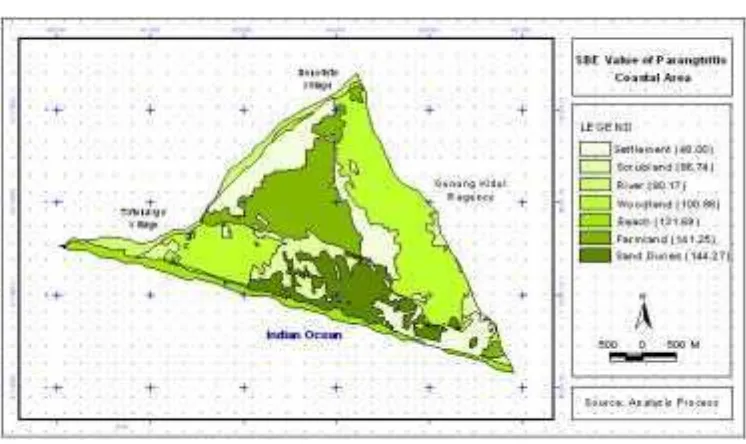
The acquired SBE values for each area of certain landscape character then are put
back to the area of each landscape character to obtain the spatial information of
SBE value distribution of the study area.
b. Visual Character Analysis
Akin with visual preferences analysis, this stage also evaluate the visual
resources of the study area. Other than evaluating based on observer’s
preferences, this stage analyzed visual resources with considering several
particular visual character variables adopted from ASLA (1979), which can be
distinguished by two levels of attributes: visual pattern elements and visual
pattern character. Visual pattern elements are primary visual attributes of objects,
which include: (1) form; (2) line; and (3) color. Visual pattern character is the
visual contrast between the visual object and its visual environment by
29 The same with visual preference analysis, the judgment procedure also
perform based on observation of the photo representing each area of landscape
character, but the judgment of the photos is based on several criteria associated
with seven selected visual character variables mentioned before. Regarding many
variables to be considered on the judgment for each photograph, therefore the total
photos to be judged is not as much as the total number of photos used in visual
preferences analysis method. In this stage, every area of each landscape character
is represented only by three photos taken from three different locations which are
believed as the best representation of the landscape character. Therefore, there are
only 21 photos that are judged by the expert.
There are nine experts who are invited to give their visual judgment to this
research. They are come from two different background of professional field.
There are four of them are come from Mapping and Survey environment, while
the rest are majoring landscape architecture, including the lecturers and
practitioners (detail information about the experts can be seen in Appendix 1).
They are selected based on their expertise, experiences, as well as
acknowledgments about varied landscape characters and their visualization, so
that they are believed to be able to give their expert judgment.
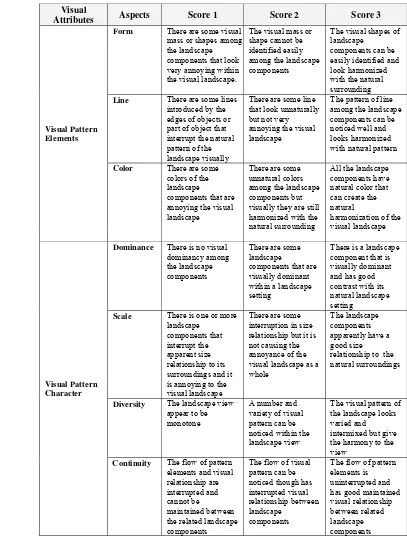
The given judgment are presented as scores that can be classified into a
range between 1 (low quality) to 3 (high quality). There are some criteria
determined as the guideline for the expert in giving the scores, so that the experts
can have the same prescription about the range of the scoring. The criteria for
with several experts in Landscape Architecture. Table 2 shows the criteria used as
the guideline in scoring activity.
Table 2. Criteria for Scoring the Visual Character Aspects
Visual
Attributes Aspects Score 1 Score 2 Score 3
Form There are some visual mass or shapes among the landscape components that look very annoying within the visual landscape.
The visual mass or shape cannot be identified easily among the landscape components
The visual shapes of landscape Line There are some lines
introduced by the edges of objects or part of object that interrupt the natural pattern of the landscape visually
There are some line that look unnaturally but not very annoying the visual landscape
The pattern of line among the landscape components can be noticed well and looks harmonized with natural pattern
Color There are some visually they are still harmonized with the
Dominance There is no visual dominancy among
There is a landscape component that is is annoying to the visual landscape
There are some interruption in size relationship but it is not causing the annoyance of the visual landscape as a whole
The landscape components apparently have a good size relationship to the natural surroundings
Diversity The landscape view appear to be
The visual pattern of the landscape looks varied and intermixed but give the harmony to the view
Visual Pattern Character
Continuity The flow of pattern elements and visual
The flow of visual pattern can be
31 The given scores from the experts are then calculated to obtain the average
score for each variable of visual character in every area of landscape character to
acquire thematic map of visual character variables. The last step of this visual
character analysis is by superimposing all those 7 acquired thematic map of visual
character variables to get the distribution of visual character scores map based on
the expert judgment.
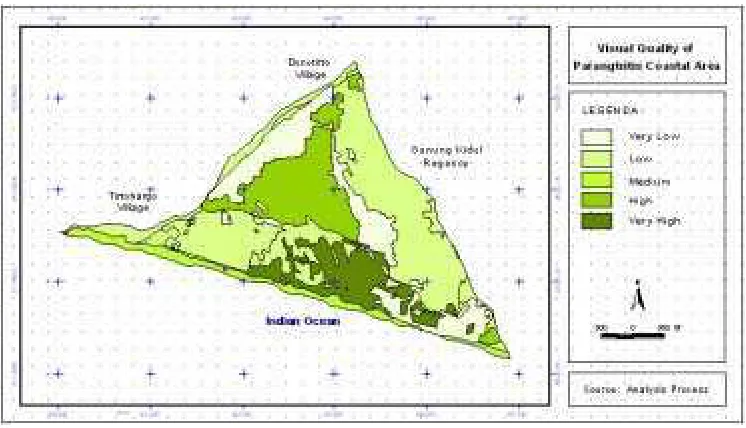
Finally, the visual quality of the study area is obtained by integrating the
result of visual preferences analysis with the result of the visual character analysis.
It is performed by overlaying the map of SBE values distribution with the map of
visual character scores distribution until the Visual Quality Map is acquired.
3.2.3.2. Natural and Cultural Elements Assessment
For both natural and cultural elements assessments, the method is adopted
from the technique of potential zones mapping applied by Gunn (1994) combined
with cartographic regionalization (Smith, 1989). The analysis pertain descriptive
quantitative analysis and spatial analysis based on spatial distribution of important
area characteristics. Any important or ‘critical’ features are being identified and
assessed spatially in this analysis stage.
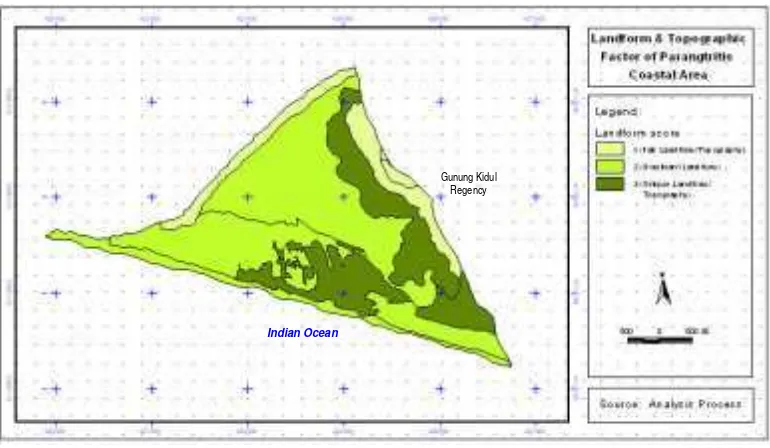
For natural elements assessment, the critical features are classified into 3
factors based on the physical characteristics of the study area which are
considered to be important factors in tourism development. The three factors are:
(1) landform and topography; (2) vegetation; and (3) hydrology. The spatial
distribution of these factors are mapped to obtain the spatial distribution within
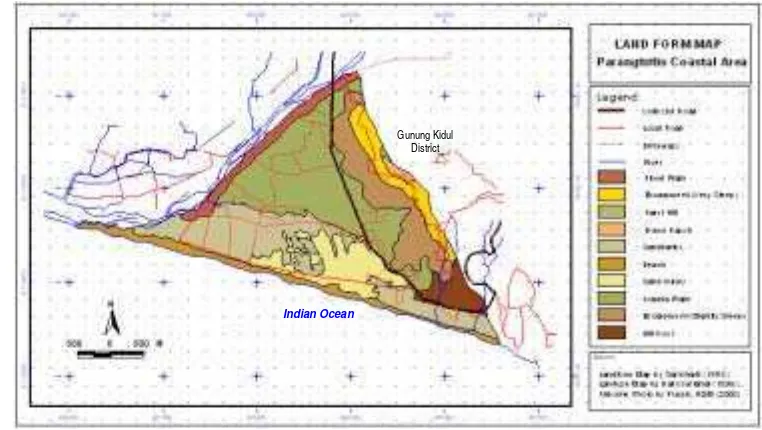
Land Form Map (Figure 7), and it is categorized based on its uniqueness of the
forming process and the topographic characteristics. Vegetation factor is
categorized based on its vegetative structure and environmental location and its
spatial features are identified based on Land Use and Land Cover Map.
Hydrology factor which is categorized into 2 categories: beach and river, is
mapped based on Land Use and Landform Map. River category is drawn as an
area using the assumption area as what has been applied by Roslita (2001) by
developing buffering area of 50 m alongside the river based on Keppres No.
32/1990. Beach feature is determined by the beach area adopted from the
Landform Map.
Figure 7. Land Form Map of Parangtritis Coastal Area
The critical features of cultural elements are classified into four factors
which are: (1) legend/myth; (2) tourism economic; (3) ethnicity; and (4)
architectural. The legend factor is categorized based on how well the legend is
known and believed by the community. Tourism economic is classified into
three categories based on its economic activity, such as tourism service activity,
Gunung Kidul District
33 fishery activity, and also agriculture activity. For the ethnicity factor, it is
classified based on its authenticity of the community ethnic within a certain area.
At last, the architectural factor is classified based on the architectural style of
buildings within the area of study.
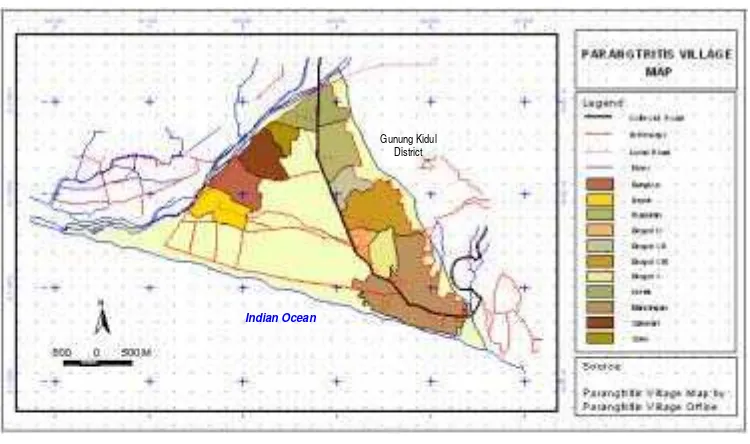
Neighborhood unit of the Parangtritis Village acquired from Parangtritis
Village Map taken from Parangtritis Village Office (Figure 8) is used to map all
of the categories of the cultural factors. This assumption area is used to present
all of the critical features of cultural elements spatially. It is based on Smith
(1989) who argued that the used of political unit as an operationally defined
spatial characteristics has given the advantage that the data sources will often be
available for them.
Figure 8. Village Map of Parangtritis
Acquiring from analog map of Parangtritis Coastal Area, spatial features
of infrastructure can be obtained. Infrastructure is taken into account as a
supporting factor in determining the potency of an area to be developed as a
tourism object or attraction. Infrastructure is the main access to a tourism object.
Gunung Kidul District
In this research, it is categorized based on road class classification. There are
three categories used: collector road, local road, and driveways, which are
considered as an area by using assumption area of road based on PP RI No.
26/1985, as what has been applied by Roslita (2001), especially for collector and
local road buffered with 7 m and 6 m successively, while driveways are buffered
with 3 m (Harris and Dines, 1988).
A measurement score for each characteristic is defined by using the
criteria that used by Gunn (1994) and Roslita (2001) that has been modified based
on the site condition of this research. The measurement criteria of categorization
and scoring are shown in Table 3.
Table 3. Measurement Criteria of Natural, Cultural, Supporting Features Scoring
Factor Categories Score Factor Categories Score
Unique 3 Dominant 3
River/Stream 2 Fishery 2
Sensitive environment 3
Tourism Economic
Agricultural 1
Woodland 2 Authentic 2
Vegetation
Cultivated plants (crop) 1
Ethnicity
Less authentic 1
Collector Road 3 Unique 3
Local road 2 Dominant 2
Infrastructure
Driveways 1
Architectural
Fair 1
Source: Gunn, 1994 and Roslita, 2001 (modified)
Each resource is rated based on supportive characteristic for tourism
activities, which consists of three classes: 1 (low), 2 (medium), and 3 (high). All
of those factors are weighted according to their influence in potential for future
development. The weighting process is adopted from Gunn (1994) with the
modification based on the study area characteristics (Table 4). These weighting
factors are further used to determine spatially potential resources capability
35 all of those resources factor maps are overlaid to obtain superimposed factors to
produce a composite map showing both Natural and Cultural Quality of
Parangtritis Coastal Area (Figure 9).
Table 4. Weighted Factors in Parangtritis Coastal Area
Natural Factors Weight Cultural Factors Weight
Landform and Topography 35 Legend/Myth 33
Vegetation 28 Tourism Economic 26
Hydrology 27 Ethnicity 21
Infrastructure 10 Architectural 10
Infrastructure 10
100 100
Source: Gunn, 1994 and Roslita, 2001 (modified)
Figure 9. Composite Mapping Process Based on Resource Factors
3.2.4. Synthesis
3.2.4.1. Acquiring Potential Tourism Area
Spatial analysis will be implemented in this stage. Spatial analysis is used
by overlaying the map of Visual Quality Map with Natural Quality Map, as well
as with Cultural Quality Map. The result of these maps overlay will be the Map
of Potential Tourism Area derived from visual, natural, and cultural resources
integrated with esthetical factor within the study area, as Gunn (1994) concurs that
the concept of beauty is essential for tourism.
3.2.4.2. Developing Touring Plan Alternatives
To develop a touring plan, there must be a pattern or sequencing to be
followed as a basic for tourist movement within the site. Orderly touring
development does not need to be rigidly oriented but should make the flow of
movement or walking, viewing, and experiencing places a pleasurable and
unobstructed event. It also has to provide a logical story and flow of thought with
a clearly defined themes, purposes, and objectives (Gunn, 1994). It may be
satisfied by developing an interpretation program of the site.
The main purpose of interpretation is to enrich the recreational experiences
of the visitors. Interpreters seek to produce enrichment of experience. They add
value to leisure time and activity (Knudson et.al., 1995). Self guided or guided
tours can be used to interpret natural and cultural resources within a destination
(Knudson and Orbasli in Damayanti 2003). A tourism track can invite visitor to
view the place and discover things there and also learn the values of them.
Damayanti (2003) applied 10 steps in developing an interpretive network:
1. to develop the vision that states what interpretation should be on site based
on site inventory,
2. to define the main theme and objective(s) of interpretation network,
3. to identify the potential stops, which in this research it would be based on
the existing tourism objects with also considering the acquired tourism
37
4. to determine the theme and objective(s) of each stop; elaborated based on
some literature study of site information, such as Center for Tourism
Research and Development UGM (1998 and 2000), Ismoyo (1994), and
some tourism leaflet about Parangtritis Tourism Area,
5. to study the sequence of stops that provides a logical story and flow of
thought or viewing with also considering the existing site infrastructure in
order to link the stops and decide the route; by considering the start and
end points of the network, making the loop track that bring the visitor back
to a clearly identifiable starting point, and interpreting about 10-20 stops
varying with the length of the track, where it is the number that most
visitors can remember for interpretive stops (Pilley in Knudson et.al.,
1995),
6. to analyze the touring track restriction and opportunities to plan service
and transportation program,
7. to plan the transportation mode and select the interpretive media for the
trail as well as the individual stops,
8. to create information and promotion programs,
9. to conduct the implementation and operation, and
10.to evaluate the effectiveness of the interpretation network in achieving the
objectives.
Those steps are used in this study in developing the alternatives of tourism track
within the Parangtritis Coastal Area. Those three alternatives are differentiated by
the main theme of each touring track in step 2, but will have the same vision of