Jurnal Ekonomi Pembangunan
Volume 14, Nomor 1, Juni 2013, hlm. 52-65
IMPACT OF AIR POLLUTION ON PROPERTY VALUES :
A HEDONIC PRICE STUDY
Endah Saptutyningsih
Fakultas Ekonomi Universitas Muhammadiyah Yogyakarta Jalan Lingkar Selatan, Tamantirto, Kasihan, Bantul, Yogyakarta
E-mail: [email protected]
Diterima 30 Februari 2013 / Disetujui 4 April 2013
Abstract: The main purpose of this study is the calculation of implicit prices of the environ-mental level of air quality in Yogyakarta on the basis of housing property prices. By means of Geographical Information System, the housing property prices characterized from the area which have highest air pollution level in province of Yogyakarta. Carbon monoxide is used as the pollution variable. The methodological framework for estimation is based on a hedonic price model. This approach establishes a relationship between the price of a marketable good (e.g. housing) and the amenities and characteristics this good contains. Therefore, if variations in air pollution levels occur, then households would change their behavior in an economic way by offering more money for housing located in highly improved environmental areas. The hedonic regression results that the housing price decrease while increasing the level of air con-tamination such substance as carbon monoxide.
Keywords: air pollution, hedonic price, property value, marginal willingness to pay curve JEL: Q53
Abstrak: Tujuan utama studi ini menghitung harga implisit dari tingkat kualitas lingkungan udara di Yogyakarta dengan berbasis pada harga properti perumahan. Dengan menggunakan sistem informasi geografis, harga properti perumahan dicirikan dengan daerah yang memiliki tingkat polusi udara tertinggi di provinsi Yogyakarta. Karbon monoksida digunakan sebagai variabel polusi. Kerangka metodologis untuk estimasi didasarkan pada model harga hedonis. Pendekatan ini menetapkan hubungan antara harga barang yang dipasarkan (misalnya perumahan) dan fasilitas dan karakteristik barang. Oleh karena itu, jika terjadi variasi dalam tingkat polusi udara, maka rumah tangga akan mengubah perilaku mereka secara ekonomi dengan menawarkan lebih banyak uang untuk perumahan terletak di daerah lingkungan yang baik. Hasil regresi hedonis menunjukkan bahwa penurunan harga perumahan akan menaik-kan tingkat pencemaran udara seperti misalnya karbon monoksida.
Kata kunci: polusi udara, harga hedonis, nilai properti, kurva kesediaan marjinal membayar JEL: Q53
INTRODUCTION
Urban pollution is a major focal point of public health concern and regularity activity (WHO, 2002). Pertinent guidelines and effective inter-ferences require knowledge of the burden of sickness and premature deaths attributable to specified pollutants. A long-term worldwide research program is focusing on effects of
par-ticulates and other criteria pollutants such as NO2, O3 and CO (Brunekreef and Holgate,
2002).
Impact of Air Pollution (Endah Saptutyningsih) 53
pollution on household’s welfare in cities such as province of Daerah Istimewa Yogyakarta. Carbon monoxide (CO) emitted by motor vehi-cles are the main concern because of high visi-bility of effect compared to other pollutants. Nonetheless, empirical studies on air-pollution related to welfare effects were rare. Therefore, the objective of this study is to identifythe high-estlevelof air pollution(especially CO) in Daerah Istimewa Yogyakarta and estimate household marginal willingness to pay for air quality improvement in the province ofDaerah Istimewa Yogyakarta. This study applied the hedonic method to province of Daerah Istimewa Yogya-karta which should serve as a suitable labora-tory for this method given the variation in pollution levels within the region, and the sim-plicity of the common housing types.
There are many centers of commerce and education that support the local economy in Daerah Istimewa Yogyakarta. The pollution problems arise due to the increasing number of motor vehicles which lead to imbalance of the number of motor vehicles with the capacity of the highway. So these cause the congestion, noise and air pollution problems. The number of vehicles in the province of Daerah Istimewa Yogyakarta (DIY) always increased from year to year. From 2000 to 2010 the number of motor vehicles has increased on average by 9.02 percent. This is because of the impact of the increasing number of motor vehicles. Therefore, it is necessary to map the region for identifying the areas that need to be prioritized for reduc-ing levels of air pollution. The largest number of vehicles in 2010 in Sleman District is about 493800 units, followed by the city of Yogyakarta as many as 367,957 units. The motorcycle dominate the streets of the five district/city in DIY. The number of motorcycles for 87.75 percent of all vehicles in the province of Yogya-karta. Sleman District has the highest number of vehicles in the province of DIY, motorcycle as much as 87.4 percent of all vehicle types in the district of Sleman, while the motorcycle as much as 83.9 percent of all types of vehicles in the city of Yogyakarta.
Residential property prices have increas-ingly been influenced by the quality of air and its deterioration therefore, affects urban
prop-erty values. In most of industrial cities the world over, consumers express their strong preferences for environmental amenities such as improved air quality and are even willing to pay for such improvements. Consumer’s WTP in turn has been influenced by structural char-acteristics like size of plot, number of rooms, garage space, central heating etc., public and socioeconomic characteristics like social secu-rity, quality of schools, racial composition, rate of employment, etc. and local amenities like environmental quality, access to services, com-munication, etc. (Parikh, et.al.,1994; Murty and Surendar Kumar, 2002 in P.K.Baby, 2003). Alt-hough all these factors influence the choices of consumers, the primary concern of this inquiry is to unearth how the quality of air influences property values.
The Hedonic Pricing Method applies a related market approach to acquire the value of an environmental amenity from indirect obser-vations (Rosen, 1974). Economic theory indi-cates that in certain circumstances, it is possible to separate the effects of various attributes of a good in ways by which they affects individual’s utility. For many environmental goods, it is often possible for individuals to choose levels of consumption through their choices. For instance, in a decision to buy a home, there is an implicit market for environmental quality. The demand for non market environmental goods such as air quality affects observed prices and consumption of other market goods. The most commonly applied model to measure this rela-tionship is the hedonic price model of environ-mental valuation.
changed from time to time depending on its cities, and have little reliability. Therefore it is necessary to assume the data to a single point representing a wide geographical area.
More recently, an understanding of the complex urban air quality has been reinforced by adopting urban air shed model. This model calculates the spatial and temporal variations and differences in the reactivity of air pollutants that can provide detailed spatial picture of pollutant levels. When combined with GIS techniques, this model can improve the meas-urement of exposure in relation to health (Cic-ero-Fernandez et al, 2001; Hoek et al, 2001).
The development of spatial data manage-ment within the framework of geographic information systems (GIS) has created a new era of environmental modeling. More powerful computers have made the air quality model run at the global and local spatial scale as possible. In order to understand the function of more complex models, modeling system should be composed of other subsystems (point and area sources of pollution, the description of the spa-tial height of the area, meteorological data and air quality monitoring network).
More recently, the use of GIS has become essential in providing the boundary with air quality models. Many models have been com-bined with GIS to simulate various
environ-mental processes such as those described in books written by Longley et al. (2001). In the case of a scale model of the air, the data is more detailed about the room needed to include the effects of buildings and other man-made on the distribution of air pollutants, (Janour, 1999). Apart from this approach, statistical theory is also used to demonstrate the spatial-temporal interactions as described by Briggs et al. (2000).
Based on the background above, this study will identify the highest polluted area in Yog-yakarta by using Geographic Information Sys-tem (GIS) approach. It is expected to estimate the benefits to local households to reduce air pollution in the district /city in the province of Daerah Istimewa Yogyakarta (DIY). Total bene-fits consisting of health benebene-fits, and the benefit of the environmental ease of reducing urban air pollution can be estimated using the model of hedonic property value model.
The table 1 presents some summary of related research studies will be conducted.
RESEARCH METHOD
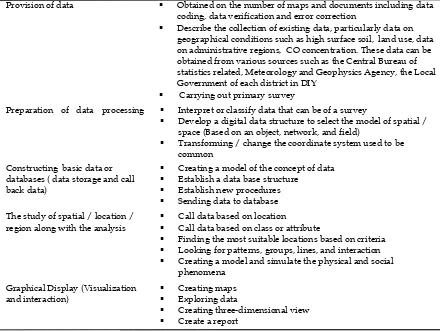
Standard procedure in designing and using GIS, namely: data collection, preliminary data processing, database construction, analysis and spatial analysis, and presentation graphics.
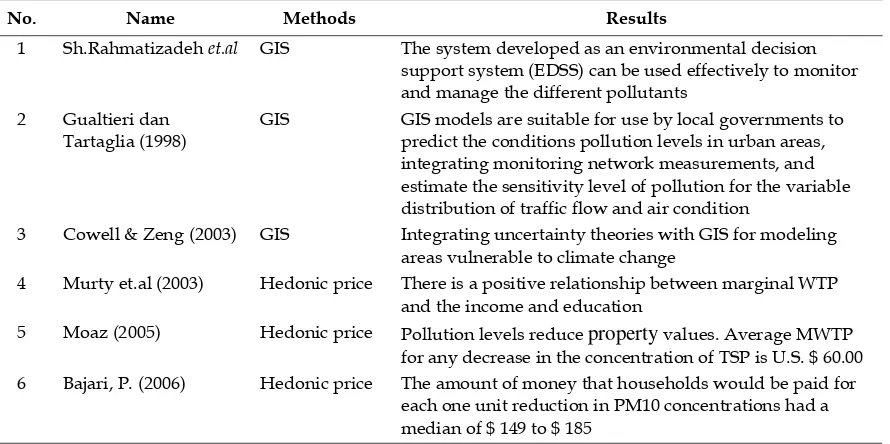
Table 1. Previous Studies
No. Name Methods Results
1 Sh.Rahmatizadeh et.al GIS The system developed as an environmental decision support system (EDSS) can be used effectively to monitor and manage the different pollutants
2 Gualtieri dan Tartaglia (1998)
GIS GIS models are suitable for use by local governments to predict the conditions pollution levels in urban areas, integrating monitoring network measurements, and estimate the sensitivity level of pollution for the variable distribution of traffic flow and air condition
3 Cowell & Zeng (2003) GIS Integrating uncertainty theories with GIS for modeling areas vulnerable to climate change
4 Murty et.al (2003) Hedonic price There is a positive relationship between marginal WTP and the income and education
5 Moaz (2005) Hedonic price Pollution levels reduce property values. Average MWTP for any decrease in the concentration of TSP is U.S. $ 60.00 6 Bajari, P. (2006) Hedonic price The amount of money that households would be paid for
Impact of Air Pollution (Endah Saptutyningsih) 55
These data are included to adjust the needs analysis, course of study.
Each region has a unique and dynamic series of potential hazards. When certain areas are known to have known vulnerabilities and inhabited by many people, it can be done immediately act to reduce the losses incurred. According to Connors (2006), GIS can be used to access the potential risks that might occur. GIS unit integrates different data to provide a rough picture of the impact of air pollution on society.
Modeling of Air Pollution Using Kriging Technique
Kriging is group of geostatistical techniques for interpolating the value of a random field (e.g., elevation, z, of the landscape as a function of geographic location) in locations that are not observable from the observed value at a nearby
location.
The theory of Kriging interpolation and extrapolation to be developed by the French mathematician Georges Matheron based on a Master's thesis Gerhardus Daniel Krige. Kriging including linear least squares estimation. As illustrated in Figure 3, the goal of Kriging is to estimate the value of a real-valued function of the unknown, f, at some point, x *, given the values of the function at some other point,, x1, ..., xn. A kriging estimator is said linear because the predicted value is a linear combination which can be written as
∗ ∗
Weight i is the solution for a system of linear
Table 2. Main Activity Procedures in SIG
Provision of data Obtained on the number of maps and documents including data coding, data verification and error correction
Describe the collection of existing data, particularly data on geographical conditions such as high surface soil, land use, data on administrative regions, CO concentration. These data can be obtained from various sources such as the Central Bureau of statistics related, Meteorology and Geophysics Agency, the Local Government of each district in DIY
Carrying out primary survey
Preparation of data processing Interpret or classify data that can be of a survey
Develop a digital data structure to select the model of spatial / space (Based on an object, network, and field)
Transforming / change the coordinate system used to be common
Constructing basic data or databases ( data storage and call back data)
Creating a model of the concept of data
Establish a data base structure
Establish new procedures
Sending data to database
The study of spatial / location / region along with the analysis
Call data based on location
Call data based on class or attribute
Finding the most suitable locations based on criteria
Looking for patterns, groups, lines, and interaction
Creating a model and simulate the physical and social phenomena
Graphical Display (Visualization and interaction)
Creating maps
Exploring data
Creating three-dimensional view
equations obtained by assuming that f is a sam-ple path of the random process F (x) and pre-diction error should be minimized in some sense. For example, the assumption is that the simple kriging mean and covariance of F (x) is known and then, kriging predictor is one that minimizes the variance of the prediction error.
Hedonic Price Analysis
The hedonic price technique is a method for estimating the welfare effects of environmental assets and services by estimating the influences of environmental attributes on property value. The hedonic price theory assumes that as envi-ronmental quality changes, property prices would also change, indicating a scope for esti-mating an implicit demand function for the environmental goods by observing the property price variations. So hedonic prices are defined as the implicit prices of the attributes and are revealed to economic agents from observed prices of differentiated products and the spe-cific amounts of characteristics associated with them (Banarjee,S. in Bhattacharya, 2002).
Following the general principles of con-sumer’s behavioral theories, decisions in property markets are governed by demand supply interactions. The basic hedonic property model can be explained as given below.
Let the price of ith residential location (PPRICE) be
PPRICEi = PPRICE (Si , Ni , Ei ) (1)
where, Si is structural characteristics, Ni is neighbourhood characteristics, Ei is environ-mental characteristics
Consider the utility function of the individual who occupies house i as
u (X , Si , Ni , Ei ) (2)
where, X represents composite private good that is taken as a numeraire. Assume that pre-ferences are weakly separable in housing and its characteristics. The individual maximizes (2) subject to the budget constraint,
M = X + PPRICE (3)
the first order condition for choice of environ-mental amenity qj is given as,
(4)
The partial derivative of (1) with respect to one of the environmental quality characteristics qj, (air quality), give the implicit marginal price of that characteristics.
In the second stage, MWTP for environ-mental quality is expressed as a function of qj, given Si, Ni, Ei* and Wi , where Ei* is the vector of other environmental characteristics and Wi is socioeconomic characteristics.
bij = bij (qj , Ei*, Si , Ni , Wi ) (5)
Equation (5) gives the individual’s MWTP for the improvement in environmental quality qj.
RESULTS AND DISCUSSION
Analysis of the Geographical Information System
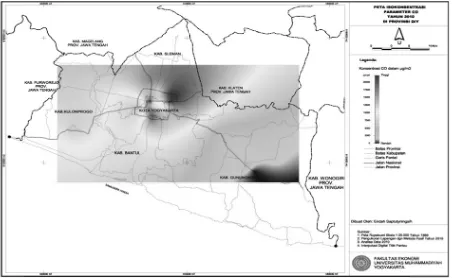
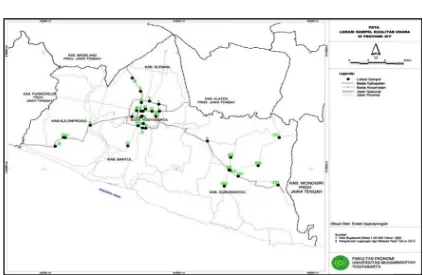
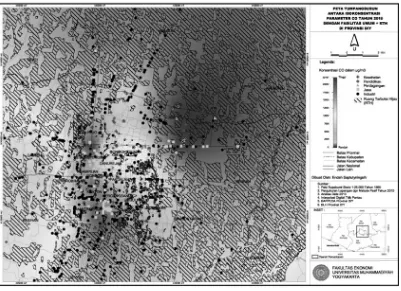
Mapping with Kriging technique is performed at several sample points in the province of Dae-rah Istimewa Yogyakarta. Some point locations can be seen in the Figure 1 in Appendix.
WHO (1992) states that at least 90 percent of carbon monoxide (CO) in urban air come from vehicle emissions. The levels of carbon monoxide (CO) in urban areas are quite varied depending on the density of motor vehicles that use gasoline. In general, the maximum CO levels at peak hours in the morning and even-ing. The variations of CO levels are also influ-enced by the varied topography and the surrounding buildings. Impact of CO poisoning is very dangerous for people who have suffered heart muscle disorder or severe peripheral cir-culation.
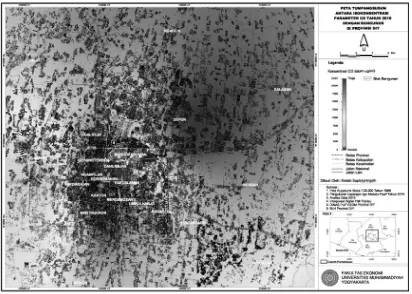
Impact
ased on the ntration of C f Yogyakarta it can be m ghest concen rah Istimew n the provin
hat have the man regency
ub-districts. include Jetis n, Mantrijero ampilan, Ged stricts (see Fi
y overlappin of CO par ng in the ar ntration of C it would be tion of CO in
n sub-distr relatively s strict which tion of CO in
are many bu
ution (Endah e monitorin CO in four a by using mapped the a
ntration of C a Yogyakart nce of Yogy e highest con
are Depok, While in th s, Gondoma
reas which CO in the pr found the n Sleman reg rict that ha
small compa is also has n the provin uilding bloc
Figure 2.
Saptutyning ng results o
counties an
region has a gency. It cov ave the bu
ared with D s the highest nce of Yogya
cks in Depok
Isoconcentrat rovince of D y the buildin Jetis, Gond antrijeron su tivities. Man ogyakarta sh ween isoconc ublic facilitie hich there nters in Jet anan, Wirob ub-districts,
rvices and s economic a quire vehic ddition, com dustries can O in the regi The highe on products
green open O in the city
CO in the Pro
se there are enters and se the city of Y highest conce DIY – is almo ng blocks bec omanan, Wi ub-districts ny building howed by centration o es (see Figu
are many tis sub-distr brajan, Kra there are m some health activity and cles which mbustion pro n also cause h
ion.
er vehicle’s that are not n space cause y of Yogyak
ovince of DIY
many resid ervices.
Yogyakarta entration of ost entirely d cause in the
irobrajan, K heve many
blocks in t the overlay of CO param
ure 4 in Ap
services an ict. While i ton, and M many indus centers. Ma
other publi exhaust CO oducts gener
high concen
exhaust and offset by the es the concen arta relative
57
dential and
- which is CO in the dominated areas such raton, and
stries and ny centers ic facilities O gas. In rated from ntrations of
can be shown in Figure 5 in which the region of Yogyakarta is still rare green open space.
Unlike the city of Yogyakarta, and Ngaglik Depok sub-districts have abundant green open space, although in certain areas there is no green space leading to high concentrations of CO in the region. This is also compounded by the many education centers, health and indus-tries are clustered in certain areas (see Figure 5 in Appendix).
Data Description
Results of mapping with GIS methods conclude that the areas which have the highest concen-tration of CO in the city of Yogyakarta include Jetis, Gondomanan, Wirobrajan, Kraton, and Mantrijeron sub-districts. In addition, some sub-districts such as Ngampilan, Gedongten-gen, and Mergangsan in part also have relative high concentrations of CO. In Sleman regency, some sub-districts such as Depok, Ngaglik and Kalasan are also relatively have high CO concentrations.
In order to estimate a hedonic price func-tion, it is necessary tp gather data on all char-acteristics that relevant to the sales prices of the house. The explained variable, price of house, is considered as a function of environmental, structural, and neighbourhood variables and these data sets relate to the residential areas of
mapping results by GIS above. Data from 250 households were collected using a structured questionnaire.
The table 3 shows that the average house price is 300 million rupiahs. Area of house is one of the important variables affecting house prices. The average area of land is 206.5 square meters. The average area of building is 124.28 square meters. Another factor which influences residential property price is the number of rooms that a house has. The average number of rooms observed for houses in the study area is four.
Among the ‘neighborhood variables’, six major ones – distance from school, distance from hospital, distance from supermarket, dis-tance from restaurant, disdis-tance from the city, distance from main street – are also considered for this analysis. The distance calculated is that from the residence of the household to the nearest location related. The average distance from school is 512.94 meters. The distance from the nearest hospital is 956.26 meter on average. The average distance from main street is 192 meters.
One of the ‘socioeconomic variables’ is the number of family member. The average number of family member is four people.
In the hedonic price model that we adopt in this study, the concentration of CO is taken
Table 3. Description and Summary Statistics of Variables
Variabel Description Mean Stand.Deviation
PPRICE Sales price of house (Rupiahs) 3E+008 243617628.2
LANDSIZE Plot area (m2) 206.05 198.288
BUILDSIZE Building area (m2) 124.28 111.246
NUMROOM Number of rooms (units) 4.00 4.614
WSTRUCTDUM Dummy structure of wall 1.15 0.497
DISSCHOOL Distance from school (m) 512.94 555.328
DISHPITAL Distance from hospital (m) 956.26 802.810
DISSPMARKET Distance from supermarket (m) 990.68 867.411
DISREST Distance from restaurant (m) 642.64 785.568
DISCITY Distance from city (m) 2062.04 1592.980
DISMSTREET Distance from mainstreet (m) 192.01 165.511
GARDENDUM Dummy for close to garden or not 1.79 0.407
INCOMEDUM Dummy for level of income 1.88 0.509
FAMEMBER Number of family members (people) 3.92 1.356
Impact of Air Pollution (Endah Saptutyningsih) 59
as measure of air quality. The data used comes from ambient air quality monitoring of Badan Lingkungan Hidup of DIY. The ambient air quality for the year 2010 is 16060 µg/m3 on
average.
Estimation of the Model
Estimation of the Hedonic Model was under-taken in two stages (Rosen, 1974). In the first stage, the hedonic property price function was estimated and the implicit prices were com-puted for all the observations. In the second stage, implicit demand function or the marginal willingness to pay function was derived from the hedonic price function for given sets of environmental characteristics. The procedure is explained below.
(1) Specification of the Hedonic Price Function
The hedonic price function relates price of resi-dential property to the structural, neighborhood and environmental characteristics of the property (Murty, 2003)1 and is estimated using
a simple least square regression model. Fol-lowing this general specification and refining it by dropping insignificant variables, the hedonic price function is estimated as follows.
ln PPRICE= a0 +a1 ln LANDSIZE + a2 ln
BUILDSIZE + a3 ln DISSCHOOL +
a4 ln DISHOSPITAL+a5 ln CO + e
where, ln PPRICE is natural log of property price, ln LANDSIZE is natural log of plot area, ln
BUILDSIZE is natural log of building area, ln DISSCHOOL is natural log of distance from school, ln DISHOSPITAL is natural log of distance from
hospital, ln CO is natural log of CO
The partial derivative of this function with respect to air quality gives its implicit marginal price. This price is the additional amount which the household would be willing to pay for
1 The model is specified as follows:
LnPh i = 0 + j Sji + k Qki + l Nli + I ,
where, i = 1,2,…,n; Si = structural characteristics, Ni =
neigh-bourhood characteristics, Qi = environmental characteristics
From the above hedonic price function, implicit price(s) of environmental characteristic (s) is calculated. First partial derivative of the hedonic price function with respect to environment quality provides the implicit price.
choosing a house with reduced amounts of air pollution, other things remaining the same. The marginal implicit price is estimated as follows.
. 1 5
(2) Specification of the Implicit Demand Function
Estimated implicit prices for different sites cor-respond to the individual willingness to pay (WTP) for a marginal unit of environmental good purchased. The individual chooses the level of characteristic at which their Marginal Willingness To Pay (MWTP) for that charac-teristic is equal to its implicit marginal price. The inverse demand function is then obtained by regressing implicit price as a function of air quality, CO, and other socio economic features of individuals along with a demand shift varia-ble, such as income. The regression equation for inverse demand function in general is:
lnIMPPRICE = b
0+b
1Y +
b
2sosec +
b
3struc+
b
4neigh +
b
5env + u
where, Y is the annual income of the household,
sosec is the social economic characteristics, struc
is the structural characteristics, neigh is neigh-bourhood characteristics, and env is environ-mental characteristics.
However, if some or many of structural characteristics were not significant, these factors could be neglected while specifying the relation. So after omitting the insignificant variables through trial and error method, the implicit price function considered for final estimation is:
lnIMPPRICE = b
0+ b
1INCOMEDUM +
b
2ln LANDSIZE + b
3ln BUILDSIZE
+
b
4ln DISSCHOOL + b
5DISHPITAL +
b
6ln CO +
where,
ln IMPPRICE
is natural log of implicit
price;
INCOMEDUM
is level of income.
Empirical Results and Interpretation
envi-ronmental characteristic CO and the property price. All the structural parameters included in the model, like plot area and building area, are expected to have positive relations with the property price. Neighborhood characteristics like distance from school and hospital are inversely related with property price. It is normally expected that as distance from hospital and school increases, property price decrease, where as distance from city increases property price also increases. Applying these assumptions on the model specified above, the parameters are estimated using the method of ordinary least squares and is given in Table 4.
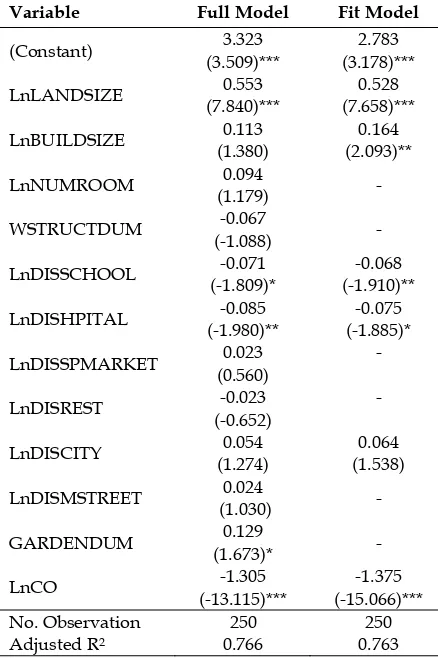
Table 4. Regression Result of Hedonic Price Function
Variable Full Model Fit Model
(Constant) 3.323
(3.509)***
2.783 (3.178)***
LnLANDSIZE 0.553
(7.840)***
0.528 (7.658)***
LnBUILDSIZE 0.113 (1.380)
0.164 (2.093)**
LnNUMROOM 0.094
(1.179) -
WSTRUCTDUM -0.067
(-1.088) -
LnDISSCHOOL -0.071 (-1.809)*
-0.068 (-1.910)**
LnDISHPITAL -0.085 (-1.980)**
-0.075 (-1.885)*
LnDISSPMARKET 0.023 (0.560)
-
LnDISREST -0.023
(-0.652)
-
LnDISCITY 0.054
(1.274)
0.064 (1.538)
LnDISMSTREET 0.024
(1.030) -
GARDENDUM 0.129
(1.673)* -
LnCO -1.305
(-13.115)***
-1.375 (-15.066)*** No. Observation
Adjusted R2
250 0.766
250 0.763
The main inferences of this analysis are given below:
(1) All the neighborhood and structural char-acteristics except building size, wall structure, number of rooms, distance from supermarket, distance from restaurant, distance from city, and distance from main street are statistically
significant at 5 percent level of significance. (2) The environmental characteristic, CO, is negatively related to house price and it signifi-cant at 1 percent level. The results also confirm that as the level CO increases by one percent house price reduces by 1.375 percent on the average.
(3) Among the neighborhood characteristics, the distance from city positively related to property price. It showing that when distance increases, property price also increases.
(4) Distance from school or hospital are nega-tively related to house price, showing that the plots nearer the school or hospital have high property values.
(5) The plot area and bulding area are also positively related to property price.
The regression results of the hedonic price function shows that all the significant estimated variables follow the expected relationship pat-tern. Hence the estimated equation could be written as:
ln PPRICE = 2.783 + 0.528 lnLANDSIZE + 0.164 ln BUILDSIZE –
0.068 ln DISSCHOOL –
0.075 ln DISHPITAL –
1.375 ln CO + e
Calculation of Implicit Marginal Price
The first derivative of the hedonic price function can be interpreted as the implicit marginal price function for the environmental goods. Descriptive statistics of implicit marginal prices for 250 observations is given in the table 5.
Table 5. Descriptive statistics of Implicit
Marginal Price
Descriptive Statistics Implicit Marginal Price (Rupiahs)
Mean 20.592,0
Standard error 1.133,2
Median 15.147,9 Mode 13.200,0 Standard deviation 17.917,4
Impact of Air Pollution (Endah Saptutyningsih) 61
Hence the marginal implicit price for reducing CO is calculated as Rp20.600,00. This result clearly identifies air quality as an important factor, along with structural and neighbourhood characteristics, in determining demand for property transaction in Daerah Istimewa Yogyakarta.
Implicit Demand Function
As mentioned earlier, second stage estimation of inverse demand curve is conducted by regressing the implicit marginal price on the quantity of environmental goods purchased and other socio economic features including income level of the individuals. The results are given in table 6.
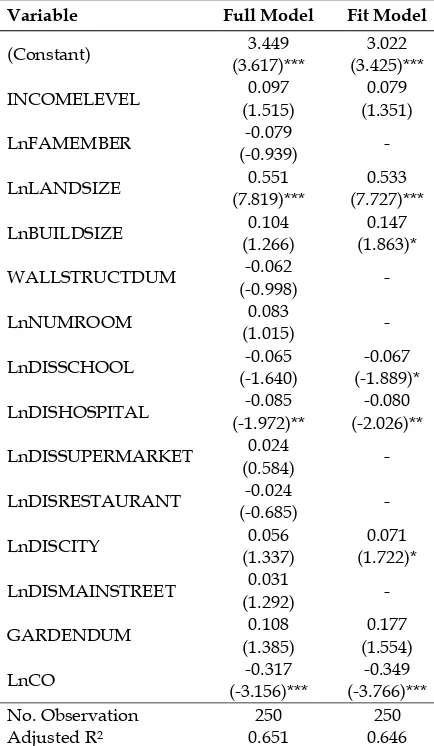
Table 6. Estimation of Inverse Demand Function
Variable Full Model Fit Model
(Constant) 3.449
(3.617)***
3.022 (3.425)***
INCOMELEVEL 0.097
(1.515)
0.079 (1.351)
LnFAMEMBER -0.079
(-0.939) -
LnLANDSIZE 0.551
(7.819)***
0.533 (7.727)***
LnBUILDSIZE 0.104
(1.266)
0.147 (1.863)*
WALLSTRUCTDUM -0.062
(-0.998) -
LnNUMROOM 0.083
(1.015) -
LnDISSCHOOL -0.065
(-1.640)
-0.067 (-1.889)*
LnDISHOSPITAL -0.085 (-1.972)**
-0.080 (-2.026)**
LnDISSUPERMARKET 0.024
(0.584) -
LnDISRESTAURANT -0.024
(-0.685) -
LnDISCITY 0.056
(1.337)
0.071 (1.722)*
LnDISMAINSTREET 0.031
(1.292) -
GARDENDUM 0.108
(1.385) No. Observation
Adjusted R2
250 0.651
250 0.646
The major inferences are:
(1) The first derivative of the implicit marginal
price function with respect to CO is negative (-0.349) signaling decreasing marginal implicit prices for increasing environmental quality. It means that in the study area, a reduction in CO by one percent leads to 0.349 percent increase in property values.
(2) The coefficient of number of family mem-bers, wall structure, distance from supermarket, and distance from main street are not significant.
(3) All other variables except number of family members, wall structure, distance from supermarket, and distance from main street are significant at 5 percent level of significance. It is interesting to note that the distance from city increases by one percent, residential property value enhances by 0,071 percent.
(4) Plot area and building area are positively related to residential property values.
So far we have explained the hedonic price function estimation and its implications to residential property values. The results indicate very clearly that the households are willing to pay for improved air quality. It is therefore necessary to estimate the welfare benefits accruing to them trough the purchase of property with reduced air quality.
CONCLUSION
The primary objective of this study was to establish the relationship between air quality and the residential property values di province of Daerah Istimewa Yogyakarta. By mapping the area which has highest concentration of CO earlier and estimating the hedonic property value in the area, we can establish the relation-ship between air quality and the residential property values.
supermarket, plot area, and building area are positively related to property price while distance from hospital and distance from restaurant are negatively related.
By adopting a two-stage estimation proce-dure to estimate these relationships, we found that, on the average, an increase in the level of CO reduced property prices in the study area by 1.375 percent. We estimated the marginal implicit price for reducing CO as Rp 20.600,00. Estimates further revealed that the households are willing to pay an additional amount of 0.35 percent for a reduction in CO. In short, the analysis revealed a positive response of house-holds in Daerah Istimewa Yogyakarta -which have highest concentration of CO - between air quality and property prices.
REFERENCES
Bajari, P and CL Benkard. 2005. “Demand Esti-mation with Heterogeneous Consumers and Unobserved Product Characteristics: A Hedonic Approach”. Journal of Political Economy, 113(6), 1239-1276.
Bhattacharya, Rabindra, N. 2002. Environmen-tal Economics: An Indian Perspective. New Delhi: Oxford University Press.
Boyle, M. and K. Kiel. 2001. “A Survey of House Price Hedonic Studies of the Impact of Environmental Externalities”. Journal of Real Estate Literature. Vol. 9, No 2, pp.
117-144.
Briggs, D.J.; de Hoogh, C.; Gulliver, J.; Wills, J.; Elliott, P.; Kingham, S.; Smallbone, K. 2000. “A Regression based Method for Mapping Traffic-related Air Pollution: Application and Testing in Four Con-trasting Urban Environments.” Sci Total Environ 253(1-3): 151-167.
Cicero-Fernandez, P.; Torres, V.; Rosales, A.; Cesar, H.; Dorland, K.; Munoz, R.; Uribe, R.; Martinez, A.P. 2001. “Evaluation of Human Exposure to Ambient PM10 in the Metropolitan area of Mexico City using a
GISbased Methodology”. J Air Waste
Manag Assoc 51: 1586-1593.
Civis, S, Z. Zelinger, M. Strizik, Z. Janour. 2001. “Simulation of Air Pollution in a Wind Tunnel”. In: Spectroscopy from Space.
(Demaison, J., Ed.), Kluwer Academic, Dordrecht, 275-299.
Cowell PJ and Zeng TQ. 2003. “Integrating Un-certainty Theories with GIS for Modeling Coastal Hazards of Climate Change.”
Marine Geodesy, 26, 5-18.
Gualtieri G., & Tartaglia M. 1998. Predicting Urban Traffic Air Pollution: a GIS frame-work, Transportation Research - D, 3(5), pp. 329-336, Elsevier Science.
Hoek, G.; Fischer, P.; Van Den Brandt, P.; Goldbohm, S.; Brunekreef, B. 2001. “Esti-mation of Long-term Average Exposure to Outdoor Air Pollution for a cohort study on mortality.” J Expo Anal Environ Epidemiol 11(6): 459-469.
Holgate. 2002. Air Pollution and Health. Lancet, 360: 1233-1242.
Janour, Z., Z. Zelinger, S. Civis. 1999. “Laser Photoacoustic Spectrometry and its Ap-plication for Simulation of Air Pollution in a wind tunnel”. Analyst, 124, 1205-1208. Jones C B, Kidner D B, Luo L Q, Bundy Gl And Ware J M.. 1996. Database design for a Multi-scale Spatial Information System.
Int. Journal of GIS, 10(8), pp.901-920. Lave, L.B. and Seskin, E.P., 1972. “Air pollution,
climate, and home heating: their effects on US mortality rates”. Am J Public Health 62 7, pp. 909–916
Longley, P.A., M.F. Goodchild, D.J. Maguire, D.W. Rhind. 2001. “Geographic Infor-mation Systems and Science.” John Wiley & Sons, 27- 58, New York.
Moaz, Alsherfawi Aljazaerli. 2005. “Hedonic Valuation of Marginal Willingness to Pay for Air Quality in Metropolitan Damas-cus.” Forum of International Development Studies, 3 September 2005.
Pollu-Impact Pollution on Values: A S Agglomerati Applied Econ Science and T d, T. M. G. E
Figure 1. Sam
ution (Endah dia. Institu hi Universit
d Thurston, G ween 1980 U ative Measu ontext of So arthquake H mote Sensin
niversity of D Thesis.Woo
mple Locatio
Saptutyning te of Econ ty Enclave, p
G.D. 1987. “ US Mortality ures of Air
Risk Anal 7
Impacts o alth and Pro Cochin Indu
. Departme chin Univers
India. easuring the ocial Vulnera
Province of D
win. 1974. “ Inspired R of Applied S
983. Applied Environmen
., Publ, Com “Attributab Level of De Table 9 in Th
he World hea
mewa Yogyak
63
Prices and erentiation
al of
Politi-1. (Jan. -
he Ant-Bee gent Based lgorithm”,
alth Report,
Figure 3. i
Figu
. Isoconcentr in the Provin
ure 4. Overla that Ha
ration Map o nce DIY
ay Map betw ave the High
f CO in the A
ween Isoconc hest Concen
Areas that H
centration o ntration of C
Have the High
of CO and Bu CO in the Pro
hest Concentr
uilding in th ovince of DI
ration of CO
he Areas IY
Impactt of Air Pollu Figure 5.
ution (Endah
Overlay Ma Green Ope CO in the p
Saptutyning
ap between en Spaces in
province of D
gsih)
Isoconcentr n the areas th
DIY
ration of CO hat have the
O and Public highest con
c Facilities a ncentration o
65 and