INHIBITION KINETICS OF
Sida rhombifolia
L. EXTRACT TOWARD XANTHINE OXIDASE BY
ELECTROCHEMICAL METHOD
Dyah Iswantini
1,2,*, Muammar Yulian
1,3, Sri Mulijani
1, and Trivadila
1,2 1Department of Chemistry, Faculty of Mathematics and Natural Sciences, Bogor Agricultural University, Jl. Agatis Kampus IPB Darmaga, Bogor,West Java, 16680,Indonesia
2
Biopharmaca Research Center, Bogor Agricultural University, Jl. Taman Kencana No 3, Bogor, West Java, 16151, Indonesia 3
Ar-Raniry State Islamic University, Banda Aceh, 23111, Indonesia
Received August 25, 2013; Accepted January 8, 2014
ABSTRACT
Sida rhombifolia L. is a traditional medicinal plant that has been known with potential as antigout. The previous research suggested that flavonoids crude extract of S. rhombifolia had an inhibitory activity toward xanthine oxidase by 71% and a spectrophotometric measurement showed that the type of flavonoids crude extract inhibition was a competitive inhibition. The purpose of the research was to investigate the type of inhibition kinetic of S. Rhombifolia’s ethanol extract by electrochemical method and to compare the measurements of linearity and sensitivity between spectrophotometric and electrochemical methods. The results showed that the yield of S. Rhombifolia’s ethanol extract was 9.82% with the inhibitory activity ranging from 13.64% to 82.69% (5.00-200 mg L-1) and IC50value was 91.15±5.74 mg L-1. Allopurinol as a control showed the inhibitory activity of 15.26-70.95% (0.10-4.00 mg L-1) and IC50 value was 2.45±2.21 mg L-1. Inhibition kinetics of the ethanol extract caused a KMincrease and unchange of VMAX.
Based on the data, the type of inhibition kinetics was a competitive inhibition, with an inhibitor affinity (α) value of
3.18. Linearity of xanthine oxidase activity assay by electrochemical and spectrophotometric methods showed the range of 0.01-1.00 mM (R2 = 0.978) and 0.05-0.70 mM (R2 = 0.977) respectively. The sensitivity of electrochemical
method was reported higher (0.95 μA mM-1
) than the spectrophotometric method (0.007 min-1).
Keywords:inhibition kinetics; Sida rhombifolia L.; xanthine oxidase; electrochemical method
ABSTRAK
Sida rhombifolia L. merupakan tanaman obat yang telah diketahui memiliki potensi sebagai antigout. Penelitian terdahulu menunjukkan bahwa ekstrak flavonoid sidaguri memiliki daya inhibisi terhadap enzim xantina oksidase hingga 71% dan pengukuran secara spektrofotometri menunjukkan ekstrak flavonoid tumbuhan ini mengikuti mekanisme inhibisi kompetitif. Tujuan penelitian ini adalah untuk menentukan tipe kinetika inhibisi dari ekstrak etanol herba sidaguri dengan metode elektrokimia serta membandingkan linearitas dan sensitivitas pengukuran antara metode spektrofotometri dan elektrokimia. Hasil penelitian menghasilkan rendemen ekstrak etanol sebesar 9,82% dengan daya inhibisi mulai dari 13,64% hingga 82,69% (5,00-200 mg L-1) dan IC50 sebesar 91,15±5,74 mg L
-1 . Adapun allopurinol sebagai kontrol diketahui memiliki daya inhibisi sebesar 15,26-70,95% (0,10-4,00 mg L-1) dan IC50 sebesar 2,45±2,21 mg L
-1
. Kinetika inhibisi dari ekstrak etanol pada konsentrasi 100 ppm menyebabkan peningkatan nilai KM (0,187 mM atau meningkat sebesar 68,73%) dari 0,0855 mM menjadi 0,2718 mM, tanpa mengalami perubahan Vmaks. Berdasarkan hasil tersebut dapat dikatakan tipe kinetika inhibisi yang terjadi mengarah
pada tipe kinetika inhibisi kompetitif dengan nilai afinitas inhibitor (α) sebesar 3,18. Metode elektrokimia
menunjukkan linearitas pengukuran yang lebih baik dibandingkan metode spektrofotometri, masing-masing pada rentang 0,01-1,00 mM (R2= 0,978) dan 0,05-0,70 mM (R2 = 0,977). Sensitivitas metode elektrokimia (0,95 μA mM-1) juga lebih baik dibandingkan metode spektrofotometri (0,007 min-1).
Kata Kunci:kinetika inhibisi; Sida rhombifolia L.; xantina oksidase; elektrokimia
INTRODUCTION
Uric acid is final product of purine metabolism. Abnormal conditions of uric acid metabolism will cause
important role in purine metabolism and functions to catalyze hypoxanthine oxidation into xanthine and, xanthine into uric acid. The well known xanthine oxidase inhibitors (XOIs) is allopurinol, which is one option out of the many synthetic drugs used in modern medicine for the treatment of gout [2]. Nevertheless, the use of allopurinol can cause side effects such as allergies, fever, and gastrointestinal disorders. The side effects of synthetic drug use such as allopurinol have prompted people to turn to traditional medicine that utilizes herbs (medicinal herbs) which is safer and more effective.
Sida rhombifolia L.is one of a traditional medicinal plant that has been known with potential as antigout. Iswantini et al. [3] reported that flavonoids crude extract of this plant has a high inhibitory activity of XO, ranging from 48 to 71% (100-800 mg L-1). Not only in a single composition, Sida rhombifolia L. potential as antigout in the combined formula has a higher inhibitory activity compared to allopurinol, and this result has been patented and has been granted [4]. In addition to its potential as antigout, the inhibition kinetics determination of S. Rhombifolia’s extract as a drug candidate is also one very important thing. The determination of inhibition kinetics type which is formed can subsequently explain the inhibitory mechanism formed and describe the affinity formed between XO enzyme as a target with drug candidate compounds, whether it is temporary (competitive inhibition and uncompetitive inhibition) or permanent (non-competitive inhibition).
Flavonoids crude extract of S. Rhombifolia was found out to show the competitive inhibition toward XO [3]. Luteolin and quercetin were reported to follow the competitive inhibition against XO [5]. A noncompetitive inhibition of XO, among others, is indicated byFraxinus angustifolialeaf extract [6] and Tephrosia purpurea root extract [7], while the caulerpenyne (CYN) from the extract of Caulerpa prolifera was reported to show the uncompetitive inhibition [8].
Method that is commonly and widely used to determine the type of inhibition kinetics is spectrophotometry. Spectrophotometric method is now becoming obsolete, because it is less specific, expensive, highly sensitive to light and is affected by turbidity [9-10]. Therefore, there should be a method which is easier, accurate, rapid and sensitive in the determination of the type of inhibition kinetics. Campanella et al. [11] reported that the electrochemical method was more effective and selective and could overcome the weaknesses of the spectrophotometric method. This method is very promising because of the relatively fast analysis time, which requires inexpensive instrument, accurate, easy miniaturization, and simple operation protocols [12-13]. Electrochemical method for determination of uric acid which have been developed by Arslan [14] using the immobilized uricase with
glutaraldehyde on polyaniline-polypyrrole (pani-ppy) composite film by crosslinking procedure on the surface of a platinum electrode. Ivekovic et al. [15] developed amperometric uric acid biosensor based on uricase with H2O2 transducer and electrode modified with Prussian blue.
The purpose of research was to investigate the type of inhibition kinetics of S. Rhombifolia’s ethanol extract using an electrochemical method and to compare the measurements of the linearity and sensitivity between electrochemical and spectrophotometric methods.
EXPERIMENTAL SECTION
Materials
Sida rhombifoliaL. Plants were collected from its natural habitat in Bogor, East Java, Indonesia.
Instrumentation
Instuments used in this research were an eDAQ potensiostat (Ecorder 410), and data processing software of Echem v 2.1.0. In which an Ag/AgClelectrode, a platinum disk, and carbon paste electrode were used as the reference, counter electrode, and working electrode, respectively, and spectrophotometer.
Procedure
Preparations of carbon paste electrode
Preparations of carbon paste electrode referred to Mirrel et al. [16] with modification. A carbon paste was made from a mixture of graphite powder and paraffin liquid with ratio 2:1 into one end of a glass tubing, and the surface was smoothed and cleaned with a piece of waxed paper. Finally, electrode surface was coated with a dialysis membrane, covered with nylon fibre and tied with parafilm.
Electrochemical measurements
response after each addition were observed and recorded.
The inhibitory assay against XO
The inhibitory assay were measured at optimum conditions have been determined previously. The potent inhibitory activity (%) of the crude extract was determined by changes in the XO activity which is analogous to current (I) before and after the addition of extract. Extract concentration varied in the range of 5-200 mg L-1. In addition, the inhibitory activity of allopurinol as a control was also determined by the same procedure.
The Kinetic inhibition assay against XO
The assay was only done on the extract concentration closest to the IC50 value. The type of extract inhibition kinetics was determined by analysis of the Lineweaver-Burk plot. This kinetics study was carried out in the absence and presence of extract with varying concentration of xanthine as the substrate.
Spectrophotometric measurements
Spectrophotometric measurement referred to Tamta et al. [17] which was modified for the determination of velocity assumed as XO activity. Into a tube was inserted 1.9 mL phosphate buffer 50 mM pH 7.5. One milliliter xanthine and 0.1 mL xanthine oxidase 0.1 U/mL were added, and then the solution was incubated at room temperature for 45 min. After the incubation, 1 mL HCl 0.58 M was immediately added to terminate the reaction. The absorbances of the mixed solution were measured at 269.5 nm.
RESULT AND DISCUSSION
Extraction
The dried sample yielded 9.81% of crude extract. Ethanol was used as extracting material because it has two groups with different polarity, i.e. the hydroxyl group which is polar and the alkyl group which is non-polar. Polar and nonpolar compound in the sample are expected to be extracted into the ethanol in the presence of the two groups.
Inhibitory Assay of the Extract against XO
Performance of enzyme activity is generally affected by temperature, pH, and substrate concentration. Therefore, optimization of XO activity was done to study the effects of these parameters on XO activity. Optimized parameters include temperature (25-35 °C), pH [6-9], and substrate concentrations (0.10-1.00 mM). Based on those contours (data not
Table 1. Potent inhibitory effect (%) of several concentration of extract on the activity of xanthine oxidase
No [S. Rhombifolia] (ppm)
Current ∆Ipa
(μA) Inhibitory Effect(%)
1 0 1.173 0
Table 2. Potent inhibitory effect of several
concentration of allopurinol on the activity of xanthine oxidase
No [allopurinol] (ppm)
Current ∆Ipa
(μA) Inhibitory Effect(%)
1 0 1.160 0
shown), the optimum conditions for each of the parameter temperature, pH and xanthine concentration was 30 °C, pH 7.5, and 1.00 mM. Kong et al. [18] was reported the condition of similar pH. As for the other different measurement conditions, it was reported by CeCngiz et al. [8], that is, at a temperature of 37 °C and pH 9.0. The differences in the optimum conditions for the measurement of temperature and substrate concentration are caused by different methods, tools and measurement time.
The potential of ethanol crude extract as antigout was determined by observing the inhibitory activity of the extract at various concentrations against XO activity. Analyses of these various concentrations were aimed to investigate the effects of the increase in the concentration on the inhibitory activity. In addition, concentration variation will facilitate and provide flexibility to the selection of the extract concentration to be used as a candidate on kinetics inhibition assay.
Fig 1.Relationships between xanthine concentration and current responses as XO activity
method showed an inhibitory activity of 48-70.71% at a concentration of 100-800 mg L-1.
The measurable differences of the inhibition effect in this study and Iswantini et al. [3] were presumably because the spectrophotometric measurement which is strongly influenced by the concentration of test solution so that the response becomes less good. It can be indicated that the electrochemical method can respond to the inhibitory activity of extracts better compared to the spectrophotometric method. According to Thuong et al. [19] a compound is said to be active if it has a value of IC50less than 100 mg L-1. The results showed the IC50 values of extract of 91.15±5.74 mg L-1.
Inhibitory Assay of Allopurinol against XO
As comparison in this study, the inhibitory activity and IC50 of allopurinol (Table 2) were also determined. The analysis showed that allopurinol had a stronger inhibitory activity with IC50 value of 2.45±2.21 mg L
-1 . Other studies on allopurinol inhibitory activity indicated that IC50 allopurinol which is varied, among others, 6.1 μg mL-1
[20-21], 3.74 μg mL-1
[22] and 4.29 μg mL1
[23]. This indicated that the electrochemical method carried out in this study gave a value of IC50 which was relatively small compared with the spectrophotometric method reported by Umamaheswari et al. [20] and Azmi et al. [22]. However, several other studies have also reported the IC50 value which was relatively smaller at 0.6 μg mL-1
[24]. IC50 values in some of these studies may be different because it is influenced by differences in observing conditions [25].
Linearity and Sensitivity Measurement
Effect of substrate concentration on the XO activity can be determined by measuring the activity of XO with varying concentrations of xanthine as the substrate. Fig. 1 which is identical to the Michaelis-Menten curve shows the relationship xanthine concentration and XO activity.
Reaction catalyzed by the enzyme was occured in two phases. First, if the substrate concentration is low, the enzyme active sites did not fully interact to the substrate. Second, when the substrate concentration increases, the active sites is bound entirely by substrate and at this time the enzyme has been working at full capacity so that the addition of substrate does not affect XO activity [10]. When the concentration of xanthine is less than 1.00 mM, the reaction is in the first phase and when the xanthine concentration is greater than 1.00 mM, XO activity is in the second phase.
Fig. 2 shows the linear relationship between substrate concentration and current responses as XO activity by the electrochemical method in the range of 0.01-1.00 mM. Linear range obtained in the electrochemical measurement is better when compared with the results obtained with the spectrophotometric method. The spectrophotometric measurement was
carried out at the maximum wavelength (λmax) 269.50
nm and showed a linear measurement in the substrate concentration range of 0.05-0.70 mM (Fig. 3). Spectrophotometric measurement gave high absorbance (>2) at the substrate concentration >0.70 mM in the calibration curve of xanthine, that indicates the less accuracy and precision of measurement. Therefore, the electrochemical method can respond analyte more specifically and in the wider concentration range than the spectrophotometric method.
Fig 2.Linearity between xanthine and XO activity (Vmax) by electrochemical method
Fig 3.Linearity between xanthine and xanthine oxidase activity (Vmax) by spectrophotometric method
determining the velocity of enzymatic reactions that form the basis for determining the type of inhibition kinetics. The other researches by electrochemical methods were reported to give varying sensitivity values. A smaller sensitivity value, among others, was reported at 0.55 μA mM-1 [29] and 0.062 μA mM-1
[30]. While the higher of sensitivity values was reported by Zhao et al. [31] of 29.5 μA mM-1
. The electrochemical method can also be reported more effectively than the spectrophotometric method in determining the type of inhibition kinetics because electrochemical method requires a shorter analysis time, higher sensitivity and the amount of material required is also relatively less than the spectrophotometric method.
Kinetic Properties of XO
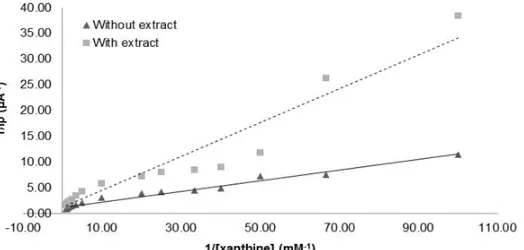
Concentration of selected extracts in inhibition kinetics assay was 100 ppm. The selection was based on its high inhibitory activity (>50%) and the closest concentration of IC50 extract values that had been obtained previously. Qualitative analysis of the enzymatic reaction is generally carried out by Michaelis-Menten curve, but the curve is very difficult to determine the value of KM and Vmax. Therefore, in this study the determination of KM dan Vmax values was carried according to Lineweaver-Burk plot (Fig. 4).
Fig 4.Lineweaver-Burk plot of XO inhibition with various concentrations of xanthine, addition of 100 ppm of ethanol extract of Sida rhombifolia L., without ethanol extract and Lineweaver-Burk transformed data were plotted and followed by linear regression of the point
Michaelis-Menten constant (KM) and maximum velocity (Vmax) which is analogous to a maximum current (Imax). Based on the analysis of Lineweaver-Burk plot (Fig. 4), it resulted a significant change of KMvalue and very small Vmax change. The kinetic pattern that forms after the addition of extracts as inhibitors resulted in an increase in KM from 0.0855 mM to 0.2718 mM, an increase of 68.73%. The Imax value decreased from 0.82338 to 0.82325 and the small decrease in the Imaxvalue could be assumed there was no change [32]. Based on the results it can be concluded that ethanol crude extract of this plant leads to the type of competitive inhibition kinetics as can be concluded from similar Vmax and different Km values [33].
Electrochemical measurements give a smaller value of KM and a higher value of VMax which were previously obtained on spectrophotometric measurements by Iswantini et al. [3]. KMis a measure of substrate affinity for the enzyme. The smaller the KM value obtained on electrochemical method shows that this method can measure the substrate affinity of the enzyme even at relatively lower concentrations than in the spectrophotometric measurements.
The inhibitor affinity value (α) of the enzyme can be determined by calculating the ratio between the value of KM with inhibitors and KM values without inhibitor. The inhibitor affinity (α) of extract was 3.18. These conditions indicate the existence of strong competition between the extract and the substrate to bind with the active sites of enzyme. The Competitive inhibition kinetics of S. Rhombifolia’s ethanol extract found in this study reinforce the previous research by Iswantini et al. [3] which explains a competitive inhibition of S. Rhombifolia’s flavonoids crude extract with smaller α value of this research, that is, 2.32.
CONCLUSION
The S. Rhombifolia’s ethanol extract has a potential as XO inhibitor as indicated by its inhibitory
activity up to 82.69% (200 ppm) and IC50<100 mg L -1
. Inibition kinetics of the ethanol extract caused a change of KM and similiar of Vmax. Thus, the type of inhibition kinetics leads a competitive inhibition, with an inhibitor affinity (α) value of 3.18. Electrochemical and spectrophotometric measurements showed a linear region of each measurement in the range of 0.01-1.00 mM and 0.05-0.70 mM. The sensitivity of electrochemical method in velocity measurement was
reported to be higher (0.95 μA mM-1
) than the spectrophotometric method (0.007 min-1). Electrochemical method provides fast analysis time, high sensitivity, easy operation, and inexpensive method in determining the type of inhibition kinetics.
REFERENCES
1. Akram, M., Asif, H.M., Usmanghani, K., Akhtar, N., Jabeen, Q., Madni, A., Saeed, T., Rehman, R., Ahmed K., and Shah, A., 2011,Afr. J. Biotechnol., 10 (6), 996–998.
2. Connor, M., 2009,Br. J. Pharmacol.,156, 1, 4–6. 3. Iswantini, D., Darusman, L.K., and Hidayat, R.,
2009,J. Biol. Sci., 9 (5), 504–508.
4. Iswantini, D., Darusman, L.K., Rahminiwati, M., Iskandar, Heryanto, R., 2010, Formula Ekstrak
Gabungan Apium Graveolens dan Sida
Rhombifolia L. sebagai Fitofarmaka untuk Penyakit Gout: Inhibitir Xantin Oksidase, Patent ID P00200400339.
5. Pauff J.M., and Hille, R., 2009,J Nat Prod., 72 (4), 725–731.
6. Berboucha, M., Ayouni, K., Atmani, D., Atmani, D., and Benboubetra, M., 2010,J. Med. Food., 13 (4), 896–904.
7. Nile, S.H., and Khobragade, C.N., 2011, Indian J. Nat. Prod. Resour.,2 (1), 52–58.
9. Chen, G., Ni, S., Zhu, S., Yang, J., and Yin, Y., 2012, Int. J. Mol. Sci., 13 (3), 2801–2809.
10. Iswantini, D., Nurhidayat, N., Trivadila and Widiyatmoko,O., 2013,Pak. J. Biol. Sci., 1–5. 11. Campanella, L., Bonanni, A., Bellantoni, D., Favero,
G., and Tomassetti, M., 2004, J. Pharm. Biomed. Anal., 36 (1), 91–99.
12. Grieshaber, D., MacKenzie, R., Voros, J., and Reimhult, E., 2008,Sensors, 8 (3), 1400–1458. 13. Fan, C., Plaxco, K.W., and Heeger, A.J., 2003,
PNAS, 100 (16), 9134–9137.
14. Arslan, F., 2008,Sensors, 8 (9), 5492–5500.
15. Iveković, D., Japec, M., Solar, M., and Živković, N., 2012,Int. J. Electrochem. Sci., 7, 3252–3264.
16. Mirel, S., Sandulescu, R., Kauffmann, J.M., Roman, L., 1998, J. Pharm. Biomed. Anal., 18 (4-5), 535– 544.
17. Tamta, H., Kalra, S., and Mukhopadhyay, A.K., 2005,Biochemistry, 71 (Suppl. 1), S49–S54.
18. Kong, L.D., Cai, Y., Huang, W.W., Cheng, C.H.K., and Tan, R.X., 2000,J. Ethnopharmacol., 73 (1-2), 199–207.
19. Thuong, P.T., Na, M.K., Dang, N.H., Hung, T.M., Ky P.M., Thanh, T.V., Nam, N.H., Thuan N.D., Sok, D.E., and Bae, K.I., 2006,J. Nat. Prod. Sci.,12 (1), 29–37.
20. Umamaheswari, M., Asokkumar, K., Sivashanmugam, A.T., Remyaraju, A., Subhadradevi, V., and Ravi, T.K., 2009, J. Ethnopharmacol., 124 (3), 646–648.
21. Apaya, K.L., and Chicioco-Hernandeez, C.L., 2011, J. Med. Plant Res., 5 (2), 289–292.
22. Azmi, S.M.N., Jamal, P., and Amid, A., 2012, Int. Food Res. J., 19 (1), 159–165.
23. Septianingsih, U., Susanti, H., and Widyaningsih, W., 2012, Jurnal Ilmiah Kefarmasian, 2 (2), 153– 163.
24. Wang, S.Y., Yang, C.W., Liao, J.W., Zhen, W.W., Chu, F.H., and Chang, S.T., 2008, Phytomedicine, 15, 940–945.
25. Sarawek, S., 2007,Dissertation, Florida, University of Florida.
26. Indarti, D., and Asnawati, 2011,Jurnal Ilmu Dasar, 12 (2), 200–209.
27. Oliveira, J.E., Mattoso, L.H.C., Medeiros, E.S., and Zucolotto, V., 2012,Biosensors, 2 (1), 70–82. 28. Amri, C., Siswanta, D., and Mudasir, 2009,Indo. J.
Chem., 9, 254–260.
29. Shan, C., Yang, H., Han, D., Zhang, Q., Ivaskab, A., and Niu, L., 2010,J. Biosens. Bioelectron., 25 (5),1070–1074.
30. Demirkiran, N., and Ekinci, E., 2012, Acta Chim. Slov.,59 (2), 302–306.
31. Zhao, C., Wan, L., Wang, Q., Liu, S., and Jiao, K., 2009,Anal. Sci., 25, 1013–1017.
32. Iswantini, D., Nadinah, Darusman, L.K., and Trivadila, 2012,J. Biol. Sci., 9, 504–508.