DOI: 10.12928/TELKOMNIKA.v13i3.2095 859
Measurement of Ultra Wideband Channel Sounding
Using Vector Network Analyzer
Ahmed Alshabo*1, Peter Vial1, Montserrat Ros1, David Stirling1 Muhammad Abu Bakar Sidik2
1School of Electrical, Computer & Telecommunications Engineering, University of Wollongong,
Australia, Northfields Avenue, Wollongong, Ph./Fax:+614221-3452-5474 2Institute of High Voltage and High Current (IVAT), Universiti Teknologi Malaysia,
Malaysia, Ph.+607-5535717
*Corresponding author, e-mail: [email protected], [email protected], [email protected], [email protected], [email protected]
Abstract
This paper analyzes the measurement of ultra wideband (UWB) noise channels in different indoor environments. All measurements are done using a vector network analyzer (VNA) which allows us to measure the noise channel transfer functions. We find that the noise power of the system is decreased by increasing the intermediate frequency (IF) bandwidth which leads to an increase in time taken to perform measurements of the channels. The environmental noise power been measured and find that it decreased when enclosed in a Faraday cage (steel shed), within an intense multipath measurement environment. Also, the Environmental noise decreases slightly by using the LPDA antenna compared to using the Teardrop and Horn antennas. Our results show that the Horn antenna is less suitable for UWB channel measurements compared to the LPDA directional antennas because of lower S11 (Return Loss) values. While for omnidirectional antennas, the Teardrop antenna is much more suitable than the monocone antennas for UWB measurements (due to lower S11 values) and decreases the Environmental noise power. As secondary application, we show how a frequency detection device can be used to re-adjust a maladjusted frequency selection on a remote controller for a garage door, in presence of environmental noise power.
Keywords: indoor ultrawideband (UWB), noise channels
Copyright © 2015 Universitas Ahmad Dahlan. All rights reserved.
1. Introduction
Over the last few years, many researchers have studied and reported on various Ultra Wideband (UWB) Communication Systems. UWB radio techniques allow low power data transmission over an extremely wide range of bandwidth in the indoor environment [1, 2]. Accurate characterization of UWB channel propagation is essential to many communication systems [3, 4]. In order to validate the UWB radio channel measurements, the following three factors need to be investigated: the noise level of the system, the light inside the measurement environment and the environmental noise power.
2. Related Work
Ultra wideband (UWB) Communications Technology is a new technology which has emerged in the last twenty years and is used especially for indoor environments. It is more commonly used for industrial applications such as UWB electromagnetic sensors and UWB radar applications. UWB technology has been used for accurate indoor localization applications [3-7]. There have been many studies of UWB radio channel measurements in order to study the channel characteristics [3], [8-37] in different environments and scenarios. A correct calibration process of the measurement setup is necessary for accurate measurement of wireless channels. A VNA can be defined as an instrument that can measure the channel parameters (S-parameters) of physical wireless networks, such as phase and amplitude. In [18] the authors kept the indoor environment as static as possible during their UWB channel measurements. The authors in [11] did not identify whether the passenger moved at all during measurement or not. In [32, 33] they investigated the influence of different scenarios in a car occupied by four persons and in empty cars on the UWB radio propagation channels and discussed the passenger influence on the measured channels. However, they did not mention whether the passengers were in a stationary or non- stationary situation. They also indicated that the measurements were performed with calibration of VNA – ZVC over frequency the range of three to eight gigahertz. The UWB channel measurements were kept stationary by ensuring that there was no movement of people inside the measurement environments in [10-11], [15, 22], [25-26], [29, 31]. Although the authors in [29], said that the measurements were in a near static environment, it is not clear whether the environment was stationary. The authors in [8, 9] measured non-stationary UWB radio channels. So the channels were time-variant and were affected by the movement of people. The authors in [3], [12-14], [17], [19-21], [23-24], [27, 34], [36-37] did not identify whether measurements were performed in stationary or non-stationary environments. The authors in [3, 8], [12-17], [19], [21-30], [34-37] did not mention the value of the Intermediate Frequency (IF) Bandwidths which were used. The IF bandwidth is a very important parameter since it results in an increase or a decrease in the noise level of the system and time measurement sweeping as well as determining the threshold of the strongest path.
In [38] they undertook a study which measured the wireless channel in order to detect the presence and measure the amount of adulteration of diesel and gasoline with kerosene, using typical UWB sensor components. They also do not identify whether the measurements were taken in stationary or non-stationary environments. In [26] the authors use a threshold of 25 dB below the strongest path for cases of LOS and NLOS in order to measure the power delay in the arrival time of resolved multipath electromagnetic rays.
On the other hand, in [24] they used a threshold of 30 dB and 20 dB below the strongest path in order to avoid the effect of noise on the arrival time of the multipath in cases of LOS and NLOS, respectively. They also did not mention the value of the intermediate frequency bandwidth which was set as measurement parameters and this will affect the noise level of the system. This will also have an effect on the strongest path of the measured wireless channel. The authors in [17] measured the UWB channel in an offshore oil platform and used an IF bandwidth of 3 kHz in their measurements and a threshold of 30 dB below the strongest path to avoid the effect of noise on the arrival time of multipath rays.
The literature indicates that the noise energy varies over the time and frequency band and the UWB signals are affected by the environmental noise. The Ultra Wideband Noise is composed of thermal noise and the other interference narrowband signals such as radar signals and communication signals. In UWB applications, some practical approaches need to be improving the UWB radar signal performance that does not correlate with the UWB noise to avoid any interference and unwanted signal at the receiver. While radar signals will affect measurements, they are not normally encountered outside of aviation [39].
3. Measurement Methodology
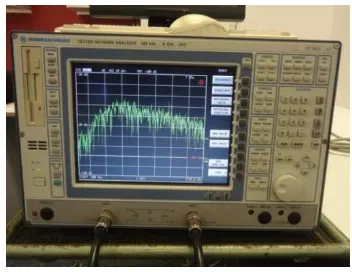
we use a two port, Rohde & Schwarz ZVC- vector network analyzer. This device is shown in Figure 1.
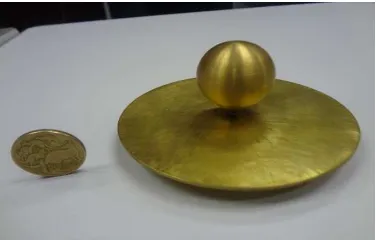
Two identical semi-rigid CRA213/V coaxial cables with a length of 2.5 metres and a frequency range from DC to 18 GHz were used in these measurements. Both cables are terminated by male 50 Ohm N-Type connectors. Two identical monocone antennas of the type shown in Figure 2 were used in the measurements for this study. The connection of the measurement set-up is shown in Figure 3.
Figure 1. The vector network analyzer (VNA) used in this study
Figure 2. UWB monocone antenna with ground plane of 100 mm
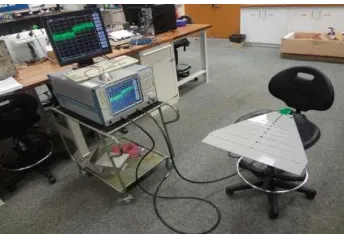
Figure 3. Measurement set-up
Table 1. Measurement Parametres
Paremeter Value Measured Bandwidth 300 MHz-8GHz
Frequency Points 1601
IF filter Bandwidths 10kHz,1kHz and 10Hz Sweep Time 272.77s,9.46s and810.49 ms Transmitting Power -10 dBm
UWB Antennas gain 0 dBi (typical) Antennas Height 100 cm
Figure 4.UWB LPDA antenna Figure 5. UWB Horn Antenna
Figure 6. UWB Teardrop antenna with ground plane of 100 mm
3. Measurement and Analysis and Disscusions 3.1. The Noise Power of the Device (VNA)
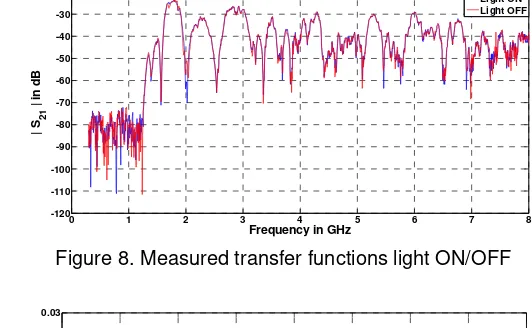
For this study, the noise power of the device (VNA) has been measured at 10 kHz, 1 kHz and 10 Hz, as shown in Figure 16 where we can see that, decreasing the IF bandwidth, decreases the noise power. This leads to a corresponding increase in the time taken to measure the channel (as shown in Table 1 on sweep time). Experiments are also conducted in the presence and absence of fluorescent lighting. Figure 17 shows the channel transfer function with the light on and with the light off. Figure 18 shows the absolute value difference between them. It can be clearly seen that the measured wireless channel is affected slightly by the presence of fluorescent light inside the measurement environment over the frequency range of 1.5 to 8 GHz.
Figure 7. Noise power of the device (VNA) at 10 kHz, 1kHz and 10 Hz
0 1 2 3 4 5 6 7 8
-160 -150 -140 -130 -120 -110 -100 -90 -80 -70 -60
Frequency in GHz
| S
21
| in
d
B
` Figure 8. Measured transfer functions light ON/OFF
Figure 9. Absolute value difference of measured transfer functions light ON/OFF
3.2. Environmental Noise Power and Return Loss
In this experiment, the noise powers of the measurement environment are measured using a VNA in two scenarios, one of which includes the presence of a fluorescent light source while the other does not. The two measurements are conducted in the same room in order to determine the effect of light sources on this noise. This noise is represented by transfer function (S21).We call this noise ‘environmental noise power’ (ENP) and to measure it, we need to connect port 1 on the VNA to an N-type match connector and port 2 to the UWB antenna. This leads to receiving only the power coming from all objects inside the measurement environment. The connection of the measurement set-up is shown in Figure 10. Figure 7 shows the environmental noise in both cases. Figure 8 shows the absolute value difference between the environmental noise powers. It can be seen clearly that the light has a slight effect on the magnitude of the S21 scattering parameter in the frequency span of 5-8 GHz. At the other frequencies, the difference between them is approximately equal to zero. We measured the Environmental Noise of LPDA and Teardrop antennas by connecting the matched connector to Port 1 on VNA and the tested antenna on port 2 on the VNA. We measured S21 Parameter of the wireless channel. We found that, the Environmental noise decreases slightly when using the LPDA antenna compared to the Teardrop and Horn antennas. The measured results are shown in Figure (11, 12) respectively.
Figure 10. Measurement set-up OF THE Environmental Noise
Figure 11. Measured environmental noise power LPDA and Teardrop antennas.
Figure 12. Measured environmental noise power LPDA and Horn antennas
Figure 13. Measured environmental noise power LPDA and Teardrop antennas
To measure the Return Loss S11 of the LPDA, Horn, Teardrop and Monocone antennas, we connected the matched connector to the receiver side (Port 2) on the VNA and the tested antenna to the Transmitter side (Port 1) on the VNA. The connection of the measurement set-up is shown in Figure 10. In these measurements, we used the VNA, two
0 1 2 3 4 5 6 7 8
Environmetal Noise of Teardrop Antenna Environmetal Noise of Monocone Antenna
0 1 2 3 4 5 6 7 8
Environmetal Noise of LPDA Antenna Environmetal Noise of Horn Antenna
0 1 2 3 4 5 6 7 8
identical Semi-rigid cables of length 2.5m each, the number of frequency points was wet to 201, the transmitted power PTX= -10 dBm, the frequency range was 300MHz to 8GHz and the height of transmit antenna was 80cm. Then we measured S11 from the VNA screen. Figure 14 shows the measured Return loss (S11) of the LPDA and the horn antennas. Comparing the graphs we found that, using the LPDA antenna the return loss decreases almost by almost 15 dB over the entire range of frequencies. While Figure 15 shows that the Return loss decreases more when using the Teardrop antenna compared to using the Monocone antenna.
Figure 14. Measured Return loss of LPDA and Horn antennas
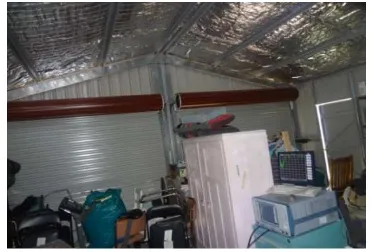
We located a steel (colorbond) garage on steel slab-reinforced concrete. This produced radiation. We then measured the environmental noise inside the steel garage. This garage is totally made from steel as can be seen in Figure 18. This internal structure provides a multipath intensive environment. The measurement was set by connecting the N-type match connector to port 1 in the VNA. Figure 19 shows the noise measurement of the garage. By comparing the measurements in Figure 16 and Figure 19, we can see that the environmental noise is less in the garage than in the laboratory.
Figure 15. Measured Return loss of Teardrop and Monocone antennas
Figure 16. Measured environmental noise power with / without light
Figure 17. Absolute value difference of measured environmental noise Powers with / without light
Figure 18. Steel garage
Figure 19. Environmental noise measured inside the steel garage
3.3 Remote Contral of Garage Door
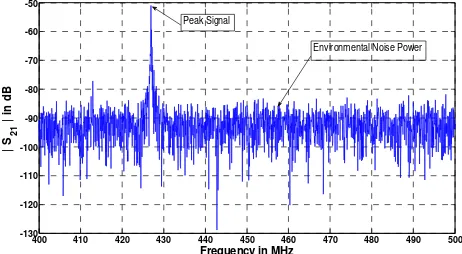
We also used the VNA as a signal detector to repair the frequency setting of a maladjusted remote control garage door operating device by configuring the following settings on the VNA: start frequency =400 MHz , stop frequency = 500 MHz, number of frequency points = 1601, IF bandwidth = 10 KHz and transmitted power = -10 dBm. We connected the match connector to port 1 on the VNA and we connected port 2 to the UWB antenna. We then turned on the device and measured the transfer function (S21) of this signal. Figure 20 shows the noise power and the measured peak signals of the defective device at a frequency of 427 MHz. After that, we adjusted the device’s set frequency point manually and observed the peak signal on the VNA screen until we attained a peak signal at a frequency of 433 MHz, as shown in Figure 21. This was then tested on the garage door system and found to operate normally. This application shows how the VNA can be used as a signal detector for a garage door remote control in the presence of environmental noise power.
Figure 20. Peak signal of defect remote control of garage door
Figure 21. Peak signal of fixed remote control of garage door
4. Conclusion
Based on our measurements and analysis, we conclude that the noise is decreased by increasing the IF bandwidth. This leads to the need for more time to take channel measurements. The wireless channels are also shown to be affected by fluorescent light sources inside the measurement environment over the frequency range between 5 to 8 GHz. We measured the environmental noise inside the measurement environment and found that fluorescent light sources had a small effect on it. In the steel garage, we found that the environmental noise decreased significantly compared to the measurements performed in our laboratories. We also found that, the Environmental noise decrease slightly by using LPDA antenna compared to the Teardrop and Horn antennas. Figures 14 and 15 show that the LPDA antenna is more suitable for the UWB channel measurements than the Horn directional antennas. While for omnidirectional antennas, the Teardrop antenna perform better than the monocone antennas. Based on figures 20 and 21, the VNA can be used as a detector and to adjust the frequency of remote control garage door controllers in the presence of environmental noise. Future work will investigate the effects of the movement of people inside the measurement environment.
Acknowledgements
The authors wish to gratefully acknowledge the help of Dr. Madeleine Strong Cincotta in the final language editing of this paper.
References
[1] J Gomes, BK Mishra. Performance Evaluation of UWB Wireless Link. International Journal of Information & Network Security (IJINS). 2012;1(3): 188-199.
[2] L Jinhu, M Feihu. An improved Channel Estimation Algorithm for Ultra Wideband Wireless Communication Systems. International Journal of Information & Network Security (IJINS). 2013;11(7): 4129-4133.
400 410 420 430 440 450 460 470 480 490 500
-130
400 410 420 430 440 450 460 470 480 490 500
[3] B Alavi, N Alsindi, K Pahlavan. UWB Channel Measurements for Accurate Indoor Localization. in Military Communications Conference. Washington DC, MILCOM 2006IEEE. 2006: 1-7.
[4] HA Khan, WQ Malik, DJ Edwards, CJ Stevens. Ultra wideband multiple-input multiple-output radar. In Radar Conference, 2005 IEEE International. 2005: 900-904.
[5] R Knochel, A Gulck, F Daschner, O Schimmer. UWB-Sensors for Industrial Applications. In Ultra-Wideband, 2007, ICUWB 2007, IEEE International Conference. Singapore. 2007: 529-534.
[6] M Ressler, L Happ, L Nguyen, T Tuan, M Bennett. The Army Research Laboratory ultra-wide band testbed radars. In Radar Conference, Record of the IEEE 1995 International. Alexandria, VA. 1995: 686-691.
[7] Rovn x, kova J, D Kocur. UWB radar signal processing for through wall tracking of multiple moving targets. In Radar Conference (EuRAD), 2010 European. Paris. 2010: 372-375.
[8] QH Abbasi, A Sani, A Alomainy, H Yang. Experimental Characterization and Statistical Analysis of the Pseudo-Dynamic Ultrawideband On-Body Radio Channel. Antennas and Wireless Propagation Letters, IEEE. 2011; 10: 748-751.
[9] F Bellens, F Quitin, F Horlin, P De Doncker. UWB channel analysis within a moving car. In Intelligent Transport Systems Telecommunications, (ITST), 2009 9th International Conference. Lille. 2009: 681-684.
[10] S Chiu, J Chuang, DG Michelson. Characterization of UWB Channel Impulse Responses Within the Passenger Cabin of a Boeing 737-200 Aircraft. Antennas and Propagation, IEEE Transactions. 2010; 58(3): 935-945.
[11] S Chiu, DG Michelson. Effect of Human Presence on UWB Radiowave Propagation Within the Passenger Cabin of a Midsize Airliner. Antennas and Propagation, IEEE Transactions. 2010;58(3): 917-926.
[12] BM Donlan, DR McKinstry, RM Buehrer. The UWB indoor channel: large and small scale modeling.
Wireless Communications, IEEE Transactions. 2006;5(10): 2863-2873.
[13] MA Elmansouri, DS Filipovic. Pulse Distortion and Mitigation Thereof in Spiral Antenna-Based UWB Communication Systems. Antennas and Propagation, IEEE Transactions. 2011; 59(10): 3863-3871. [14] J Gelabert, DJ Edwards, CJ Stevens. Experimental evaluation of UWB wireless communication within
PC case. Electronics Letters. 2011; 47(13): 773-775.
[15] M Ghaddar, L Talbi. NLOS UWB Undermining Experimental Characterization & Performance Evaluation Using MB-OFDM. Proceedings of the Progress In Electromagnetics Research Symposium. Marrakesh. 2011: 1530-1534.
[16] SS Ghassemzadeh, R Jana, CW Rice, W Turin, V Tarokh. A statistical path loss model for in-home UWB channels. In Ultra Wideband Systems and Technologies, 2002. Digest of Papers. 2002 IEEE Conference. Baltimore. 2002: 59-64.
[17] L Hong, J Meng, S Li, Z Zhou. UWB Channel Measurement and Data Analysis in Offshore Oil Platform. In Communications and Mobile Computing, 2009. CMC '09. WRI International Conference. Washington. 2009: 476-480.
[18] V Hovinen, M Hamalainen, T Patsi. Ultra wideband indoor radio channel models: preliminary results. In Ultra Wideband Systems and Technologies, 2002. Digest of Papers. 2002 IEEE Conference. Baltimore. 2002: 75-79.
[19] Y Katayama, K Terasaka, K Higashikaturagi, I Matunami, A Kajiwara. Ultra-Wideband Impulse-Radio Propagation for In-Vehicle Wireless Link. In Vehicular Technology Conference, 2006. VTC-2006 Fall. 2006 IEEE 64th. 2006: 1-5.
[20] J Keignart, N Daniele. Subnanosecond UWB channel sounding in frequency and temporal domain. In Ultra Wideband Systems and Technologies, Digest of Papers, 2002 IEEE Conference. Baltimore. 2002: 25-30.
[21] T Kobayashi. Measurements and Characterization of Ultra Wideband Propagation Channels in a Passenger-Car Compartment. In Spread Spectrum Techniques and Applications, 2006 IEEE Ninth International Symposium on. Manaus-Amazon. 2006: 228-232.
[22] L Liang, SV Hum. Experimental Characterization of UWB Beamformers Based on Multidimensional Beam Filters. Antennas and Propagation, IEEE Transactions. 2011; 59(1): 304-309.
[23] A Muqaibel, A Safaai-Jazi, A Bayram, AM Attiya, SM Riad. Ultrawideband through-the-wall propagation. Microwaves, Antennas and Propagation, IEE Proceedings. 2005: 581-588.
[24] Y Nakahata, K Ono, I Matsunami, A Kajiwara. Performance Evaluation of Vehicular Ultra-Wideband Radio Channels. In Vehicular Technology Conference, VTC 2008-Fall, IEEE 68th. Calgary. 2008: 1-5. [25] B Nkakanou, GY Delisle, N Hakem. Experimental evaluation of the ultra-wideband propagation
channel in an underground mine. In Antennas and Propagation (APSURSI), 2011 IEEE International Symposium. Spokane. 2011: 2781-2784.
[27] MA Osman, M Rahim, M Ali, N Samsuri, M Kamarudin. Compact fully textile UWB antenna for monitoring applications. Microwave Conference Proceedings (APMC), 2011 Asia-Pacific. Melbourne. 2011: 1438-1441.
[28] S Redfield, S Woracheewan, L Huaping, P Chiang, J Nejedlo, R Khanna. Understanding the Ultrawideband Channel Characteristics Within a Computer Chassis. Antennas and Wireless Propagation Letters, IEEE. 2011; 10: 191-194.
[29] Y Rissafi, L Talbi, M Ghaddar. Experimental Characterization of an UWB Propagation Channel in Underground Mines. Antennas and Propagation, IEEE Transactions. 2012; 60(1): 240-246.
[30] J Salmi, AF Molisch. Propagation Parameter Estimation, Modeling and Measurements for Ultrawideband MIMO Radar. Antennas and Propagation, IEEE Transactions. 2011; 59(11): 4257-4267.
[31] T Santos, J Karedal, P Almers, F Tufvesson, A Molisch. Modeling the ultra-wideband outdoor channel: Measurements and parameter extraction method. Wireless Communications, IEEE Transactions.
2010; 9(1): 282-290.
[32] M Schack, R Geise, I Schmidt, R Piesiewiczk, T Kurner. UWB channel measurements inside different car types. Antennas and Propagation, EuCAP 2009, 3rd European Conference. Berlin. 2009: 640-644. [33] M Schack, J Jemai, R Piesiewicz, R Geise, I Schmidt, T Kurner. Measurements and Analysis of an
In-Car UWB Channel. Vehicular Technology Conference, VTC Spring 2008, IEEE. Singapore. 2008: 459-463.
[34] V Sipal, J Gelabert, B Allen, C Stevens, D Edwards. Frequency-selective fading of ultrawideband wireless channels in confined environments. Microwaves, Antennas & Propagation, IET. 2011; 5(11): 1328-1335.
[35] J Song, HT Hui. Characterization of uncertainties in RF adapters for EMC measurements. Asia-Pacific International Symposium and Exhibition on Electromagnetic Compatibility. Melbourne. 2013: 131-133. [36] W Sörgel, M Pauli, W Wiesbeck. DIRECTIONAL UWB INDOOR PROPAGATION MEASUREMENTS.
XXVIIIth General Assembly of International Union of radio Science (URSI). New Delhi, India. 2005. [37] G Yang, QX Chu, ZH Tu. An ultra-wideband antenna with notched bandwidth by using open-ended
slots. Asia-Pacific Microwave Conference (25th: 2011: Melbourne, Vic.). Melbroune. 2011: 1834-1837. [38] B Levitas, J Matuzas, G Viswanath, V Basalingappa, V Venkoparao. UWB based oil quality detection.
Ultra-Wideband (ICUWB), 2011 IEEE International Conference. Bologna. 2011: 220-224. [39] Taylor JD. Introduction to ultra-wideband radar systems.Boca Raton: CRC Press. 1941.
[40] A Alshabo, D Stirling, M Ros, P Vial, B Wysocki, T Wysocki. An approach to Ultra Wideband Channel Calibration using a Vector Network Analyzer. Australian Journal of Elctrical & Electronics Engineering.