ISSN: 1693-6930
accredited by DGHE (DIKTI), Decree No: 51/Dikti/Kep/2010 275
Characterization of Polymeric Chemiresistors for Gas
Sensor
Budi Gunawan1*, Muhammad Rivai2, Hendro Juwono3
1
Department of Electrical Engineering, Faculty of Engineering, Universitas Muria Kudus, Kudus, Indonesia
2Department of Electrical Engineering, Faculty of Industrial Engineering, ITS, Surabaya, Indonesia
3
Department of Chemical, Faculty of Mathematics and Nature Sciences, ITS, Surabaya, Indonesia
e-mail: [email protected]*
Abstrak
Polimer merupakan materi non konduktifyang dapat menjadi konduktif dengan menambahkan karbon aktif sebagai filler sehingga terbentuk komposit polimer-karbon. Komposit polimer-karbon mempunyai resistansi berubah apabila terkena gas. Konduktifitas komposit polimer-karbon sebagai sensor gas dipengaruhi oleh beberapa faktor, yaitu; jenis gas yang dideteksi, volume gas, suhu dan kelembaban. Untuk mengetahui karakteristik sensor komposit polimer-karbon, telah dibuat sensor polimer dari 6 jenis bahan, yaitu; PEG6000, PEG20M, PEG200, PEG1540, silikon dan squelene. Sensor polimer yang dibuat diuji dengan 9 jenis gas, yaitu; Aseton, Aseton Nitril, Benzena, Etanol, Metanol, Etil Aseton, Kloroform, n-Hexan dan Toluena. Pengujian mengelompokkan menjadi 4 klaster; selektivitas, sensitivitas, pengaruh suhu dan kelembaban. Sensor diuji dalam sebuah chamber terisolasi yang terhubung dengan akuisisi data. Variasi suhu, kelembaban, jenis dan volume gas diberlakukan dalam chamber. Pengolahan data menggunakan koresponden analisis dan regresi. Hasil pengujian didapatkan bahwa setiap sensor dari jenis polimer yang berbeda mempunyai sensitifitas dan selektifitas terhadap jenis gas tertentu. Resistansi sensor mengalami kenaikan dengan kenaikan suhu dan kelembaban lingkungan dengan persamaan garis polinomial orde 2 dan orde 3.
Kata kunci: polimer, resistansi, selektifitas, sensitifitas, sensor gas
Abstract
Polymer is a non conductive materialthat can be conductive with carbon black filler to form polymer-carbon composite. polymer-carbon composite’s resistance changes with gas. The conductivity of polymer-carbon composite is influenced by several factors,i.e. type of gas, volume of gas, temperature and humidity.. This research characterizes the polymer-carbon composite sensor from 6 types of polymers: PEG6000, PEG20M, PEG200, PEG1540, Silicon and Squelene. The sensors are treated with Aceton, Aceton Nitril, Benzene, Etanol, Methanol, Ethyl Aceton, Chloroform, n-Hexan and Toluene. This characterization are grouped into 4 cluster according to their selectivity, sensitivity, influence of temperature and humidity. sensors are put in an isolated chamber which is connected to data acquisition with the variations of temperature, humidity, type and volume of gas. Correspondence analysis and regression are used to process the data. Test results found that each sensor showed different sensitivity and selectivity towards particular type of gas. Resistance of sensors increases with rising temperature and humidity environment with order 2 and order 3 polynomial equation
Keywords: gas sensor, polymer, resistance, selectivity, sensitivity
1. Introduction
Polymer is one of the chemical matters, which is non conductive naturally. Some types of Polymer can be changed into conductive by adding active carbon. The mixtures of polymer and active carbon are called polymer-carbon composite. The resistance of polymer-carbon composite may change when it is exposed by gas. Each type of polymer has been different resistances. By having the following characteristic polymer-carbon composite can be used as the chemiresistor sensors [1-5].
acetone nitrile, benzene, ethanol, methanol, ethyl acetone, chloroform, n-hexane and toluene [9-15].
2. Research Method
The process of making Chemiresistor sensor is as follows: the polymer is mixed with active carbon in the ratio 1:1, used as a coupling agent who is utilized sodium lauryl sulfate (SLS) 001 gr. The mixing process involves PEG, active carbon and sodium lauryl sulfate (SLS) which are blended in a beaker glass. After that, the mixture was added with aquademin to form a gel. Then the gel is glazed on the board. Next, the board is put into the oven for two hours at 400C. Finally, the board placed in desiccators for 1x24 hours to neutralize the content of oxygen or other gases.
Equipment that is used in this research involves isolated chamber, data acquisition, computers, temperature and humidity sensors, gas injection, nitrogen gas, water heaters and water spray, as shown Figure 1. The six types of sensor are tested in an isolated chamber simultaneously. The result will be read by the acquisition data in real time, and it will be saved as a file. The following is the picture of a tested scheme.
The principle of chamber works as follows: The six polymer sensors are placed in the chamber in a row. Sample gas is injected into the chamber in varying the volume of gas. The test is conditioned in different temperature. The result of data will be acquired by acquisition data, which connect to computer directly.
3. Results and Discussion
3.1. Sensor response to the type of gas
In testing, the nine types of gas are injected into the same of volume, temperature and humidity in the chamber. The results of the data are shown in Table 1.
Figure 1. The testing scheme Figure 2. Mapping selectivity of polymer using R program
Table 1. Resistance Polymer toward the Type of Gas
PEG6000 (Ohm)
PEG20M (Ohm)
PEG200 (Ohm)
PEG1540 (Ohm)
SILICON (Ohm)
SQUELENE (Ohm)
Acetone 319 397 5245 4887 2468 4499
AcetoneNitrile 421 648 6170 5971 5231 6218
Benzena 319 547 5403 2719 4762 5022
Cloroform 357 572 6462 3034 5084 6569
Ethanol 338 548 5635 2278 5078 6176
Ethyl Acetone 357 472 7270 5152 3373 2974
Methanol 357 463 5536 2766 4157 4392
n-Hexane 317 423 4104 2436 4161 4585
Correspondence analysis method in R program is used to see the correlation between the polymer and gas sample, shown in Figure 2.
The picture above shows that the PEG6000 and PEG20M are similar to Silicone with Squelene. PEG1540 and PEG200 have different reaction, and they are not interconnected. The nine gases are clustered into three sections based on the position of nearness between the gases. The first group consists of acetone, and acetone nitrile. The second group consists of methanol, benzene, ethanol, chloroform, toluene and n-hexane. The third group consists of ethyl acetone gas.
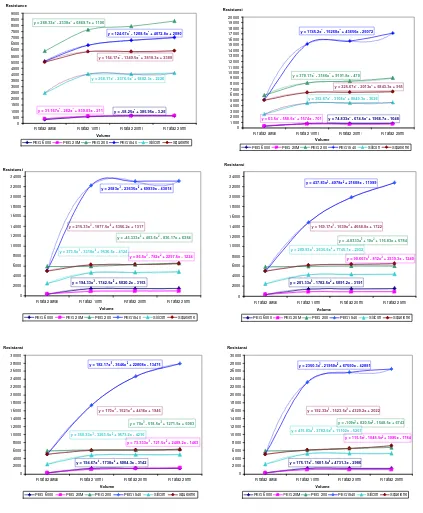
Figure 3. the changes of the resistance of polymer into gas injection y = 175.17x3 - 1601.5x2 + 4731.3x - 2986
R rata2 awal R rata2 10ml R rata2 20ml R rata2 25ml
Volume Resistansi
PEG 6000 PEG 20M PEG 200 PEG1540 Silicon Squelene
y = 194.67x3 - 1738x2 + 5004.3x - 3142
R rata2 awal R rata2 10ml R rata2 20ml R rata2 25ml
Volume Resistansi
PEG 6000 PEG 20M PEG 200 PEG1540 Silicon Squelene
y = 201.33x3 - 1782.5x2 + 5091.2x - 3191
R rata2 awal R rata2 10ml R rata2 20ml R rata2 25ml
Volume Resistansi
PEG 6000 PEG 20M PEG 200 PEG1540 Silicon Squelene
y = 194.33x3 - 1742.5x2 + 5020.2x - 3153
R rata2 awal R rata2 10ml R rata2 20ml R rata2 25ml
Volume Resistansi
PEG 6000 PEG 20M PEG 200 PEG1540 Silicon Squelene
y = 74.833x3
R rata2 awal R rata2 10ml R rata2 20ml R rata2 25ml
Volume Resistansi
PEG 6000 PEG 20M PEG 200 PEG1540 Silicon Squelene
y = -58.25x2
R rata2 awal R rata2 10ml R rata2 20ml R rata2 25ml
Volume Resistance
3.2. Sensor Response to the Volume of Gas
The nine types of gas are injected in varying volume at constant temperature and humidity. To see the changes of the resistance of polymer into gas injection, plotting graphs are made, shown in Figure 3.
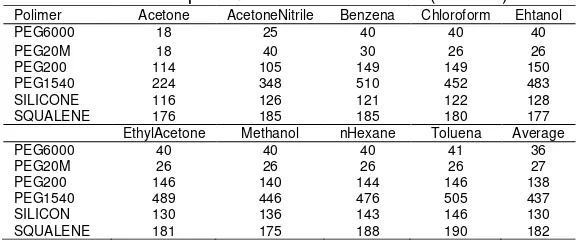
3.3. Sensor Response to the Temperature
To test the effect of temperature, polymer sensors are tested in a chamber by varying temperature conditions in the same of fixed volume of gas and fixed humidity. This test was carried out to find the effect of the rising of temperature to the change of the resistance of each sensor. The average percentages of resistance increases to the rising of temperature and influenced coefficient temperature (ohm/0C). Below are the pictures of the percentage of the average of temperature’s resistance.
In the Table 2 shows that all polymer resistance increases with increasing temperature. The average percentage increase in the range 3% to 29% with the largest increase in polymer PEG1540 and smallest in the silicone.
In the Table 3 shows that all polymer resistance increases with increasing temperature. Average temperature coefficient (ohm/oc) range at 36 ohms to 437 ohms with the largest increase in the polymer PEG1540 and the smallest in the PEG6000
Table 2. Percentage of resistance change
Polimer Acetone AcetoneNitrile Benzena Chloroform Ethanol
PEG6000 11% 14% 4% 4% 5%
PEG20M 7% 27% 24% 0% 3%
PEG200 14% 31% 21% 16% 23%
PEG1540 18% 31% 37% 31% 28%
SILICONE 0% 3% 3% 3% 4%
SQUALENE 5% 2% 12% 4% 1%
EtilAcetone Methanol nHexane Toluena %average
PEG6000 4% 5% 7% 4% 6%
PEG20M 2% 0% 1% 3% 22%
PEG200 22% 17% 17% 10% 19%
PEG1540 36% 12% 35% 31% 29%
SILICONE 2% 2% 5% 3% 3%
SQUALENE 2% 1% 7% 8% 5%
Table 3. Temperature coefficient sensor (Ohm/0c)
Polimer Acetone AcetoneNitrile Benzena Chloroform Ehtanol
PEG6000 18 25 40 40 40
PEG20M 18 40 30 26 26
PEG200 114 105 149 149 150
PEG1540 224 348 510 452 483
SILICONE 116 126 121 122 128
SQUALENE 176 185 185 180 177
EthylAcetone Methanol nHexane Toluena Average
PEG6000 40 40 40 41 36
PEG20M 26 26 26 26 27
PEG200 146 140 144 146 138
PEG1540 489 446 476 505 437
SILICON 130 136 143 146 130
SQUALENE 181 175 188 190 182
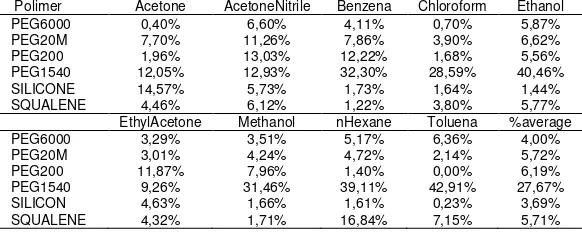
3.4. Sensor Response to Humidity
In testing the humidity, polymer sensors are tested in the chamber in the varying humidity, in the fixed volume of gas and temperature. Table 4 and 5 show the result of the test. In the tables show that all polymer resistance increases with increasing humidity. The average percentage increase in the range 3,69% to 27,67% with the largest increase in polymer PEG1540 and smallest in the silicone.
Table 4. Percentage average increase of resistance to humidity
Polimer Acetone AcetoneNitrile Benzena Chloroform Ethanol
PEG6000 0,40% 6,60% 4,11% 0,70% 5,87%
PEG20M 7,70% 11,26% 7,86% 3,90% 6,62%
PEG200 1,96% 13,03% 12,22% 1,68% 5,56%
PEG1540 12,05% 12,93% 32,30% 28,59% 40,46%
SILICONE 14,57% 5,73% 1,73% 1,64% 1,44%
SQUALENE 4,46% 6,12% 1,22% 3,80% 5,77%
EthylAcetone Methanol nHexane Toluena %average
PEG6000 3,29% 3,51% 5,17% 6,36% 4,00%
PEG20M 3,01% 4,24% 4,72% 2,14% 5,72%
PEG200 11,87% 7,96% 1,40% 0,00% 6,19%
PEG1540 9,26% 31,46% 39,11% 42,91% 27,67%
SILICON 4,63% 1,66% 1,61% 0,23% 3,69%
SQUALENE 4,32% 1,71% 16,84% 7,15% 5,71%
Table 5. Humidity coefficient (ohm/%)
Polimer Acetone AcetoneNitrile Benzena Chloroform Ethanol
PEG6000 18 25 40 40 40
PEG20M 18 40 30 26 26
PEG200 114 105 149 149 150
PEG1540 224 348 510 452 483
SILICONE 116 126 121 122 128
SQUALENE 176 185 185 180 177
EthylAcetone Methanol nHexane Toluena average
PEG6000 40 40 40 41 36
PEG20M 26 26 26 26 27
PEG200 146 140 144 146 138
PEG1540 489 446 476 505 437
SILICONE 130 136 143 146 130
SQUALENE 181 175 188 190 182
4. Conclusion
The testing toward the type of gas shows how each gas is related to each polymeric chemiresistor. The test toward the volume of gas, the test toward the temperature and humidity shows that the resistance of the polymer increases as well as the rising of the volume of gas proportionally. Test toward temperature, type of polymer PEG1540 is experiencing the largest increase, with an average of 29% and the percentage of silicon is the type of polymer that has the slightest increase, with an average percentage of 3%. Test toward humidity, PEG1540 is a type of polymer, which had the largest increase, with an average of 27.69% and the percentage of silicon is the type of polymer that has the tiniest increase, with an average percentage of 3.69%.
Reference:
[1] Atkins PW. Physical Chemistry. 4th ed. New York: W.H. Freeman. 1990.
[2] Chung TC, Kaufman JH, Heeger AJ, Wudl F. Charge Storage in Doped Poly (thiophene): Optical and Electrochemical Study. Phys. Rev. B. 1984. 30(2): p. 702
[3] Department of Chemical Engineering Brigham Young University. Modeling and Data Analysis of
Conductive Polymer Composite Sensors. 2006.
[4] Dian G, Barbey G, Decroix B. Electrochemical synthesis of polythiophenes and polyselenophenes. Synthetic Metals. 1986. 13(4): p. 281-289
[5] Prayitno A, Kubumwe O, Bosma H, Tazelaar E. Efficiency of polymer electrolyte membrane fuel cell stack. TELKOMNIKA. 2011; 9(2): 303-310.
[6] Zee F, Judy J. MEMS Chemical Gas Sensor Using A Polymer-Based Array. The 10th International Conference on Solid-State sensors and Actuators. June 7-10, Sendai, Japan. 1999.
[7] Grodzinsksi Review Electronically Conductive Polymers, Polym.Adv.Technol, 615-625, Weizman
Institute of Science, Rohovot, Israel. 2002.
[8] BaiH, Shi G. Gas Sensors Based on Conducting Polymers. 2006.
[9] Janata J, Josowicz M. Conducting Polymers In Electronic Chemical Sensors. 2002.
[11] Kankare J, Kupila EL. In-situ conductance measurement during electro polymerization. Journal of Electro analytical Chemistry. 1992; 322(1-2): 167-181
[12] Nalwa HS. Handbook of Organic Conductive Molecules an Polymers. 1997; (4): 1-3.
[13] Perepichka FI. Light Emitting Poluthiophene, Weizman Institute of Science, Rohovot, Israel. 2006. [14] Persaud KC. Polymers for chemical sensing. Materials Today. 2005; 8(4): 38-44

![PENELITIAN EKSPERIMEN [Compatibility Mode]](data:image/gif;base64,R0lGODlhAQABAIAAAP///wAAACH5BAEAAAAALAAAAAABAAEAAAICRAEAOw==)