UNIVERSITI TEKNIKAL MALAYSIA MELAKA
FIBER OPTIC SENSOR FOR OLIVE OIL CONCENTRATION
MEASUREMENT AND OPTIMIZATION OF SENSOR
PERFORMANCE
This report submitted in accordance with requirement of the Universiti Teknikal Malaysia Melaka (UTeM) for the Bachelor Degree of Electronic Engineering
Technology (Telecommunications) with Honours
by
SITI ANNISAQ BINTI IDRIS B071210248
910815-09-5016
UNIVERSITI TEKNIKAL MALAYSIA MELAKA
BORANG PENGESAHAN STATUS LAPORAN PROJEK SARJANA MUDA
TAJUK: Fiber Optic Sensor for Olive Oil Concentration Measurement and Optimization of Sensor Performance
SESI PENGAJIAN: 2015/2016 Semester 1
Saya SITI ANNISAQ BINTI IDRIS
mengaku membenarkan Laporan PSM ini disimpan di Perpustakaan Universiti Teknikal Malaysia Melaka (UTeM) dengan syarat-syarat kegunaan seperti berikut:
1. Laporan PSM adalah hak milik Universiti Teknikal Malaysia Melaka dan penulis. 2. Perpustakaan Universiti Teknikal Malaysia Melaka dibenarkan membuat salinan untuk
tujuan pengajian sahaja dengan izin penulis.
3. Perpustakaan dibenarkan membuat salinan laporan PSM ini sebagai bahan pertukaran antara institusi pengajian tinggi.
(Mengandungi maklumat yang berdarjah keselamatan atau kepentingan Malaysia sebagaimana yang termaktub
dalam AKTA RAHSIA RASMI 1972)
(Mengandungi maklumat TERHAD yang telah ditentukan oleh organisasi/badan di mana penyelidikan dijalankan)
iii
DECLARATION
I hereby, declared this report entitled “Fiber Optic Sensor for Olive Oil Concentration Measurement and Optimization of Sensor Performance” is the results
of my own research except as cited in references.
Signature :………
Name : Siti Annisaq Binti Idris
Matric number : B071210248
iv
APPROVAL
This report is submitted to the Faculty of Engineering Technology of UTeM as a partial fulfillment of the requirements for Bachelor of Electronic Engineering Technology (Telecommunication) with honors. The member of the supervisory is as follow:
………
v
ABSTRACT
vi
ABSTRAK
vii
DEDICATIONS
This humble effort specially dedicated to my beloved parents, family, lecturers and friends, whose love can never be forgotten for their support, guidance and
viii
ACKNOWLEDGEMENTS
In the name of Allah S.W.T, The most Merciful and The most Passionate, I am thankful to Allah for enabling me to complete this report.
First and foremost, I would like to thanks to my supervisor Mr. Md Ashadi Bin Md Johari, lecturer of Faculty Technology Engineering for giving me a full cooperation and supervision during the making of this final year report. Not to be forgotten, I would like to thanks my family and my friends for contributing their ideas and also encourage me by giving moral support in completing this report.
ix
LIST OF SYMBOLS AND ABBREVIATIONS ... xv
CHAPTER 1 ... 1
x
2.2 Fiber Optic Sensor ... 10
2.2.1 Advanced on Optical Fiber Sensor ... 10
2.3 Olive Oil ... 17
2.3.1 Olive Oil, Corn Oil and n-3 fatty acids diffrently affect lipids, lipoproteins, platelets and superoxide formation in type II hypercholestrolemia ... 17
2.4 Light Source ... 22
2.4.1 The fundamentals of optical light sources and transmission ... 22
CHAPTER 3 ... 24
3.0 Introduction ... 24
3.1 Flow of Project Methodology ... 24
3.1.1 Title Finding ... 25
3.1.2 Literature Survey/review ... 25
3.1.3 Deciding Raw Material ... 26
3.1.4 Develop Sensor ... 26
3.1.5 Testing Sensor ... 26
3.1.6 Analyze Sensor... 26
xi
CHAPTER 4 ... 35
4.0 Introduction ... 35
4.1 Block Diagram of Project ... 35
4.2 Experiment Result ... 36
4.3 Discussion Result ... 38
CHAPTER 5 ... 44
5.0 Introduction ... 44
5.1 Discussion and Conclusion for Chapter 3 ... 44
5.2 Discussion and Conclusion for Chapter 4 ... 45
5.3 Future Work ... 46
APPENDIX ... 47
xii
LIST OF FIGURES
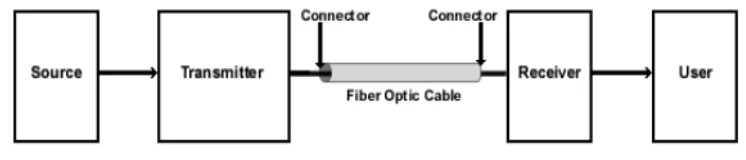
Figure 2.0: Model of “simple” optic data link ... 4
Figure 2.1: Fabrication of MSM fiber ... 8
Figure 2.2: Structure of acoustic sensor ... 8
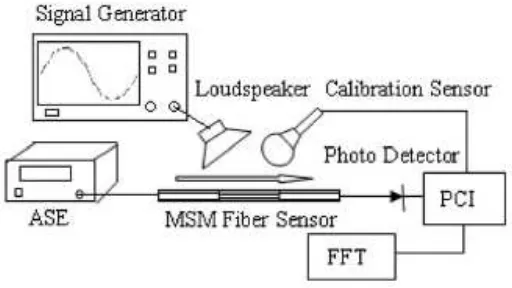
Figure 2.3: Experimental setup for MSM fiber acoustic sensor ... 8
Figure 2.4: Frequency response of MSM fiber sensor to sound wave at 9kHz ... 9
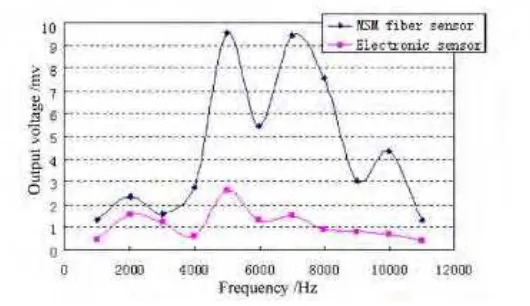
Figure 2.5: Frequency response of MSM fiber acoustic sensor ... 9
Figure 2.6: The relationship between peak wavelength and liquid-level with the surrounding liquid refractive indices ... 11
Figure 2.7: Set-up of the fiber-optic surface plasmon resonance (SPR) sensor proposed ... 12
Figure 2.8: Normalized transmission on spectra of the Miniaturized Long-Period Fiber Grating Assisted Surface Plasmon Resonance Sensor ... 13
Figure 2.9: LPG inscribed in microstructured optical fiber (MOF) filled with ferrofluid ... 14
Figure 2.10: Difference between cladding-mode and core-mode effective indices for different applied magnetic fields ... 14
Figure 2.11: 3D skecth of the ytterbium-doped MOF laser with the MLPGs-A grating cascade ... 15
Figure 2.12: Power Pelad(λp), Pcore(λp), Pavg(λs), Pavg(λs) versus the position along the fober longitudinal axis z, DS-MLPGs ... 16
Figure 2.13: The common optical communications wavelength of 850 to 1550nm fall between the ultraviolet and microwave frequencies in the light spectrum ... 22
Figure 3.0: Show the steps of Project Methodology ... 25
Figure 3.1: Flowchart of the steps taken in Methodology ... 27
Figure 3.2: Stripping process ... 28
Figure 3.3: The cleaving process ... 29
Figure 3.4: The cleaning process ... 30
Figure 3.5: Shows before the fusion splicing process ... 30
Figure 3.6: The fusion splicing process was zoom in ... 31
xiii
Figure 3.8: The fusion splicing process was perfectly done ... 31
Figure 3.9: The complete parameter that have been used ... 32
Figure 3.10: Connector cleaner used to avoid dust ... 33
Figure 3.11: The complete setting for fiber optic sensor ... 33
Figure 3.12: Show the drop of olive oil at the splicing area ... 34
Figure 4.0: Block diagram of Fiber Optic Sensor ... 35
Figure 4.1: Output voltage versus PPM (%) ... 37
Figure 4.2: The graph show the 1st slope for light source 850nm in sensitivity and linearity ... 39
Figure 4.3: The graph show the 2nd slope for light source 850nm in sensitivity and linearity ... 40
Figure 4.4: The graph show the 1st slope for light source 1300nm in sensitivity and linearity ... 40
Figure 4.5: The graph show the 2nd slope for light source 1300nm in sensitivity and linearity ... 41
Figure 4.6: The graph show the 1st slope for light source 1310nm in sensitivity and linearity ... 41
Figure 4.7: The graph show the 2nd slope for light source 1310nm in sensitivity and linearity ... 42
xiv
LIST OF TABLES
Table 2.0: Mean composition of the prodent olive oil and corn oil diets ... 18
Table 2.1: Fatty acids composition of plasma phospholipids after three different diets. ... 21
Table 2.2: Fatty acids composition of platelet phospholipids ... 21
Table 4.0: Show the fiber optic sensor value for voltage and dB of olive oil ... 37
xv
LIST OF SYMBOLS AND ABBREVIATIONS
SBM = Shape-Based Matching
MSM = Multimode-single mode-multimode
MMF = Multimode fibers
SMF = Singlemode fibers
FBG = Fiber Bragg Grating
LPGs = Long Period Grating
DBR = Distributed Bragg Reflector
DFB = Distributed Feedback Bragg
LLS = Liquid Level Sensor
TM = Transverse Magnetic
MOFs = Microstructured Optical Fiber
dB = Decibels
ASE = Amplified Spontaneous Emission
1
CHAPTER 1
INTRODUCTION
1.0 Introduction
Fiber optic cables is well known can transmit data fast and also carry more data than metal cable. In this chapter, it will discuss about the project background. It also consists the problem statement, the objective of this project and the scope of this project.
1.1 Background
Nowadays, fiber optic became the best technology that uses glass (or plastic) threads (fibers) to transmit data. A fiber optic cable consists of a bundle of glass threads, each of which is capable of transmitting messages modulated onto light waves. Fiber optic has several advantages from metal communication. There are, fiber optic cables have a much greater bandwidth than metal cables. This is means that its can carry more data. A fiber optic cable also less susceptible to interference and it’s also much thinner and lighter than metal cables. Data from fiber optic can be transmitted digitally (the natural form computer data) rather than analogically. Unfortunately, fiber optic has the main advantages. There are, the cables are expensive to install. In addition, they are more fragile than wire and are difficult to splice.
2
corrosive or explosive environments. It also has small size to fit in confined areas and can be positioned precisely where needed with flexible fibers.
Olive oil is a fat obtained from the olive (the fruit of Olea europaea; family Oleaceae), a traditional tree crop of the Mediterranean Basin. The oil is produced by pressing whole olives and is commonly used in cooking, cosmetics, pharmaceuticals, and soaps, and as a fuel for traditional oil lamps. Olive oil is used throughout the world and is often associated with Mediterranean countries. The beneficial effects of consuming olive oil are backed by lengthy, painstaking scientific research. Fats and oils have a common denominator in the energy value (9 calories per gram) but the metabolism of each different group differs greatly from the rest. Olive oil contains a series of compounds that are very beneficial to most functions of the human body and its' biological and therapeutic value is related in many aspects to its chemical structure.
1.2 Problem Statement
3
1.3 Objectives
Based on the problem statement above, the objectives for the project are:
i. To study and understand fiber optic sensor.
ii. To develop fiber optic sensor for olive oil detection.
iii. To analyse the performance of fiber optic sensor using analysis technique.
1.4 Project Scope
The main objective of this project is to develop fiber optic sensor. The main scope will be discussed in this project is the used of fiber optic. The main of this project scope is to make the objectives achieved.
The scopes of work are:
1. Study about fiber optic as sensor to find the concentration of olive oil. 2. Analyze the system establishment for fiber optic as sensor.
3. Data analyze is the power loss of the fiber optic.
4. Analysis will be done by used the olive oil as parameters which has different concentration to obtain the result.
4
CHAPTER 2
THEORETICAL BACKGROUND
2.0 Introduction
In this chapter, it will include the explanation of fiber optic, fiber optic sensor and concentration of olive oil.
Figure 2.0: Model of “simple” fiber optic data link.
5
2.1 Fiber Optic
2.1.1 All-Fiber Optic Acoustic Sensor based on Multimode-Singlemode-Multimode Structure [An Sun, 2011]
Introduction
Acoustic sensor can be widely used in different measurement field of city system engineering such as sound pollution monitoring, or structural noise detection which can be employed for the evaluation of structure health. Comparing with electronic acoustic sensor, many advantages such as immunity to electromagnetic interference, long term monitoring and long transmission distance, make optical fiber acoustic sensor more competitive in extreme application environment than conventional methods. So far many optical fiber related acoustic sensing schemes have been reported such as fiber Bragg grating microphone or DFB fiber laser based hydrophone, and so on.
For most of reported optical fiber acoustic sensors, however, complex sensor structures or expensive demodulation systems are often employed that greatly confines the practical application of optical fiber acoustic sensor. In this paper, a novel optical fiber acoustic sensor based on multimode-single mode-multimode (MSM) fiber structure has been studied. Comparing with other reported scheme, the MSM fiber acoustic sensor has the advantages of simple structure and low cost.
Method
Sensing Principle and Experimental Setup
6
transmit from multimode fiber to single-mode fiber, part of light will leaks from the core of MMF to the cladding layer of SMF due to the different core diameter between SMF and MMF, which means that part energy of core mode converse to cladding mode.
When the MSM structure is bended, the transmission loss of sensor will be modulated because the coupling efficiency between different fiber core and cladding changes. So the light intensity coupled into the MMF is fluctuating accordingly. In order to detect acoustic wave, the MSM fiber sensor is attached to a thin metal foil which works as an elastic component.
The single-mode fiber used in the experiment is SMF28 with a 9/125m core and cladding diameter. The multimode fiber is step- index AFS105/125Y with a core diameter and cladding diameter of 105m and 125m, respectively. The MSM structure is fabricated by splice a 3cm single mode fiber between two multimode fibers. The elastic metal foil is a circular aluminium membrane with a thickness of 3m and diameter 3cm. Thee single-mode fiber part of MSM sensor is placed at the middle of foil cross the diameter axis. Both side of MSM fiber structure is attached to foil by glue. And the foil is adherent to a fixed hollow circular mount as shown in
Figure 2.2.
When acoustic wave exert on foil, the sound pressure will induce the deformation of foil, which cause the micro bending of MSM fiber structure. The output intensity of transmission light will fluctuate correspondingly. The vibration then can be detected by measuring the intensity change of transmission light that pass through the MSM fiber sensor. The experimental setup for MSM fiber sensor is illustrated in Figure 2.3.
7
Because the frequency range of acoustic wave is up to 20 kHz, a data acquisition card with a sampling frequency of 44.1 kHz and sampling resolution of 16bits is employed to collect the output signal from photo detector according to Nyquist sampling principle. Finally virtual instrument software based on FFT transform is used to analyse the frequency spectrum of signal.
Experiment is carried on to test the performance of MSM fiber sensor. The acoustic wave is generated through a sine signal generator and a loudspeaker. The typical detected acoustic signal at 9 kHz detected by MSM fiber sensor is show in Figure 2.4, as frequency domain.
It can be seen clearly that strong background noise exists at low frequency caused by instrument and outside equipment. It is verified by using a sound level meter which shows an environmental noise level of 60dBA during the experiment and which can be eliminated by employing suitable band pass filter.
The acoustic frequency is changed from 1kHz to 11kHz with a step of 1kHz and the frequency response of MSM fiber sensor at different frequency is recorded and analysed. In order to calibrate the frequency characteristic of MSM fiber acoustic sensor, an electronic acoustic sensor with a sensitivity of 1.17mV/Pa@1kHz is employed at mean time in the experiment for contrast. The test results are shown in Figure 2.5.
In Figure 2.5, it is clear that both MSM and electronic acoustic sensor can sensitively detect the sound signal within the frequency range of 11 kHz. But two sensors exhibit uneven frequency responses. There are three peaks at 2kHz, 5kHz, 7kHz for both sensors but another peak at 10kHz for MSM fiber acoustic sensor.
8
frequency is beyond 11kHz. But it is possible to achieve a larger frequency detection range by using a proper electronic preamplifier.
Figure 2.1: Fabrication of MSM fiber.
Figure 2.2: Structure of acoustic sensor.
9
Figure 2.4: Frequency response of MSM fiber sensor to sound wave at 9kHz.